See on Scoop.it – Episurveillance
An impressive 3 year study of the ecology of West Nile Ecology using GIS for Spatial Disease Research and Surveillance
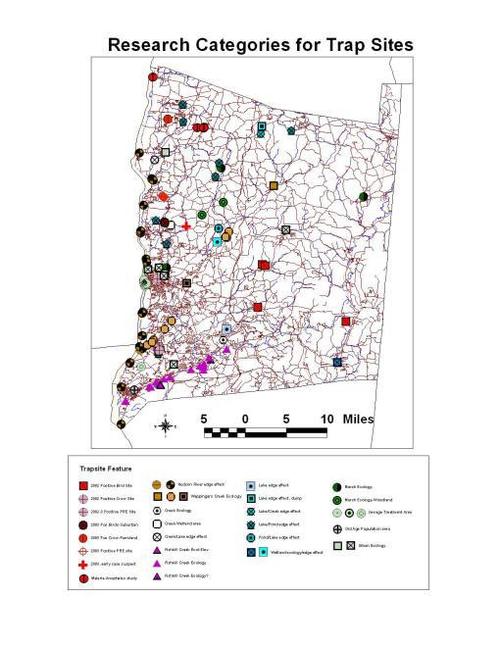
The various maps I produced for west nile research during its first 4 to 5 years of penetration into the U.S. are depicted by the following map’ The pins on this map serve as links to the images/maps provided about each of the points, areas or regions reviewed.
http://www.zeemaps.com/view?group=751431&x=-73.573955&y=41.991774&z=10;
Aside from standard ArcView basemaps and TIGER files, these maps utilized remote sensing, landsat imagery, NLCD, NDVI, DEMs, seamless government base maps, raster imagery, aerial photography, field mapping activities and surveillance, GPS and numerous ArcView Avenue extensions.
Field sampling techniques of point, grid and transect nature were used, including elevation base transect work. Grid analyses, density analyses, spatial analyses add-ons were employed. Ecological and population density reviews were developed. Host-vector spatial distributions/density were evaluated. Temporal trapping histories were reviewed. Species-vector relationships and trap types were documented, dead host birds positive and negative testing were evaluated.
A very large vector swarm late in the year (October) was evaluated.
A handheld photosensor was used to evaluate the relation of sunlight penetration through tree canopy cover to ground surface, in order to realte this to overall species types and densities captured at these traps.
late in 2002, aerial photos were used to predict/define positive testing site features and the likelihood for return of a positive testing vector the following Spring (it returned, which proved that local species carriers could exist and survive the overwinter).
Field analyses and GPSing were used to develop the site ecology, water, canopy and trap information for a positive testing human case of unknown origins. A DEM analysis of a creek floodplain and ravines was used to document species in relation to elevation.
The two major GIS options were used to produce both the vector and raster products.
This work later resulted in my receiving an award for this presentation of several of its components in 2006.
See on www.zeemaps.com
