SEE ALSO WELCOME TO NPHG MAPPING!
.
NOTICE!!
A Survey has been developed to document and compare GIS utilization in the academic and non-academic workplace. This survey assesses for GIS availability and utilization in the workplace, which range from students’s PC/laptop access in academia to GIS technicians’ and statistical analysts’ desks, and IT and Managerial positions. The purpose is to document the level of GIS employment in the workplace with the goal of increasing the utilization of GIS in the typical work settings. GIS is currently underutilized by most companies that hire GIS or spatial analyst technicians. This is due to a variety of managerial and non-managerial reasons linked to the poorly understood applications of this new technology.
This survey, which takes about 20-25 mins to complete (’tis a bit long), can be accessed at
Survey Link
.
Also, be sure to see my sister site being promoted as of May 2013. It is focused on the National Population Health Grid mapping technique I developed and is a standalone that is easier to read and navigate. LINK
………………………………………………………….
![]()
See 3D mapping at PINTEREST
BIOSTATISTICS
This section of my blog deals with the statistical projects I have been engaged in. I have been in and out of academic actively engaged in some sort of numbers study since 1975. I enrolled in at least 4 different departmental statistics series (engineering-calc-vec-fluids-matrices, biology, natural science, psychology (para/non-para) due to my multiple majors/multiple minors opportunities, followed by medical school (3+ yrs) and pharm/allied health (1+ yr) and chemistry training (5 yrs post-bacc), and public health, environmental sciences, GIS/RS and Geography (spatial stats) (6 yrs).
My most important project to date follows–GridEcon–essentially a report generating tool for evaluation population health more wholistically and socioculturally tha the standard methods already out there.
![]()
See 3D mapping at PINTEREST
.
GridEcon (aka GridEcon Matrices) relates to my National Population Health Grid Mapping project (NPHG), which has a very long history of algorithm and programming development and testing (some like to think otherwise). GridEcon is a reporting system designed to provide true customer/patient data in relation to company focused topics such as costs, average utilization, catastrophic cost risk, etc.. This makes use of the NPHG data and products to generate this data which GridEcon uses to generate automated reports with for clients, overseers, managers, etc. These reports are available in numerous forms and pertain to numerous subjects defined as important metrics for any health care program. Subtopical reports are defined by patient/member/consumer subpopulation types (thus the term Matrices), such as gender, race/ethnicity, cultural nature, place, age group subclass, chronic disease history, group-specific disease group histories (all pre-post natal metrics for example). These reports encompass the traditional HEDIS/NCQA and just as many if not more ICDs/groups normally not reviewed by any contemporary QA program.

Result of a flood plain risk assessment algorithm I created in 1997, before the current software tools that do this were developed.
The purpose here around 2004/5 was to upgrade current systems in order to better meet the demands and future needs of future Big Data Electronic Medical Information data industries.
I have also included materials developed from my certifications and experience in the various forms of data management and analysis I had to qualify for over the years and my qualitative research methodology program completion. Some of my tricks of the trade with survey reporting and big numbers analysis are included below, like some modified statistical methods I developed for small group analyses, group sizes that normally we cannot report for.
NOTE: More descriptive information about titles and activities engaged in with Employee Health and Medicaid/Medicare programs are provided in the linked page entitled ‘Quality Assurance’

National and Local grid mapping algorithm
Spatial Analysis: The GridEcon project
The development of a new and revolutionary population health monitoring tool (a matrix tool). This tool makes use of specific grid-mapping techniques developed for electronic medical/disease data evaluations for a given population (reviewed on this site elsewhere), in order to assess regional differences and cost related distributions across the country, or given large research region. The software requirements for this program are basic. The result of this tool would be to produce standard reports and special reports focused on population health features missed by standard HEDIS and NCQA reporting techniques.
(see CURRICULUM VITA page for more)
.
Qualitative Analysis
Non-parametric
Educational Outcomes Measurements. Survey tools were developed in order to test long term impacts of educational programs on students. These surveys consisted of a series of questions (10-20 questions) which asked whether or not the program had an impact on clinical performance or activities, whether or not these activities became part of the standard protocols for the respondent, how many patients were effected by these changes, and a variety of questions targeting specifically the types of changes that were made (information derived from educational materials and course content). Another part of this survey restated the original goals or assertions used to define each program, requiring scalar responses to these statements indicating how much the respondents agreed or disagreed with their content or meaning. These responses were then compared with the same responses provided for these statements as part of the original educational program.
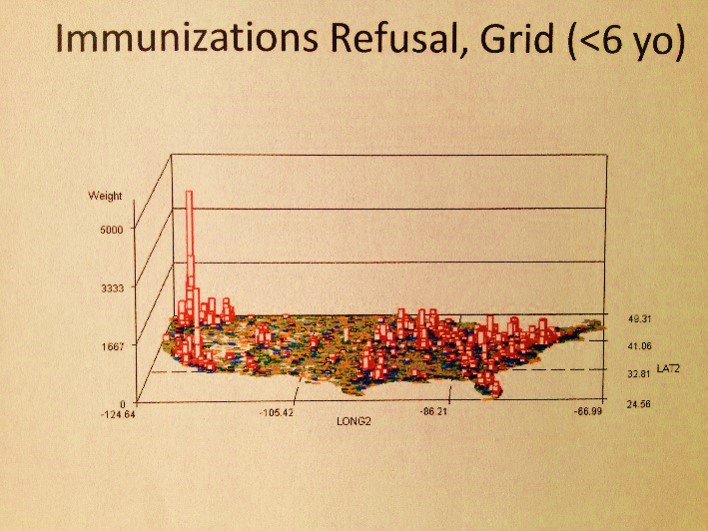
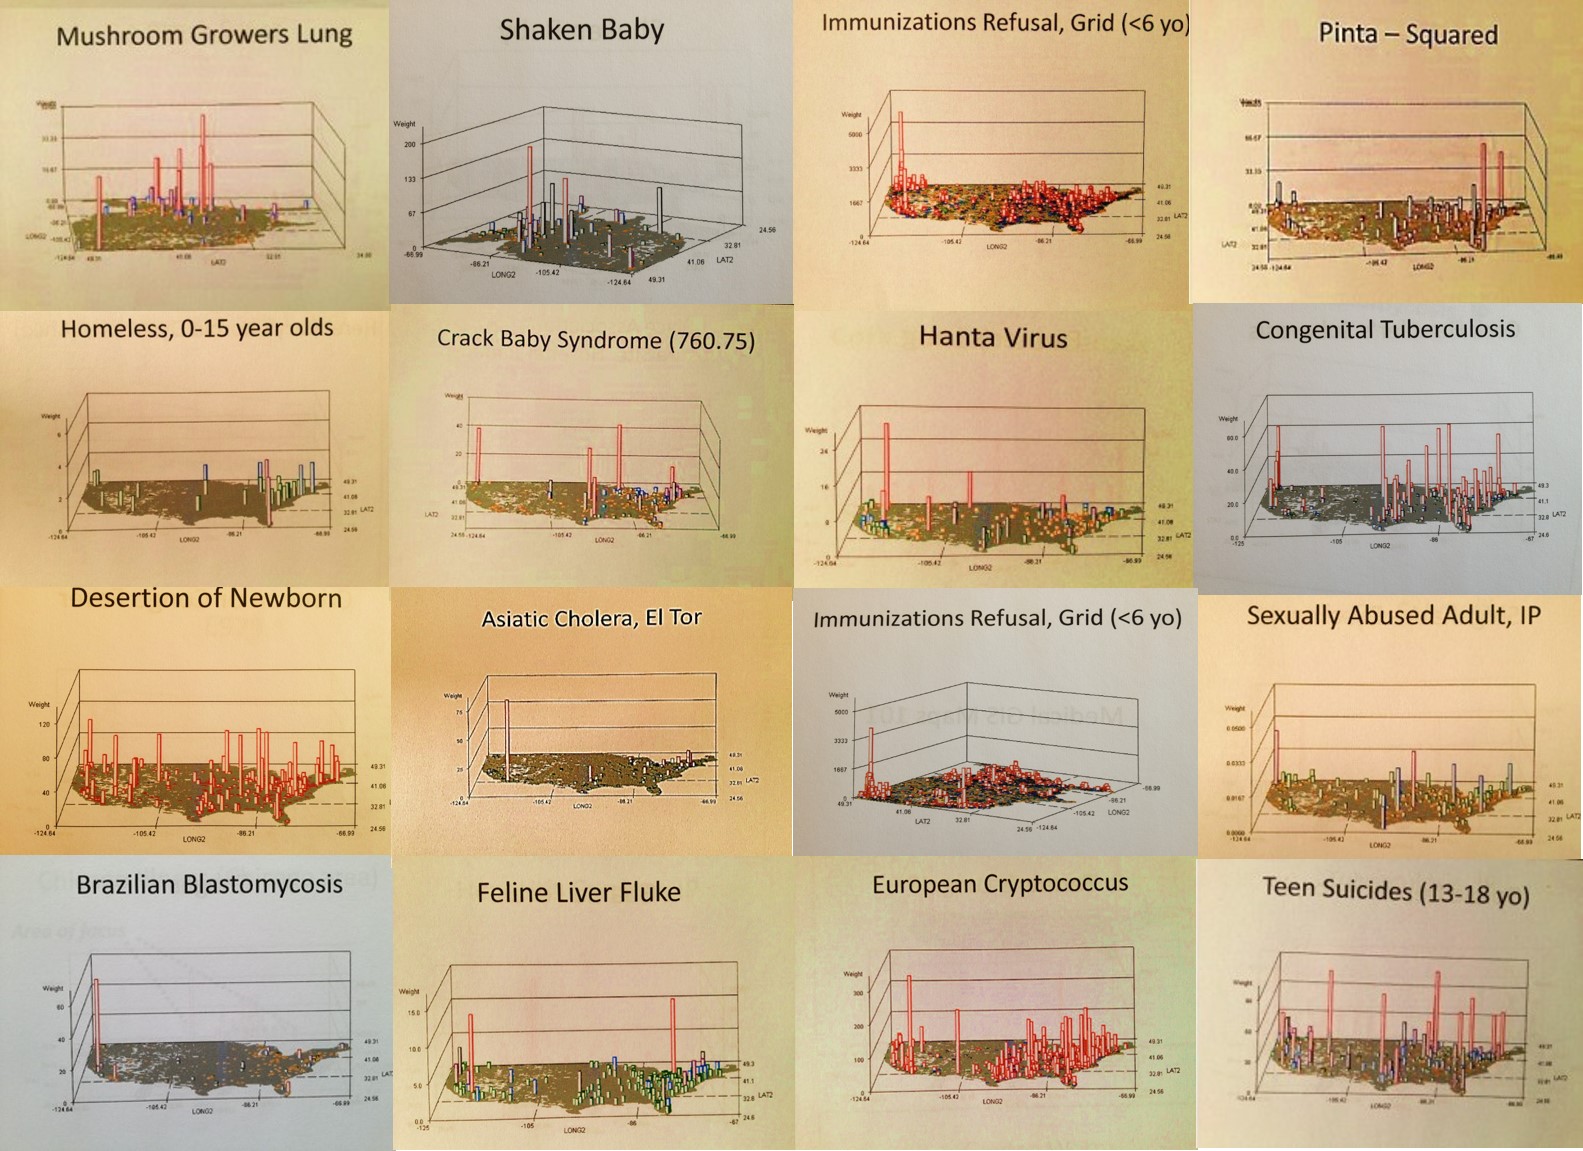
The Pacific Northwest is the center of childhood immunizations refusal.
Quantitative Analysis (Current Work)
Non-parametric
Educational Outcomes Measurements.
Chi Squared Matrix Testing method. Typical reviews select one or a few possible values to test their outcomes against. It is not unusual for such methods to compare unique outcomes to an overall average or median value, or an outcome value chosen to be used as some standard measurement value, for example the national or local average smoking rate. It is more important to compare all outcomes with all possible limits and averages to be assessed for. This means the same formula for testing outcomes has to be tested at not just a few, but perhaps all possible final scores, including all possible whole number scores along with the standard averages and median values. The matrix method of chi square testing tests for outcomes across all levels of predictability or potentiation. Instead of using just a standard chi square of x and y outcomes versus the state x’ and y’ pertaining to the mean, the matrix methods tests for all possible x’ and y’ values and then graphs these results to see where the chi squared value reaches the critical value needed to suggest a successful change has happpened. This variables-related matrix method of chi squared analysis provides further insight into overall program performance, and lets the analyst know the threshold at which change will be noticed based on measurement techniques. This information can then be used to more accurately define a goal, by avoiding the selection of a goal that is too far above the expected based on the patterns of changes noted.
Long Term testing of performance outcomes. The measurement of educational programs requires a review of outcomes for the program throughout its period of production and presentation. This typically means that if a program lasts for a year or more, that throughout the year, the course outcomes (test and survey results) have to be repeatedly evaluated to determine and document the ongoing success of the program. Short-cuts used to perform this evaluation may consist of sampling of results or the selection of certain periods throughout the course when its outcomes should be re-evaluated. This time-consuming and often costly method of course review is probably not necessary. Evidence of studies performed on the long term courses evaluated over 6 to 15 months demonstrated that only the first 3 to 6 months of the program are essential in determining its validity and to define whether or not the program was a success. The build up of data over time effects outcomes received much further along in the program. These data form a foundation of results that becomes increasingly difficult to change or impact as the course progresses. In a statistical sense, it is perhaps best to re-evaluate each section of the program separately. This is not recommended however due to the impact of a decay in learning rates typically seen in most programs. (With time, students know more and more of what they are about to be taught and become more likly to provide a higher score, reducing the differences between pre- and post-test scores.) The best indicator of course success is demonstrated by producing the results of a single evaluation performed betwen 3 and 6 months, assuming the numbers of respondents during this time will total more than 300 to 500 individuals.
Timed Series Analyses. With large datasets containing outcomes information spanning sizeable time periods, we can break the total dataset down into various periods of time and measure the performance rates for each of these time periods. These measurements are done by treating each individual dataset for a given time period as its own unique entity, with a series of statistical measurements taken to determine whether or not it was as success, followed by the analysis of these datasets as cumulative outcomes. The outcomes for unique time period datasets tell us about the individual performance outcomes for the program at that time in the program. The outcomes for cumulative data demonstrate the impact an increasing number of students will have on overall outcomes. With time, a normal program is expected to score better as the dataset size increases. In some cases, we find that programs with questionable success may never reach the goal used to define success. The value of times series measures is it can be used to determine whether or not a particular part of a program may be a problem or a failure, enabling quality analysts monitoring program performance to inform program administrators of this problem and revamp that portion of the program that is apparently failing. Subsequent timed series measures can then be used to demonstrate 1) the success of the change on the new sets of students, and 2) the impact of this change on overall program scores and performance. This addition to outcomes monitoring strengthens any long-lasting interpretations made of this program performance by gatekeepers and funding sources.
Predicted Outcomes. A timed series analysis methodology can be mimicked with the goal of testing wether or not the current performance outcomes suggests possibility for success or failure, were this program to continue. This type of prediction modeling begins with the assumptions that 1) none of the score patterns will change even if we increase the number of students taking this course by 5- to 8-fold, and 2) as a result of this lack of score pattern change, even though the numbers of respondents increase, the overall average for each set of responses remains identical. This assumption, although very unrealistic, assumes the worst logical outcome (no change) and excludes the assumption that outcomes will get significantly worse over time. This last assumption is excluded because it typically is not the case in these programs, even when instructorships and instructor performance change, due to the effect of earlier scoring patterns on later scoring pattern results (foundation for all learning scores). In most cases, variance in response patterns will inevitably change as numbers of respondents increase, but usually hover around the same mean; in most cases , this change has a minimal impact on overall statistical testing outcomes. By repeating the exact same score set 5 to 8 times, a longer score set is produced, averages are not changed, and a new test of outcomes can be performed. This new outcome is considered to be a prediction of outcomes were this exact same program given instead to a much larger population. After 5 or 6 trials of this repeated score pattern testing, we find that scores tend to reach their true statistical outcome were the original N used for this study sufficient to allow for the outcome to be reliable. To date, this scoring method is preferred for testing outcomes of programs that may or may not be allowed to continue–they predict outcomes for these programs. This method may also be used to speculate on programs with very poor attendance. Small programs cannot be statistically tested due to the low n effect. To circumvent this limitation on the use of statistical measurement techniques, the attendence of the program can be artificially increased in order to comment on whether or not a larger class size may have resulted in better results than experience due to low attendence rates.
A 3 x n groups matrix method of chi square analysis for analyzing program outcomes. Recent studies have suggested that there are three types of individuals who attend an edcuational program. There are those who attend the program in order to reinforce what they are already doing. There are those who attend the program in order to become more certain of their performance skills, resulting in the actual onset of the new practice being promoted. The third group of students have some foundation of education and training in this area, but are not ready to consider making any changes in their practice. These three groups have to be tested in matrix format using a 3-group analysis method–the numbers of respondents for each of the three groups are defined and then evaluated in relation to the rest of the class. This is done 3 x n times and all values charted in matrix form, to see which group is impacted the most by a program. Ideally, the best outcomes are related to changes incurred at all levels, but it usually more common to see a program resulting in improvements in both the high and midrange scoring groups, with less and often statistically insignificant impacts npterd for the beginners participating in the program.
The 3-Tiered Method of Analysis
How to plan for and implement a study of pre-, post- and long term follow-up results using both qualitative and quantitative non-parametric techniques. This method, which combines short-term with long-term procedures and utilizes both qualitative and quantitative techniques is reviewed as a part of the Grounded Theory page.
Parametric
