[See prior postings in this blog for a detailed review of the above chart.]
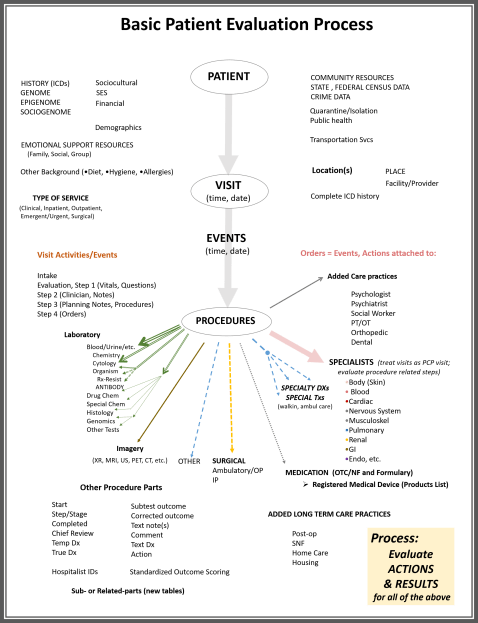
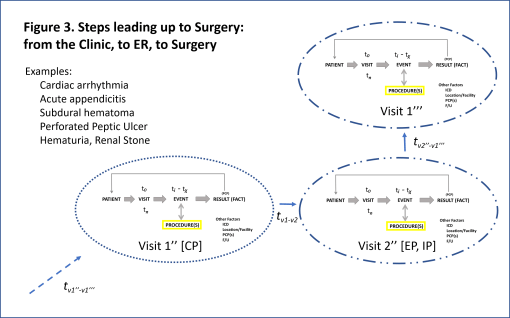
This therapeutic model focuses on the theory that the basic pathway for consists of basic elements or parts that define the entire care giving process. This model starts with the PVP or PVEP assumption, which states that a single patient comes in for a “visit”, which consists of actions or events, and procedures, either of which are engaged in by the provider, his or her medical assistants or staff, various lab technicians, adjunct therapists, counselors, etc.
These series of actions or events that occur all take during one attempt to obtain care. This attempt to obtain care may be as simple as the basic walk-in or annual care visit, or a scheduled visit for an x-ray, EKG or EEG, or a visit to see a specialist, an emergency visit, or in-patient activities that last for days to weeks. The “visit” ends when the care process is completed, and the patient is “discharged” according to electronic medical records.
From admission to discharge constitutes a single care visit, and many billing programs now charge the patient for the visit itself, and for particular portions of that visit considered billable. In more advanced programs, the entire care process or “episode” is evaluated for the billing, known as “bundled”, meaning that an episode that requires only basic care related processes is usually charged the same as an episode for identical care that had complications and required twice as many days, visits, actions, procedures and events.
Many programs still base their billing on a combination of specific billable procedures combined with basic “bundled billing” or some sort of multi-tier (multi-level, multi-complex) care giving process, whereby the basic bundled billing events are still charged equally in spite of their greater frequency in some cases, but these amounts get adjusted to low risk (average or low days of inpatient stay), moderate risk (more than average days), and high risk (many days) billable status.
[For a detailed review of the content of each of these ellipses representing a visit, see the prior posting on this blog.]
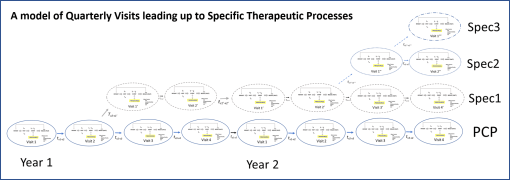
In this basic model there are 8 regular PCP visits, to which 6 special visits are added for care by Specialist 1 or “Spec1”. Specialist 1 related activities in turn result in some discoveries about the patients health status that require a follow up by yet a more specialized care giver, “Spec2”. Then, during the evaluation and care process initiated by Spec2, a new problem emerges, requiring intervention by Spec3. Throughout this time, the patient keeps up his/her visits with the regular PCP.
This above model could very well fit for a midlife person with a diabetes and weight history in need of ongoing management, with endocrine related complications resulting in the need for Spec1, followed by onset of a cardiac problems requiring a heart disease interventionist. Due to the onset of the heart disease condition, the patient develops a need for even more specialized cardiac care, such as a special diet therapy and related surgical intervention (i.e. “stomach stapling”).
Note, this model does not focus on just regular clinical visits. It incorporates emergent care and inpatient visits/events/activities, to fully assess the therapeutic process that is engaged in. In theory, one can compare services and outcomes between agencies, providers, companies, patient groups (race, ethnicity, age, gender, etc.). We can even add some basic cost-related assumptions to this model, and estimate the costs of each of these visits, at the different specialty levels. A common pricing theme used in the past for this modeling has been
- PCP level (“CP”) = basic PCP visit cost + lab and imagery costs
- Spec1 level (CP, but in a specialist’s office) = 1.4 to 1.6 x PCP visit cost + lab + imagery costs + additional therapeutics (genomic testing, nutrition, etc.)
- Spec2 level (ditto) = 1.6-2.0 x PCP visit cost + lab + imagery + additional therapeutics + chronic care related events/procedures costs
- Spec3 level = 2-3x PCP costs + lab + imagery + unique single event- or care process-linked high cost end stage and/or surgical procedures
It helps to add true prices to these events, but theoretical pricing is also very helpful. In addition, so long as the complexity and true cost relationship of later tests are maintained as tests, imagery, therapeutics actions are added to each level, a fairly useful comparison of costs over time can be made for this simple multiple acute/chronic disease patient.
The critical costs developed by this patient take place in the end stage of his or her state. Examples of these events are those that lead to kidney failure and the need for future renal care, acute heart failure brought on by congestive heart disease, heart valve prolapse and failure related to childhood rheumatic fever history, atrial fib or flutter initiation due to underlying genetic, stress and metabolic patterns.
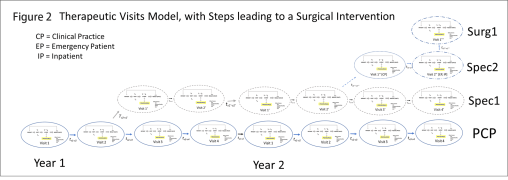
In the above example, this could be interpreted as a patient making a regular visit with a specialist, followed by an unexpected emergency care event, in which the specialist engages in the necessary hospital visits, followed by the decision that some sort of surgical process is needed to improve the patient’s quality of life and perhaps increase his or her lifespan. This particular set of events can be likened to the need for a surgically implanted defib-arrhythmia device, or the need for a oncology surgeon due to a newly discovered metastasis.
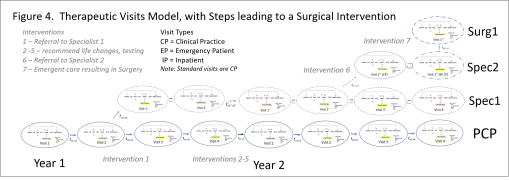
A summarization of this type of process, using the basic modeling technique I developed, is depicted in Figure 4.
The processes that take place for each visit, inferred by the first figure, and which are fairly complex are described in the prior two postings on this method for evaluating managed care that I developed for EMR and Big Data evaluations.
This method of modeling, evaluating and illustrating the results of a study on healthcare patterns can be used to demonstrate differences in practitioner or system therapeutics behavior between various groups. These groups may be:
- mental health [MH] vs. primary physical health {PH] care groups (historically, MH is reduced and PH is increased)
- ED and Ambulatory Care (walk in therapeutic or testing procedures) activities in white vs black populations, or hispanic vs non-hispanic patients.
- IP lengths of stay and activities engaged in during those stays for one group versus another, or one facility versus another
- The amount of reliance upon prescribed medications vs non-Rx methods for prevention and treatment (i.e. exercise nutrition, counseling) for PCP care versus specialty care treatment patterns.
- The ratio of educational, health focused discussions and materials provided to patients, versus cost related imagery and lab events, in program 1 versus program 2.
- The amount of engagement in genomic testing for ethnic group 1 vs. ethnic group 2
In sum, the simplification of the therapeutic process that this modeling method offers researchers has applications across the board for EMR review and quality of care and service evaluations. It may be used to target just specific activities, such as meaningful use measures, or be used to evaluate the entire care process for a complex series of diseases, or applied to analyses and comparison of office visit or hospitalized patient care events (i.e.–in which patients do immediate follow-up proceed more quickly, leading to discharge?).
When costs are added to this model, it can be used to evaluate where excessive costs exist due to systems-related healthcare or administrative defined (policy/procedure related) quality of care or chronic disease mismanagement.
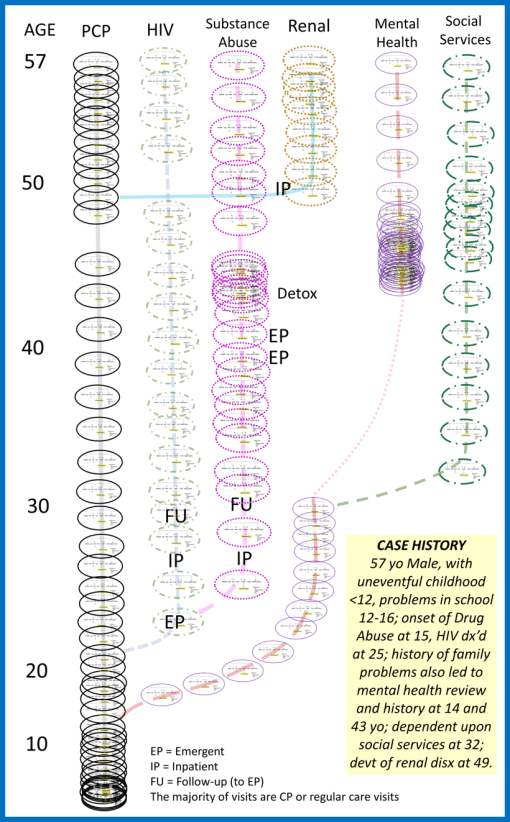
Figure 5. Example of a Case Study review for the evaluation of CP, EP, IP and RP therapeutic processes (RP is inferred by arrows or lines leading to new treatment pathway). Case is a male patient with 45+ years of HIV-Drug Abuse history and related secondary diagnoses, including a 10 years delay in enrollment into an abuse therapeutic program, two periods of mental health assessment and/or treatment, and pre-renal failure at 49 years of age leading to possible onset of Renal Failure by 57 years of age.