Figure: Articles published per Year on Spatial Analysis or GIS utilization in Medical Research, from data acquired through a search using PubMed
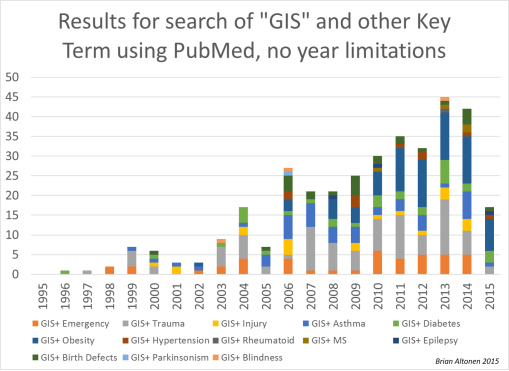
.
Years ago I developed this interpretation of the ten stages of developing and implementing a GIS in the managed care workplace. Managed care was very young then. In fact, managed care did not even exist back then, due to the way we visualize managed care to be today, due to the changes and reporting standards initiated as part of the Obamaplan.
But the real questions to ask are how do we best develop the Obamacare plan, to make it something useful, that can be developed into a more successful disease prevention program? Politicians, healthcare administrators, CEOs, HIT VPs and Directors, and even the developers of this new program never fully envisioned the future of healthcare and IT use, EMR/EHR use standards and potentials.
On fact, only those experienced with all levels of higher level GIS utilization can tell you what can be done with HIT and GIS. It is the hiring and re-hiring of individuals with prior experience in the pre-HIT-GIS medical environment that suppresses advancements from being made in HIT and GIS.
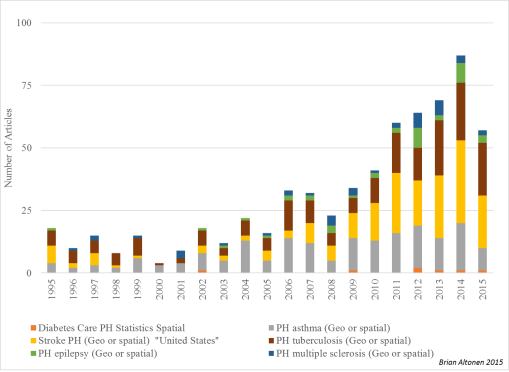
Figure: Articles published per year Spatial or GIS managed disease research, based on PubMed Query
Barriers
This barrier to GIS implementation in managed care does not exist in other part of the healthcare industries. GIS has been used effectively for decades to monitor environmental and climate health and medicine. It is even used regularly to monitor population or demographics related health data, monitor disease outbreaks in the field of epidemiology, and even provide important insights to the healthcare industry at the marketing and finance level.
So why is managed care to very last part of the healthcare industry to implement this new form of medical technology? Barriers exist to GIS implementation in managed care due primarily to unlearned, untrained management, and/or management who can claim to be familiar with its potential applications, but who lack the ability and leaders needles to produce such an HIT that works.
Based upon my personal attempts to develop such a system on my own, in numerous work settings, it is safe to say that a Medical GIS workstation can be developed in 4 to 6 months, be reporting by the end of a year, but to produce many health-specific reports devoted to the population, requires another 6 to 12 months to get four or five standardized large scale reporting tools established, repeatable, and regularly reportable to upper level management. Once that level of reporting is reached, it is the technology, programming, ability of the programmer, the ability of the printer or publisher, and the ability of the warehouse to pull and analyze data, that limits the productivity of the EHR/EMR, HIT/GIS reporting system I developed.
We are not talking about small scale reporting here, such as 40-60 meaningful use measures. We are talking about a system that can adequate describe the population, details all of its medical history and patient-physician healthcare behaviors, detail the topics and behaviors most in need of improvement, especially at the racial level, and document where the worst services are performed, where fraud may be happening, where the poor are being neglected at the dollar per patient level care provided by a particular institution or facility, for a particular set of health related requirements.
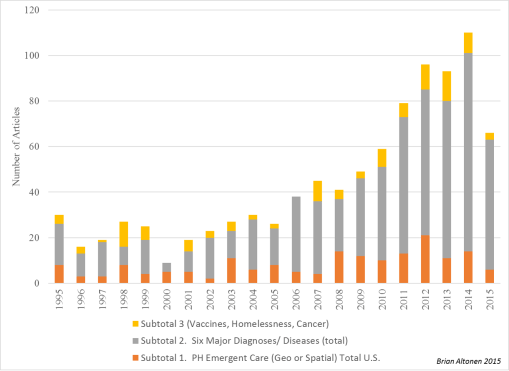
Figure: Three Major Surveillance Topics Researched for Number of Articles in PubMed, on GIS and Public Health (Sociocultural “Hot Topics”, Clinical or Preventive Care of Chronic Diseases, Emergent Care)
Applications
So, why do we need to utilize GIS as part of the managed care process?
We use it to better target our decision making processes. We use it to target interventions, determine where new facilities need to be developed, where costs are too high for the services provided, where hours of operation are underutilized or even wasted. We can also use Medical GIS to answer the questions about where the specific social classes exist and their ways of managing good and bad health related practices most likely to be perpetuated. We can use it to determine which neighborhoods are most likely to suffer a west nile outbreak, or to determine where an illness suffered by a retirement community is likely to hit next in the region. It may be used to map out environmental related birth problems, human genome related birth defects and congenital morbidities, the places where spouse abuse is the greatest, and where child abuse may be at its worst.
There are really no limits to GIS use in managed care. And once an algorithm is written, such as for evaluating child abuse, it can be run and reported on again one yer later, with little effort, and be stored for later use should a need for it suddenly erupt.
In essence, people in the medical GIS/BI fields, like myself, use GIS for documenting failures and successes, identifying where changes need to be implemented in this patient driven profession, determine where the pockets exist in our population health targeted programs, define where we need to go next for preventing unnecessary deaths, or enabling people to live longer live, with the best quality of life.
We also use GIS to define what each business, facility or corporation needs to accomplish. GIS can be used to monitor costs, evaluate the outcomes of particular health care providers or facilities, determine how much growth has occurred at each level of health care activity and management, to determine the next steps and stages in the growth of these providers and facilities.
All managed care groups have some program in process already designed to monitor and score in quality of services. Few of these produce lengthy monitoring tools to score their activities and success, except where required. Even fewer programs have programs in place that are meant to perform steady ongoing surveillance of everything possible in order to document success, develop plans for improvement, and even make predictions about where the next changes need to be made, and where new services will be needed.
The Graphic
In the accompanying stepwise graphic I developed years ago, for defining where a health program rests in terms of its level of achievement in the field, relative to its overall potentials, ten stages of development and advancement were defined. This is how they were defined, as depicted by the images.

Steps to Progress
Step 1.
Agencies use geographic thinking mostly for planning, for trying to better understand their patients and programs (their data), in order to produce a plan of action of what to do next, what to engage in. The spatial images they use serve mostly as descriptive materials, and are produced almost entirely by hand, by artistic expression, not by spatially concise and accurate imagery. Any complicated GIS related reporting requirements are outsourced or subcontracted.
Step 2.
Agencies use the cartographic expression to make their point, prove their point, but mostly at an oversight, superficial level. Regions, places and even detailed program related maps are produced, often by computerized drawing tools and simple image editing software tools, a simple form of mapping data in the form of an extension or Add-in might be employed, such as the geographic images potion of mapping spatial data by region, but without the ability to statistically compare one area with its neighbor without considerable effort. Topological reasoning is usually missing from these processes. The map as a whole serves its most important purpose, usually illustrative. Companies that use the map to compare their success with others or the nation, are examples of such users. As above, complicated GIS work is subcontracted or outsourced.
Step 3.
Some spatial analysis has been developed, and the mapping that occurs is mostly descriptive, sometimes experimented with for prediction and planning purposes. The medical mapper is able to produce maps with specific data that the researcher is able to add, at the point, line or polygon (area) level. The analyses done using these maps is visual and hypothetical, drawn primarily from interpretations made of the maps, not much statistical modeling of the data and what it implies might happen, or be the cause. Companies that use the map to demonstrate their standing in a much larger field relative to others, and how specifically certain parts of their program, certain people, certain sites, stand out due to special to exceptional outcomes. Companies that document their success and are willing to support such claims using point or centroid mapping are common examples of this. One of the core skills sets of most public health programs enables them to work and report at this level, and then use that to continue the monitoring of regional health and personal safety matters. The emergent care agencies use this to document their delayed response times, and demonstrate improvements or maintenance in performance as requested of required by their overseers. Healthcare companies and programs that employ this level of GIS utilization are those that report regularly on their findings in prevention care programs, and that use these maps to report descriptively, set some goals, and then perform statistics on whether or not these goals were reached, using primarily non spatial analytic technique. Some internal GIS utilization is possible. Collaborative data sharing or outsourcing may be involved (i.e. university sponsored, institutional grant supported research projects).
Step 4.
This is the first level of successful and constant or recurring analysis of health data, and then using these study results to produce a map, which then provides further insights into the project at hand. Most healthcare plans closely approach this line of reasoning with it comes to determining when and where GIS must be applied. The GIS often provides the insight that is needed by mapping the results, not just by visualizing them through what is interpreted from a table and/or coarse map figure printed out on paper. An example of this level of utilization is the design of a diabetes programs, where all patients are mapped at the various spatial levels, interpreted at times at the point level, and usually not reported using either of these methods due to concerns about possible HIPAA violations. These maps may be used internally for improvement programs, and are usually not shared with the public unless an appropriate institutional review board evaluation is made. The majority of work on a project with this form of mapping is prior to the development of a map, the remaining parts are involved with preparing and fine-tuning the data for mapping, producing the map, reporting the map to certain people, and infrequently displaying the map for others to see in an annual report form, or as part of the annual review process. Examples of this degree of GIS use within the business setting tend to focus on general data mapping, such a service areas and patient population density analyses (areal level work mostly).
Step 5.
Maps are more extensively used in this scenario for evaluating populations and population health, engaged in in retrospective analysis of many healthcare features/statistics pertaining to a region, and then using these insights to define the next steps to be taken in a program. With the previous diabetes study, for example, the researchers in this situation develop a dataset, then a means for mapping that data in many ways, and then evaluate it statistically using any of the numerous ways possible for engaging in statistical analysis. These people regularly rely upon notable statistical processes, such as reliance upon p values, adjusting the populations of results to best meet the standards for their review, and producing before and after results using a map, with numerous accompanying tables. In their advanced stages, these programs also make regular use of this methodology, are capable of applying it to other applied biostatistics modeling routines, develop programs demonstrating the success of this methodology, and produce a variety of projects, enough to produce a presentable or publishable detailed review of their work to others in the field. Most exploratory, progress oriented managed care programs are engaged in this, if their HIT and EMR plan includes methods for evaluating data spatially and non-spatially, or is at least warehoused in a format that can be effectively analyzed using spatial analysis routines. Companies at the upper end of this level differ from those at the lower end in terms of how productive they are with GIS development and actual repeated use, slightly beyond the testing phase. Early Step 5 companies are engaged in exploratory use of this process; later step 5 companies are engaged, though not highly productive (producing a few or few dozen examples of spatial surveillance programs with success per year.)
Step 6.
These workers have already accomplished Step 5 activities and are working to implement them regularly, in the form of ad hoc reporting or enabling outsiders to perform their own analyses of their own program performance. At the business level, cost related applications are developed as well, to serve in marketing the use of this program. Meaningful use and utilization couple with cost analyses and patient health outcomes are common reporting methods used in this system. The reports generated are regular, repetitive, annual or more frequent, and can be adopted to meet the needs of other core measurements or applications. Small area analyses are possible. The performance of specific clinics, providers, allied health programs, etc. can be compared and contrasted, for some early forms of corporate decision making processes to be developed. A company that regularly (even monthly) and frequently uses spatial analysis on and off to evaluate its services and their outcomes, monitors patient health, and tries using this data to implementing cost-saving procedures, is at this level of performance.
Step 7.
The development of a permanent EMR/HIT data warehouse, in which steady, ongoing analyses are performed at significant rates, on a regular basis, producing a fairly complete profile of the population and its subgroups, and then repeating the same at the provider, business and institutional levels. Agencies effective at this level of HIT processes can produced detailed analysis, and even develop reports to be applied to the program, assisting the company in meeting the majority of its institutional, financial, human resources related, population and patient health related needs. EMR/HIT related work may comprise up to three quarters of the work entailed, but the spatial representations of these data are important enough to be the primary reason EMR/HIT is at its level of accomplishment. Agencies with a meaningful EMR/HIT and not engaged in the utilization of these data spatially (relying upon equations and formulas, but without GIS), or engaged in regular GIS use of their data, or outsource the spatial analysis they need, have not reached this step in the development process, and reside only at the the upper end of Step 5 or 6, depending upon their degree of spatial understanding and use of their data. Institutions that are forward thinking, trying to perfect a valuable HIT/EMR system, but which lack the latitude-longitude data on such common data elements as zip code, census track, bock group, block, or even patient address identified lat-long features, have at most reached step 6 in this process. This remains the level at which the majority of institutions lie.
Step 8.
This is the preventive, proactive stage in Medical GIS. The spatial data is either readily available or can be made available upon short term notice. The HIPAA concerns that prevent agencies from engaging in spatial analysis are no longer the barrier to reaching this level of technological development. The right policies, guidelines, programs and internal training activities exist at the corporate level, enabling the corporation to develop a spatial analysis program, that can repeat and continue its spatial and non-spatial, and pre-analysis, analysis and post-analysis work. Such programs can engage in meaningful use measures routinely and repeatedly throughout a year, re-evaluate meaningful use year after year, and have the time to produce other unique analyses on a per need basis. This is the level at which a statistician can engage in predictive analysis, and development a variety of models for how to define these models. Past data can be run routinely by the statistician, and then used to advance the research problem of topic to its next stage. The higher rate of productivity that results provides time for new models to be introduced, and new styles and topics for regular reporting generating. All of the measures reported on for a lengthy, HIT/EMR program (1000-25000 metrics), can be developed into spatial presentations. Few programs exist at this level, and are probably located at Level 3 tertiary care facilities with medical schools and an adequate staff involvement with GIS related projects. An experimental settings where just a half dozen to even few dozen programs in GIS are implemented, without central IT oversight and central Director or HIT VP involvement in monitoring and developing these programs at the spatial level, does not constitute the developing HIT-GIS system required for this program to truly exist. Spatial applications programs need to be fully developed and in process for a company to consider itself at this level of success in medical GIS.
Step 9.
Both GIS and non-GIS spatial routines are used to developing graphical illustrations of the results. Patients and neighborhoods may be mapped and understood at the spatial level. Unique subpopulations can be easily researched. Understanding the need for GIS, these institutions will have a policy in place about HIPAA and its relation with GIS and Spatial analysis routines. This company will be engaged in all non-spatial, non-GIS-spatial and GIS-spatial levels of performance. It will have an understanding of the use of grid mapping techniques for example, how their formulas apply to spatial population health analyses, and are engaged in experimental or actual utilization of these processes in the work environment. These corporations are also engaged in standard institutional repeated analyses, standard and repeated or regular GIS related areal analyses, interactive and non-interactive small area areal analysis of patients (for example in studying disease patterns and spread, or retrospectively mapping out environmental disease patterns) and be involved with highly sensitive disease mapping projects utilizing personal geographic information (patient point mapping) to engage in important analyses. Many of these tasks and skill sets just described, will be applied mostly as experimental processes, but be useful for socioeconomic related prevalence modeling, service related cost analysis, fraud and overbilling mapping, misuse or abuse of services modeling, missed patient opportunities mapping, long term retrospective historical modeling for future prediction purposes, standard predictive modeling processes in and out of SAS- or R-like tools and GIS, and disease or outbreak prevention work. Examples of these institutions in the managed care setting, if they exist, are primarily working at the research and development level, and tend to have little support and draw limited attention to their progress.
Step 10.
Engaging in all of the above, just noted in Step 9, but at the institutional, reporting level. Products of this system include grid, point-arc and raster imagery outcomes. Reportability includes projects that results in hundreds of outcomes, pages, graphs, etc. per report, for dozens to hundreds of reports per year. A standard report, defined by policy, IRB reviewed and detailed for HIPAA compliance, is the result, for examples: a) 300 analyses of the top birth defects, their past events and their monitoring, b) top cultural disease patterns relative to demographics distribution, for 5 cultures or races, c) the top 300 to 500 groups of ICDs compared between large regions or facilities, by provider and/or zip code tract, d) the 100-200 most important social issues documented in V-code or E-code format, e) the 100 or 200 highest risk patients that are still living for each of the major facility groups, each of the major disease classes, in descending order of risk as defined by one or more popular risk assessment algorithms, f) areas with the lowest income groups where the lowest populations are effectively served, when compared with the general census data for the service area, g) the mapping of risk areas based upon environmental features, in or out of the house, such as lead and household poisoning risk, or h) COPD/Asthma risk areas defined by urbanization features. In addition, GIS tools are used to produce effective public education tools and presentations, such as satellite map or even Google utilization, in which GIS skills are employed to generate the outcomes.
The Survey
Years ago I developed a survey to assess programs for their level of engagement in the progress of implementing GIS as part of some long term EMR/EHR transition goal.
The responses have been very low with this survey–which tells me something.
These potential reasons are as follows:
- either the medical field is burdened by the changes in HIT now happening, and doesn’t wish to spend the time demonstrating meaningful use of that information
- or, a related financial and human resources related cost burden
- or members of the healthcare profession see no value or use to the implementation of this new technology,
- or that actual HIT workers themselves are already decided on this matter, unready to engage, until the “time is right”,
- or management and others are against the implementation of a new technology for reasons related to misunderstanding, such as the lack of knowledge and experience of its value and effect upon finances and cost to the system,
- or due to HIPAA concerns.
For more on this survey, not the survey itself, see https://brianaltonenmph.com/biostatistics/gis-in-the-workplace-survey/
To access this survey, itself, go to Survey Monkey at . . .
.
Survey Link
.
Once the survey is completed, you can close the window.
.
