October 2015
Monthly Archive
October 29, 2015
Posted by Brian Altonen, MPH, MS under Uncategorized
Comments Off on MC’s Goal for 2016: “Solving the Financial Crisis of healthcare”
Solving the crisis?! Well, not really. 2016 is the year when managed care programs will either suffer and succumb to the pressures of HIT, or successfully find new talents and leaders to advance their system ahead of the rest and implement a Medical GIS.
2016 is also the year when a significant percentage of healthcare programs will fall behind in the most basic IT and HIT requirements even further. Some may even fall so far behind their competitors, that it becomes necessary to sell, or initiate a major overhaul.
The first thing to go with a successful overhaul are the “leaders” of the past. They are the ones who are dragging your managed care system behind, not only in its technology, but also it economic potentials, in the form of rewards and benefits for . . . . need I say? . . . . “good service.”.
Sourced through Scoop.it from: brianaltonenphd.wordpress.com
This philosophy defines the neoinstitutional theory of health care administration, the primary theory by which my dissertation work on managed care and the current barriers that exist for GIS implementation. The lack of success and rapid growth, when compared with the advancements epidemiologists, marketing companies, surveillance specialists, and climatic health experts have made using GIS, is due to the absence of upper level management having any direct, first hand knowledge or field and hands on experience with GIS and the use of GIS skills to create your own maps . . . from scratch. . . . by hand . . . not just by using the routine shapefiles that most GIS’s are provided.
Some very old habits have resurfaced again, due to the last two year’s worth of failed healthcare information technology improvements. The primary proofs of these failures are demonstrated best by programs still unable to produce an entire and effective HIT information management system. realize, the bulk of these programs have only a few dozen metrics that are required of them, about 60 meaningful use metrics.
I have identified thirty-four major SETS of metrics that need to be developed, and then managed regularly on a monthly, quarterly or annual basis, for any managed care system to demonstrate its expertise in understanding population health and the roles of medical GIS in producing more cost effective HIT-GIS guided Managed Care programs.
These 34 classes I came up with define about 1500 to 2000 metrics. Most of them were developed as part of a major MC program I was involved with back when the first contemporary forms of these systems came to be (more than 10 years ago). So these 34 classes on population health/meaningful use reporting shouldn’t be too difficult to develop in three years or less.
Now I admit, this is just my preliminary set, and is based upon projects in which I was able to develop these reports in very little time over the past 10-15 years. I suspect a few more details will need to be added as I recheck my sql and sas algorithms and rewrite them to more rapidly produce the end products that are required. This project is based upon real life, real time data. There is a real need for managed care systems to develop a programs that are more robust, not scripted as just a bunch of various “silo” projects, by unmanaged, non-integrated research teams and offices. Working together as part of an HIT-GIS program, these programs can have a very significant impact.
On the page this ‘blurb’ is linked to, I define the following sets of skills and applications of GIS as the directions these programs need to be heading. All but two of these items should be able to be accomplished in under one calendar year, with or without a GIS.
Location/Access improvements; redesigning plans and servicesCost savings by redesigning facilities, determining needsServices — quality and adding new services, documenting thisFuture planning (projection of health and patients and costs; plans/goals)Standardized reporting of valuable QA information; meet MU requirementsPerformance Improvement QI scores, documenting and reporting on 60+ specific metricsPerform Ad hoc reporting, per local needAchieve more recognition and support:Improve professional reputationIncrease Public Support and recognitionPress related support and recognitionObtain other institutional support and recognition (tertiary care settings, university hospitals, npos, clinics, allied health)Improve financier support and recognition; improve investments; improve IT infrastructure.Obtain more allied corporations support (manufacturers, inventors, innovators)Receive more Federal and State support and recognition, and publish more in the literature.
See on Scoop.it – Medical GIS Guide
October 24, 2015
Posted by Brian Altonen, MPH, MS under Uncategorized
Comments Off on A new wave of diseases threatens Southern Europe and the Middle East – The Washington Post
With new infection hot zones developing in Europe, world leaders need to get ahead of potential epidemics. My map videos for each of three geographically different Leishmaniasis patterns in the US, are [American] https://www.youtube.com/watch?v=hpxw97tM75k ;
[Ethopian Leishmaniasis] http://youtu.be/jhw8nfEfNOw ; [Asian] http://youtu.be/mkHYn-r-5WQ .
Sourced through Scoop.it from: www.washingtonpost.com
Taking a close look at the history of diseases, they appear to recur in different countries as if a "new wave" of outbreaks was developing. This new event leaders are trying to link to global warming and climate change, which could be very well correct, at least partially.
Global warming isn’t the same reasons outbreaks of various international diseases occurred in the past. The past events may have even planted some of the pathogens into our local ecology, long before the first outbreaks even happened.
Other factors that come into play with new foreign disease outbreaks in this country pertain to the migration diseases underwent centuries ago. The common factor for most outbreaks brought from afar is travel, and the amount of people travelling. During the mid-14th century, Taenia (African tapeworm) made its way to Europe by way of merchant and explorer ships.
During the mid-19th century, there is plenty of evidence suggesting the classical Vibrio cholerae was planted ecologically within the Mississippi River deltaic setting. On and off it produced a few outbreaks in Mexico and the U.S., which were never considered an indicator suggesting the pathogen was part of the local ecology.
In the past five decades, travel has been the means by which disease causing organisms provided the opportunity to commute to a new ecosystem. But, whereas fifty years ago in the 1960s, a plane from New York to the Caribbean was a unique transportation event, today, it is nearly a commuter’s route to some, a recurring ‘frequent flier’ event for others.
As of this decade, travelers can easily take just a few hours to spread a disease anywhere they want around the world, from western Australia to Chicago in less than one business day. The migration of a number of foreign borne diseases into the U.S. in 2014 and 2015 proved this inevitability was finally upon us.
Recently, several foreign born pathologies or diagnoses were brought to my attention, due to their "discovery’ in the lower New England-Mid-Atlantic setting. I remind people to check one or more of my postings, if you want to see the past behaviors of diseases on United States turf, over the past ten years. Most of these maps are now being reconfirmed, using different data from different sources. However, if things do get worse, they represent just this moment in US epidemiologic history.
For a number of examples of map videos I produced on what I termed "Foreign Intruder diseases", go to:
https://www.washingtonpost.com/opinions/preventing-the-next-disease-outbreaks/2015/10/23/c4564ec0-7817-11e5-a958-d889faf561dc_story.html?ref=yfp
My blog page with a listing of these (no video links), is at
https://brianaltonenmph.com/gis/global-health-mapping/foreign-disease-intrusion/
For those who don’t want to search . . . see . . .
Ethopian Leishmaniasis – http://youtu.be/jhw8nfEfNOw
Asian Leishmaniasis – http://youtu.be/mkHYn-r-5WQ
See on Scoop.it – Medical GIS Guide
October 18, 2015
Posted by Brian Altonen, MPH, MS under Uncategorized
Comments Off on First Echinacea, now Anti-oxidants

From 1987 to 2000 I ran a lab at the local university that specialized in testing phytochemicals. My focus was on my own “discovery” of the local yew tree as a source for a new treatment for breast cancer, which would be marketed several years later as Taxol. That study was second to my study of benzylisoquinoline (BIQ) alkaloids, metabolically active selective toxins capable of being applied as medicines. I also monitored OTC herbal products for adulteration and counterfeits, and occasionally followed up on complaints of toxicity.
Sourced through Scoop.it from: www.newsweek.com
This current argument, pertaining to antioxidants, mimics similar events that ensued in the late 1980s for Echinacea, when it was promoted for treating AIDs. Many herbal medicines are potential victims of this slippery slope error, usually made by their most devoted (and highly biased) advocates.
During my 20 years working as a phytochemist and phytotaxonomist specialized in the pathways for developing new products, I attended hundreds of presentations, classroom teachings, and other public events about the new claims to herbal medicines arising over the years.
Echinacea was the first attack I would make on these claims, as the researcher, lecturer and professor in natural products chemistry from 1989 to 2000. The primary individual promoting Echinacea at this time recommended it for treating AIDs. Attending one of his sessions, I asked about its mechanisms of action; he was unfamiliar with the contradictory nature of his claim, which stated that an herb stimulating the immune system would help “cure” or minimize AIDs related complications because of its non-specific “immunogenic” effect. (Lucky guess on which pathways to take, I guess.)
For the next decade we contested each other’s claims about what is “efficaciousness”, when it came to herbal medications and their nutriceuticals. Ultimately, some people in this profession developed a better understanding of the immune system processes, and the varying pharmaceutical nature of the ‘Chemicals in Plants’ (the name of my most popular course at PSU for 15 years).
Also note, these same incompletely researched arguments have been made for plant seed oils, in particular arguments that posed ideas about prostaglandins and prostacyclins, not to mention the other arachidonates and EPAs. Such arguments claimed that generically assisting the body in its chemical processes somehow results in a therapeutic effect because nature selects the right side of the pathway to health for its plant chemicals to take. (Or maybe it’s simple “luck of the draw”!)
Similarly, herbalists rarely take into account the opposing natures by which black cohosh and blue cohosh on uterine muscle and blood vessel walls; the effects of the two, when taken together, are in opposition to each other in some cases.
Over the years, I demonstrated that one of the most embarassing things about phytochemical drug related claims is what little herbalists know about the chemical nature and chemical history of some of their most popular products.
Since I specialized in BIQ alkaloids back then, I reviewed the “curative” BIQs purportedly in Goldenseal (Hydrastis canadensis) from 1990 to 1993; I presented these findings several times, including at OAS. I found that hydrastine (green to gold on the TLC) rapidly decays to produce hydrastinine (sky blue). Different products had different amounts of hydrastinine produced, indicating substantial irregularities within the herbal medicine trade.
That second product (light blue hydrastinine) is a result of the oxidation of hydrastine to hydrastinine, by light, heat, exposure to oxygen, free radicalization, etc. This chemical conversion also changes the questionably-proven antibiotic Goldenseal powder into a better-documented smooth muscle relaxant (see ‘The Merck Index’, 1970s). Since the half life of hydrastine (the desired antibiotic chemical) is a just few months in powdered products, this means the capsules, teas, and such that are made from golden seal powder may be totally “ineffective” in therapy in overpriced in terms of their hydrastine content. [Take them for your IBS instead; I explain all of this on part of my resume/autobiographical page, at https://brianaltonenmph.com/tag/selective-toxicity/ ].
During the 1990s, some of the OTC industries made corrections for these inconsistencies and even tried standardizing the testing of their alkaloids, flavonoids, and other forms of phytochemical content.
But similar problems ensued. Concerns about the substitution of Devil’s Claw with a closely related “unofficial” species (but perhaps allowable) is currently a major concern. Since the 1920s, there has been this ongoing problem for identifying the right “Pau d’Arco”. Adulteration is also still a problem with herbal medicines, for example, the many “legal highs” may be totally bogus, questionably effective neurotonics. Likewise, the use of “scullcap” for epilepsy has had its non Scutellaria substitutes found in the batches instead. One Uva Ursi (Arctostaphylos uva-ursi) produce sent to me by an Alaskan herbalist ended up being boxwood (Buxus) shrub instead, alkaloids and all. (Grossly, it is a lookalike at first, and so was perhaps gathered by mistake.)
And as usual, poor management of OTC the plant product manufacturing industry remains a major problem with this unmonitored profession. Last week, the story was once again countering the Echinacea immunogenic theory claims.
Finally, I find this problem to be very much like another series of legal cases I managed from 1989 to 1990, involving the Oregon patients who took the first bioengineered version of the OTC nutrichemical, tryptophan (TRP). It was produced by the Japanese company Showa Denko, using aggregate cell culturing (“bacillus soup”) techniques (one of my first professors was Abe Krikorian, who sent the Daucus carota to the Moon and back during one of those Apollo missions, in aggregate rootcap bioengineered form; the cell aggregates survived and produced new plants on earth).
This attempt to make a bioengineered form of TRP for the first time unknowingly resulted in the production of di-TRP, which was undetected, since it never existed before, and found to be neuromyotoxic on skeletal (esp. leg) muscle. [See http://www.nemsn.org/Articles/summary_tryptophan%20Fagan.htm ]
The misfortune there is that this enabled the FDA to regulate TRP rather than require it be tested and monitored for public health safety. That move was obviously one of a political nature, not intended to be solely of a public health nature.
Remember, as a medicine, the herb is what you make of it. As a source for chemicals, however, there’s more to a plant than just a list of compounds, some of which have possible effects.
If only we paid more attention to the highly detailed alchemical history of what’s in a plant.
So many compounds, so many theories. (“So that’s why it worked!”)
PS: Don’t forget the ZMAPP project! This Ebola drug was bioengineered using Tobacco Plant, and the rights to its product and the genetic engineering processes are patented. So this process and its unexpected problems it may cause at times may very well continue. See my related ScoopIt! at http://www.scoop.it/t/episurveillance/p/4026182931/2014/08/12/zmapp-and-the-treatment-of-the-spanish-priest-in-the-madrid-hospital-for-ebola
See on Scoop.it – Episurveillance
October 17, 2015
Posted by Brian Altonen, MPH, MS under Uncategorized
Comments Off on Back to the Drawing Board
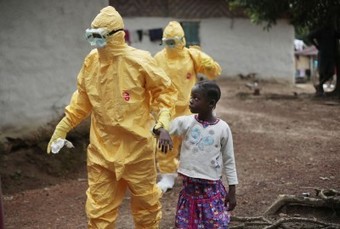
Nearly 10 years ago (time flies!), I performed extensive research on the in-migration of diseases from Africa and other continents and large countries, completing that project more than five years ago.
I identified more than 100 diseases that can be easily monitored, continuously, by a managed care program. I used this project to demonstrate that if the ICDs of these diseases are placed into a single search tool for EMS, and the resulting “hits” assigned locations based upon their latitude and longitude, that plenty of leads can be found about how diseases migrate into this country, not to mention how people behave. Ebola is one of those diseases I mapped.
Sourced through Scoop.it from: www.newsweek.com
Now, with the possibility of sexual transmission of Ebola, living and working in the vicinity of one of the non-compliant healthcare providers to bring Ebola into this country, these events made me recall my years in medical school, during the early to mid 1980s, when AIDs had yet to receive a formal name, and when the first research into HIV and AIDs migration and sexual transmission patterns came to be, as one of my mentors was forced to leave his position as administrator of the medical school, due to his refusal to publicly refer to the university officials’ desire to link the new epidemic coming to be to a small community located in and about Queens.
Now granted, the organisms behind AIDs and Ebola are very different. What happened in New York and later California may not be at all like what happened 30 years ago in the U.S. In an evolutionary sense, as well as a physiological and adaptive one, the organisms responsible for each are very different, although the routes of transmission, sexual behavior, may not be as different as we’d like to think.
What HIV taught us is that carrying and disease and spreading it elsewhere around the world can become a long, drawn out event, enabling the organism to mutate, survive better, change from a rapidly fatal pathogen to a wandering one in search for new hosts.
It will be interesting to see if people behave like they did between 1985 and 1986, and 1986 and 1988, when leaders in my medical communities in NY and later OR tried to lay blame on specific ethnic groups for the introduction of a new disease to specific communities in Long Island where I did my rounds on the hospital floor, and still later in specific parts of California, the second time through.
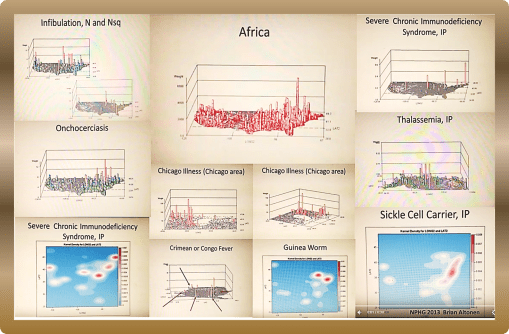
To understand how African diseases impact this country, back then, in African, and in the U.S., begin by reviewing my work of the Geography of African Diseases that I produced years ago from a large national health dataset . . .
My method of developing the first videos to display the national distribution of these diseases, individually as well as as a collective, appears much like a GIS, but it was produced without GIS software. I designed my own algorithm for this 3D mapping methodology eons ago.
Begin with:
http://www.scoop.it/t/an-episurveillance-researchers-guide/p/4027597103/2014/09/07/african-in-migrating-disease-patterns-around-the-great-lakes-region
VIDEOS of the NPHG Product include:
African Diseases
https://www.youtube.com/watch?v=qi-fXinlTjE
Geophagia as an African behavior:
https://www.linkedin.com/grp/post/2601248-5936505909034364929
African Eye Worm
https://www.youtube.com/watch?v=dSP6tOQs-RQ
Obscure African Cardiomyopathy:
https://www.youtube.com/watch?v=hSj78VNYMbY
Bejel:
https://www.youtube.com/watch?v=RI9Z0HXZFUg
Guinea Worm
https://www.youtube.com/watch?v=YwSnpT7hAI8
Crimean or Congo Fever
https://www.youtube.com/watch?v=YWuMBOdB08k
Elephantiasis
https://www.youtube.com/watch?v=Uc6zvqutU3g&list=PLWrApErk5bybFfsOWTXWjlwvIM7D4d6-h&index=22
Assorted Videos in a row:
https://www.youtube.com/watch?v=x4VR1rf6C78&list=PLWrApErk5bybFfsOWTXWjlwvIM7D4d6-h&index=20
Ebola
https://www.youtube.com/watch?v=RfvUQfYLlvM
AIDS/Severe Chronic Immune Deficiency
https://www.youtube.com/watch?v=IIQh7bLpgZs
Noma Page
https://brianaltonenmph.com/gis/population-health-surveillance/production-examples/528-1-noma/
POSTINGS in ScoopIt! about Ebola, each a lesson in itself:
Pages on the Geography of Ebola:
http://www.scoop.it/t/an-episurveillance-researchers-guide/p/4024239730/2014/07/07/the-geography-of-ebola-important-spatial-features-influencing-its-diffusion-patterns
https://brianaltonenmph.com/2014/07/08/the-geography-of-ebola-important-spatial-features-influencing-its-diffusion-patterns/
and Mapping the Outbreak of Ebola:
http://www.scoop.it/t/episurveillance/p/4039425741/2015/03/18/ebola-mapping-the-outbreak
http://www.scoop.it/t/global-health-care/p/4034141340/2014/12/24/ebola-mapping-the-outbreak
See on Scoop.it – Medical GIS Guide
October 11, 2015
Posted by Brian Altonen, MPH, MS under Uncategorized
Comments Off on Why HIT is not progressing as rapidly as it should to HIT-GIS or Medical GIS
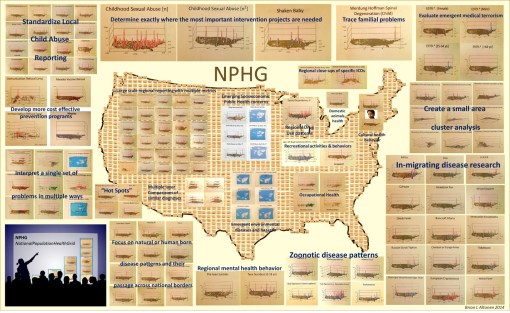
These are examples of a number of programs/HIT-GIS projects I developed and implemented as part of my National Population Health Grid (NPHG) program. The purpose of NPHG was to demonstrate potential uses for GIS in population health analysis, as a part of the managed care system, in a way that focused on the combined annual, quarterly and ad hoc reporting needs typical of the Meaningful Use, QIA and PIP programs that many health care systems engage in. The Managed Care HIT-GIS (or Medical GIS as some are now calling this process) focuses on the EMR/EHR differently than population health, epidemiology and environmental health programs.
There are five tasks to keep in mind when trying to implement a GIS for use by a managed care program.
The first task is it must be able to report meaningful use outcomes and any outcomes for special studies engaged in for quality improvement or performance improvement using local, regional maps. Preferably, two maps must be reproducible. The first is the standard zip code choropleth like map depicting distributions of people, patients and specific health related issues. The second is a map developed for internal use that depicts the same, only at the small area, intervention level, for use in targeting your services, defined needs, gaps in services with more precision.
The second task, is the system has to establish a monitoring and surveillance process, meaning that the GIS can be used weekly, monthly or ad hoc when specific questions are asked. This is mostly a descriptive use of GIS, meant to serve curious healthcare providers trying to compare their program or services and outcomes to those of their competitors, of for directors and officers to use to evaluate quality and cost related features for given people, programs and regions. The ideal surveillance program in a managed care setting would of course be live, an outcome that is possible with the right software and data management packages, the right skillset, and the right services from the software providers (I have seen just one or two managed care settings where all three of these are happening.)
The third task is to be able to predict in what direction specific forms of services are heading, such as a growing need for cancer screenings of the 50+ age group, or changes in immunization demands by specific neighborhood clinics and cultural settings. The use of multivariate analyses in combination with GIS spatial modeling algorithm, in both linear and non-linear, polynomials are the preferred ways to go when developing these algorithms. The most accurate long term models I have found, and shown, are initially polynomial in nature with a total of 6 or more independent (unlimited) and dependent (2 or 3 max) variables, merged with an exponential equation used to define a similar outcome, but initiated just before the decay portion of the polynomial modeling ensues, thereby allowing for longer periods of prediction (I made previous postings about this regarding my more accurate way of predicting the 2014-2015 Ebola outbreak).
The fourth task is to provider upper level managers on up to CEOs, VPs and Presidents the visualization needed to bring the points of your research home, as a medical GIS spatial statistician. This means that the upper level “leaders” must be savvy in their population, its data, the ways this data can be presented, and able to interpret any representation they are handed pulled from SAS, Cognos, Qlik, or GIS.
The fifth task is to document your finances, management, human resource and service industries, in a way that can be analyzed and monitored over a 10+ year period. As a part of this upkeep, HR (and the managers they report to, make suggestions to) should become more responsible with mining for and utilizing their most valuable human resources.
To date, software, management knowledge base, management skills, and indirectly HR skills or lack of action have been responsible for the failure of HIT to advance enough to allow for rapid advancements in HIT-GIS to ensue.
It is now fifteen years into the popularization of the “Managed Care” philosophy for health care. The current QI programs, Beacons, MCs and such that oversee changes in the healthcare system have remained slowly-progressive. This in part is due to employee turnover, repeated software changes, data warehouse challenges, outsourcing based losses in important employee skills. But it is management that produced the greatest barriers against HIM/HIT development involving a very productive HIT-GIS system.
Due to poor management, the most skillful employees when it comes to GIS are rarely used fully or effectively. This results in reduced employee retention, further reducing the institution’s momentum in this field. The lack of managers with adequate GIS training further complicates this problem. Experience and success are a necessity, if a manager is to have a worthwhile goal in mind, that is also advanced. This barrier in turn results in a further loss in momentum and ultimately the opportunities for discovery and creation at the corporate level are lost.
My preliminary review of the roles of GIS and GIS-trained people in a managed care system demonstrate that most large companies have one or a few individuals highly skilled and knowledgeable in GIS, Medical GIS, HIT-GIS, and spatial analysis, with few used to their fullest potential (if they are working with GIS at all.). Management’s the lack of knowledge of the potential value of GIS and these employees is the primary reason HIT is not advancing as quickly as we hope, and will certainly not lead to any major innovations in the near future for any current HIT-GIS program’s status. (They must be able to produce hundreds of maps per day program).
The talent, resources, skillsets and knowledge base are there; it is up to management to catch up with this technology.
See on Scoop.it – Medical GIS Guide
October 4, 2015
Posted by Brian Altonen, MPH, MS under Uncategorized
Comments Off on Suicide | Brian Altonen, MPH, MS

A Work in Progress SUICIDE Recent news (Joel Morales and the pre-teen suicide issue in New York, 5-31-12): http://www.nydailynews.com/new-york/12-year-old-east-harlem-boy-driven-suicide-sick-bullies-taunted-dead-father-article-1.1087190 The spatial distribution of suicides is not equal across all age groups. Some parts of the country are more likely to have the very young (<12 yo) or very old (75+ yo) people documented as having been…
Sourced through Scoop.it from: brianaltonenmph.com
Attempted suicide is one of those regional behavioral health patterns that is underevaluated on a regular basis.
Suicide behavior has a cultural link to it that can vary from region to region, county to county, town to town, neighborhood to neighborhood.
When a story about a suicide is released to the press, there are often other behavioral patterns that we expect to occur over the next few days, weeks and occasionally months. "Copycats" are both a local and national phenomenon, with social and cultural behaviors often defining the types of duplicate cases can prevail.
For example, it is unusual to see extensive duplication of a teen age event, unless there is a shared cause. The places where these events happen, is where teen age suicide is greatest in the country, which the rotating 3D maps on this page demonstrate. We do see more deliberate copycat cases with individuals who are sending a message, and have a reason, meaning they are young to mid-age often, and with some complaint or attitude in need of expression.
Isolated and coupled suicides cases impact older people. Culture differences are often the reason group or family-related suicides happen in this culture. The greater the cultural detachment from the local communities, the more likely some groups will express this attitude about their value of self and living more aggressively and deliberately.
Not yet published are the results I obtained years ago about age, gender, family size status and type of suicide the prime candidate tried to perform. There is a gender related reason to how suicide attempts are made. i.e.
Women are most likely to use gas-powered ovens, men are most likely to use hand guns.
Ceremonial weapons are also used by a unique class of people.
Alcohol based versus drug (OTC or illegal) are also linked sometimes to very difference sets of people.
Suicide in the outdoors, such as performed on top of a mountain and along a hiking trail, is more a practice noted for younger women than men.
Lovers’ Leaps (there are two main ones in this country) demonstrate a large peak next to, but not exactly at Niagara’ Falls; its used mostly by just one particular age range and gender.
Suicide by car, by garage, when canoeing or boating, by bike.
Teenage and young adult kids demonstrate peaks in certain urban settings, where runaways are common and well managed (or mismanaged, via teenage prostitution).
All of these processes can be evaluated using the detailed coding put in place for suicides when ICD9 was established.
(When I get a chance and have the time, Ill go back to this data and summarize these ‘method of attempt’ findings.)
What is unique, is companies often have a large enough dataset to evaluate suicides at such a level of detail: age, gender, form of attempt, and in some cases successfulness. The current EMR/EHR makes this type of evaluation possible for your local community.
The video maps at this site provide some insights into what forms of suicide your local population may be trying to engage in. Begin by looking for age range related peaks.
.
See on Scoop.it – Medical GIS Guide
October 4, 2015
Posted by Brian Altonen, MPH, MS under Uncategorized
Comments Off on Anti-Vaxxers Accidentally Fund a Study Showing No Link Between Autism and Vaccines
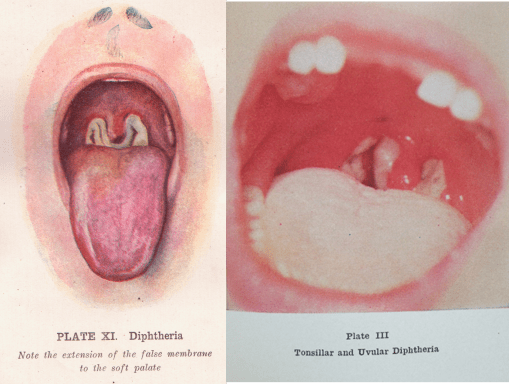
The pictures depict a child’s throat with the false membrane produced by diphtheria. The frequency of diphtheria outbreaks in the late 1800s is what led to the frequent use of the emergency trachotomy procedure to open up the respiratory passage.
Sourced through Scoop.it from: www.newsweek.com
First used successfully around 1832 by French physician Pierre Brettoneau, the tracheotomy became popular during the 1850s when it was commonly applied to patients with diphtheria and very severe croup. The tracheotomy again became common during the early 1900s, when large numbers of polio outbreaks occurred in the U.S..
In a review of US cases of diphtheria I performed several years ago, I uncovered one episode of a large number of diphtheria cases recurring in the midwest, totalling over 100 cases (and/or suspected cases coded as such) between some time before 2008.
The Mumps and Whooping Cough (Pertussis) are still recurring each year in this country. Last year and earlier this year, Measles made the headlines. Most recently, a cluster of infectious disease cases made the news close to where the previously noted diphtheria outbreaks occurred.
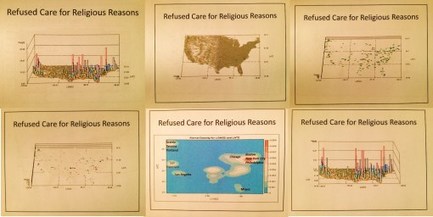
Of course, this recurring theme of immunizable disease outbreaks points to the consequences of parents refusing to vaccinate their children. The clusters in Utah may be related to a large religious community in that region, which has been into naturopathic medicine since the early 1900s.
Incidentally, naturopathy is the only accredited “doctor of medicine” program in this country that has a large number of graduates against immunization programs. This resistance is due largely to the long history of anti-immunization beliefs professed by professors of these schools in the U.S., and their graduated physicians (NDs not MDs), licensed and able to practice naturopathy legally in 8 states (maybe one or two more since I last researched this.) [This profession is most often linked to the unaccredited naturopathy home-schooled practitioners, who don’t undergo the same level of graduate level medical education as MDs or NDs).
This midwest diphtheria outbreak is referred to specifically on my video of immunized diseases, viewable on Youtube,
https://www.youtube.com/playlist?list=PLWrApErk5byaJjbbjS6TEAAChZ7apmbzg ,
or on my page entitled “The Childhood Immunization Problem” (https://brianaltonenmph.com/gis/population-health-surveillance/production-examples/the-childhood-immunization-problem/ — links to the videos are at the very end; the second video is of immunization refusal clusters).
I also review these diseases and how the patients appeared in a fairly lengthy presentation . . . .
as a slideshow at:
http://www.slideshare.net/brianlaltonen/immunized-diseases
and as an autoplay this slideshow entitled “Immunizable Diseases – A Reminder of the Past” (27 min.) at:
https://www.youtube.com/watch?v=LOp-KGd4hV0
See on Scoop.it – Episurveillance
October 4, 2015
Posted by Brian Altonen, MPH, MS under Uncategorized
Comments Off on Grid mapping health and disease in the United States | Brian Altonen, MPH, MS
This page provides the math behind my grid mapping of the United States, without using a GIS. This technique is called grid mapping and was popular when ArcInfo and the first versions of ArcView were the most common spatial analysis lab tools.
Sourced through Scoop.it from: brianaltonenmph.com
I use these maps to produce my 3D models of the US and its various public health patterns. The advantage to this method is in a decent system, it takes less than 10 minutes to map a large dataset, like that for the entire US, by zip code, block group, and/or gridcell plan (2500 analyses of 10s of millions of patient data rows, each depicting a standard one-row summary EMR).
Because this tool works very fast, I learned immediately to go through the extra effort needed to produce the 1,000 to 1,500 maps, with varying angles, pitch, and rates of revolution, needed to produce a video. A twenty second video requires about 1,200-1,500 images. A few of these videos are 5 or 6 minutes long. Most were derived from 2,000 to 3,000 images. Standard production rates in teradata are 15,000 to 20,000 images per day, developed into numerous videos. I mapped all of the ICDs, including those depicting specific age groups (suicide, homelessness and other V and Ecodes), in under two months.
My remaining research question: Can this same high rate of productivity (15k maps/day, for video production) be re-created in SAS-GIS, Cognos BI, ArcGIS, Qlik, Tableau or the host of other spatial tools out there? (see http://www.capterra.com/gis-software/ 😉
My dissertation work focuses on the barriers to implementing GIS in the managed care workplace as a highly productive reporting tool, i.e. reporting all ICDs, including age-culture-gender subgroups, with summary maps depicting the five primary ethnic disease pattern groups, on a daily basis.
See on Scoop.it – Medical GIS Guide
October 3, 2015
Posted by Brian Altonen, MPH, MS under Uncategorized
Comments Off on When even “only a few patients” is still too much !
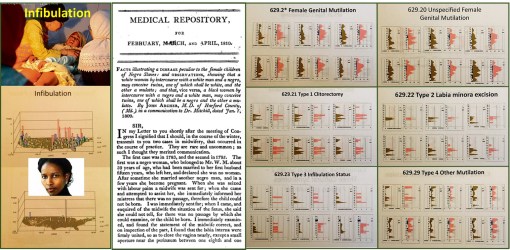
In a recent re-review of infibulation in the U.S., in particular a section of it that is predominantly black, with hundreds of thousands or people of the right descent, I uncovered ICD evidence for 4000 patients from a population of just about 160,000. I then evaluated the age profile of these patients, and duplicated my findings from 7 and 10 years ago. The most important repeated finding was that about 0.5% of these 4,000 were under 18 years of age, with the lowest frequency of events noted for the 12 year olds. How do we interpret these findings?
My interpretation of these findings is that the four peak ages for infibulation (ca. 1 year old, 3-4, 7, and 13-14–this graph not displayed) suggests the following:
1. that there are at least two kinds of infibulation being performed on children (four are differentiated with the version 9 ICDs); the younger ones do get the less traumatic form perhaps, because of its potential fatalities.
2. Children who undergo this process are the fewest at 12 years of age (in fact pretty much nil), because they are sen to their family’s homeland for the process to be performed–it is illegal to perform in the U.S.
3. The 1, 3-4, 7 and maybe even some of the 13 year old children who are noted as having endured this process, and are now U.S. citizens, may have in fact received that procedure in the U.S. The younger the victim identified in this study, the more likely this practice was performed in the United States, and again–illegally.
There are cultural explanations for the 1, 3-4 and 7 years old procedures. The 3-4 year olds stand out however, because they are the years just before pre-schooling and public schooling.
The number of patients who may have had this process performed in the U.S. is about 160 out of the 200, who are under 18 years of age and have this diagnosis in their EMRs. Even if half of those very young cases were performed outside the U.S., this means that 80 were still illegally performed in the U.S.
So, there’s no getting around this point: there are individuals in the U.S. who may be performing/practicing infibulation on very young girls, because the parents (and perhaps mostly the father) believe this cultural belief is essential, because she (the daughter) cannot be trusted, and must be taught how to remain a virgin until her “culturally appropriate” marriage.
One of the most incredible rates of change for this practice in the 4,000 women identified and researched for this study, the escalation in numbers (percents) of cases between 15 and 25 years of age is phenomenal. If your people, family, believe it must be practiced, then there is no way around this sociocultural requirement for growing up.
This study duplicates my past reviews of this most controversial issue, which I predict will increase several fold over the next several years. The events that will increase the most are the illegal performance of this practice is certain communities, rather than send the 11 or 12 years old girl back to the homelands. (See a recent news story on this issue, related to Pakistan: Send Girls Off to Learn, Not Off to Marry, Says 13-Year-Old Pakistani Activist–http://news.yahoo.com/send-girls-off-learn-not-off-marry-says-211504295.html ) The field of medicine, and even the government offices that oversee health matters, haven’t the knowledge base, know-how or ability to manage these back room illegal practices that go on in culturally defined medical practices.
Medicine is often treated like religion by certain government services. Some forms of health care practice are based on belief and cultural acceptance. We do not intervene in these practices; the leaders turn their heads away from watching them happen. “Politically correct” is a must for some religions, some medical philosophies. In the case of infibulation, the patient’s rights are being ignored each and every time we let that happen, making it possible for physicians from other traditions to engage in a practice that is typically taboo and considered cruel to patients when engaged in the U.S., and most developed country settings.
WHO does not support infibulation. Neither should we.
My stats tell me that from one to five of these events occur every month in the region I am studying.
For more on this process, my past videos and maps of its happening across the U.S., based on an evaluation of 50-60M people, go to:
3 videos of the map of the U.S., depicting these cases (my 3D rotating map images of the US):
www.youtube.com/watch?v=0A95jfeAScw
www.youtube.com/watch?v=mNGxDzOkl_Q
My review of the first documentation of this practice by a U.S. doctor, in a U.S. medical journals:
“A Disease Peculiar to the Children of Negro Slaves.”
My ‘Socioculturalism and Health’ page, which incldues coverage of this sensitive topic, at:
Another individual’s page on the cultural geography of this practice:
Articles on this controversial topic:
Cosmopolitan
A page with links to the Youtube videos on this controversial topic:
https://www.youtube.com/playlist?list=PLCu236rTh0duC4Euag8Fpz7JW19c2LPCr
See on Scoop.it – Medical GIS Guide
