This blog site has close to 1000 active pages, with about one quarter of these pages focused on historical disease mapping.
The maps that were reviewed are listed here with links to pages, as well as just the map.
The maps reviewed and/or discussed are listed chronologically.
Not all maps at this complete site are included, just those pertaining to the medical geography topics at hand.
For maps with specific sections magnified and posted, only the original map is cited, with numbers of variations, edits or artistic re-renderings, parts or portions thereof, and sub-sections of maps counted and noted in parentheses.
Inserts or framed images found on a map are usually treated as unique and separate maps (for download and use in writing).
Some maps are included in this count even though the page hasn’t been completed and opened for viewing.
This page was produced for medical maps posted here prior to August 1, 2013.
Recommended use: Comparing maps and their production over the years, esp. those with similar or identical themes.
Numbers in brackets stand for page stats, as follows: [#originals–#re-renderings/analytics–#other maps–total maps on page]
++++++++++++++++++++++++++++++++++++++++++++++++++
YEARS
Pre-1700
1700-1800
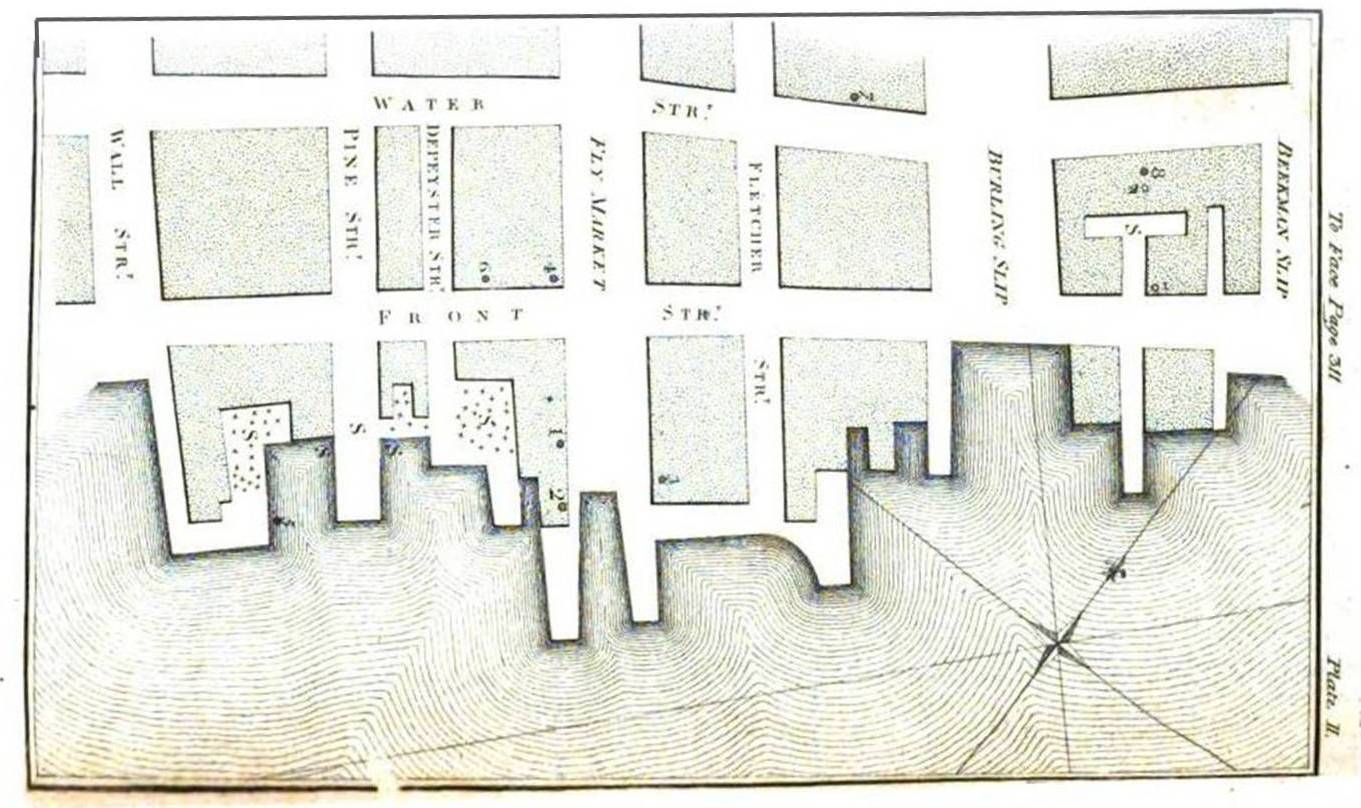
1797. Valentine Seaman, 1797 (1804) – the Black Plague or Yellow Fever of New York City. Full Page. Map1. Map2 (both maps are very local, small area, lower NYC). [2-19(4)-10-31]
1800-1834
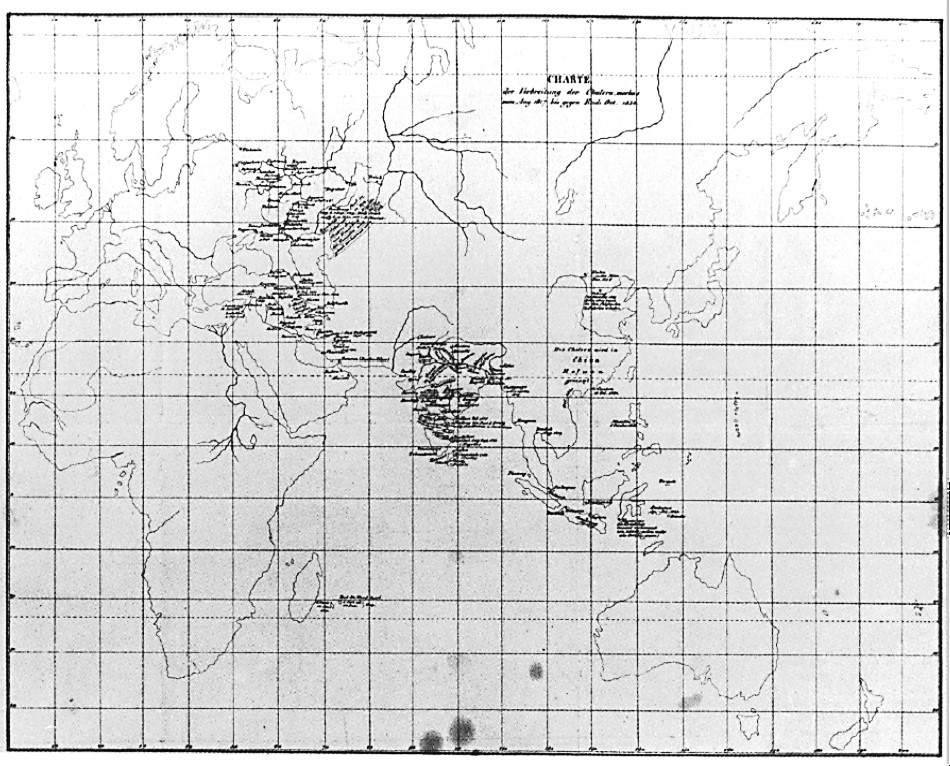
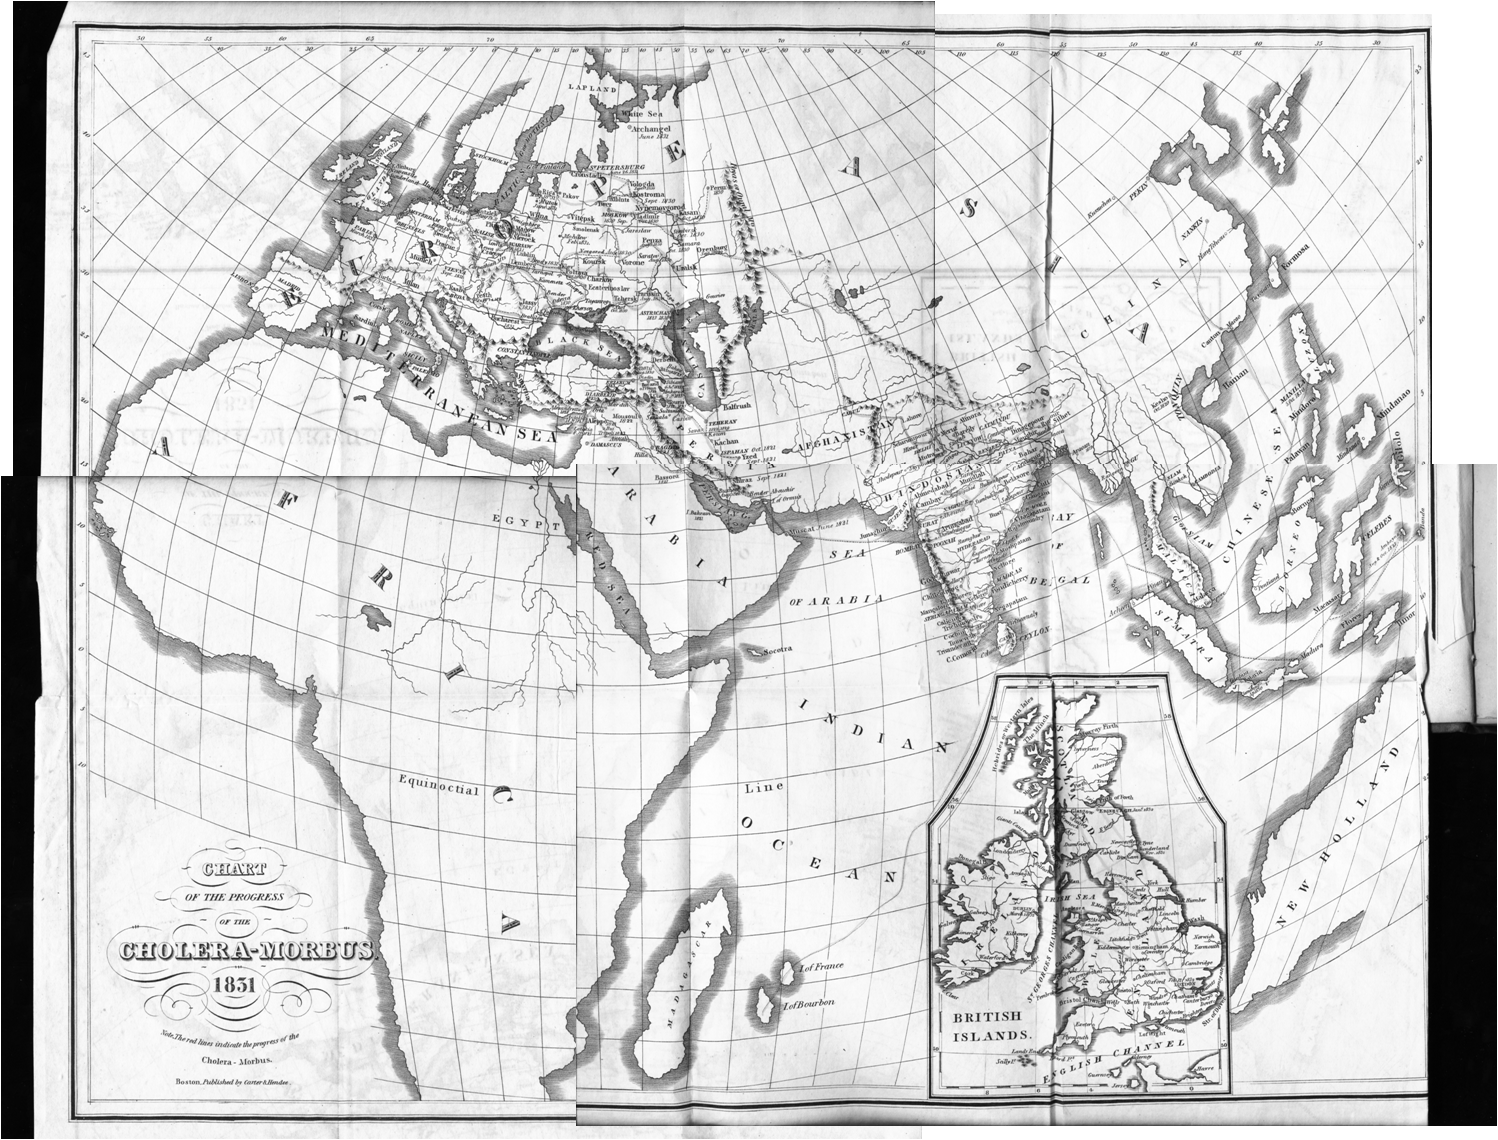
1827. Friedrich Schnurrer’s ‘Charte Uber die geographische Ausbreitung der Krankheiten’ (1827). Full Page. World Diseases map. Cholera map 1. Cholera map 2. [3-12-0-15]
1833. Scouttetten and the Cholera Diffusion Process in Eastern Europe and Russia, 1831. Full Page. Map. [1-10-0-11]
1835-1859
1844/1850. Daniel Drake – Principal Diseases of the Interior Valley, 1844 (1850, 15 maps). Full Page. US, Mobile Bay, Mississippi Delta, Pensacola, New Orleans, Trough of the Mississippi, Memphis, St. Louis, Untiled Transects (graphs), Harrodsborg, Pittsburg, Cincinnati, Mackinac, Buffalo, Montreal, Quebec, Weather Information graphs [15-26-4-45]
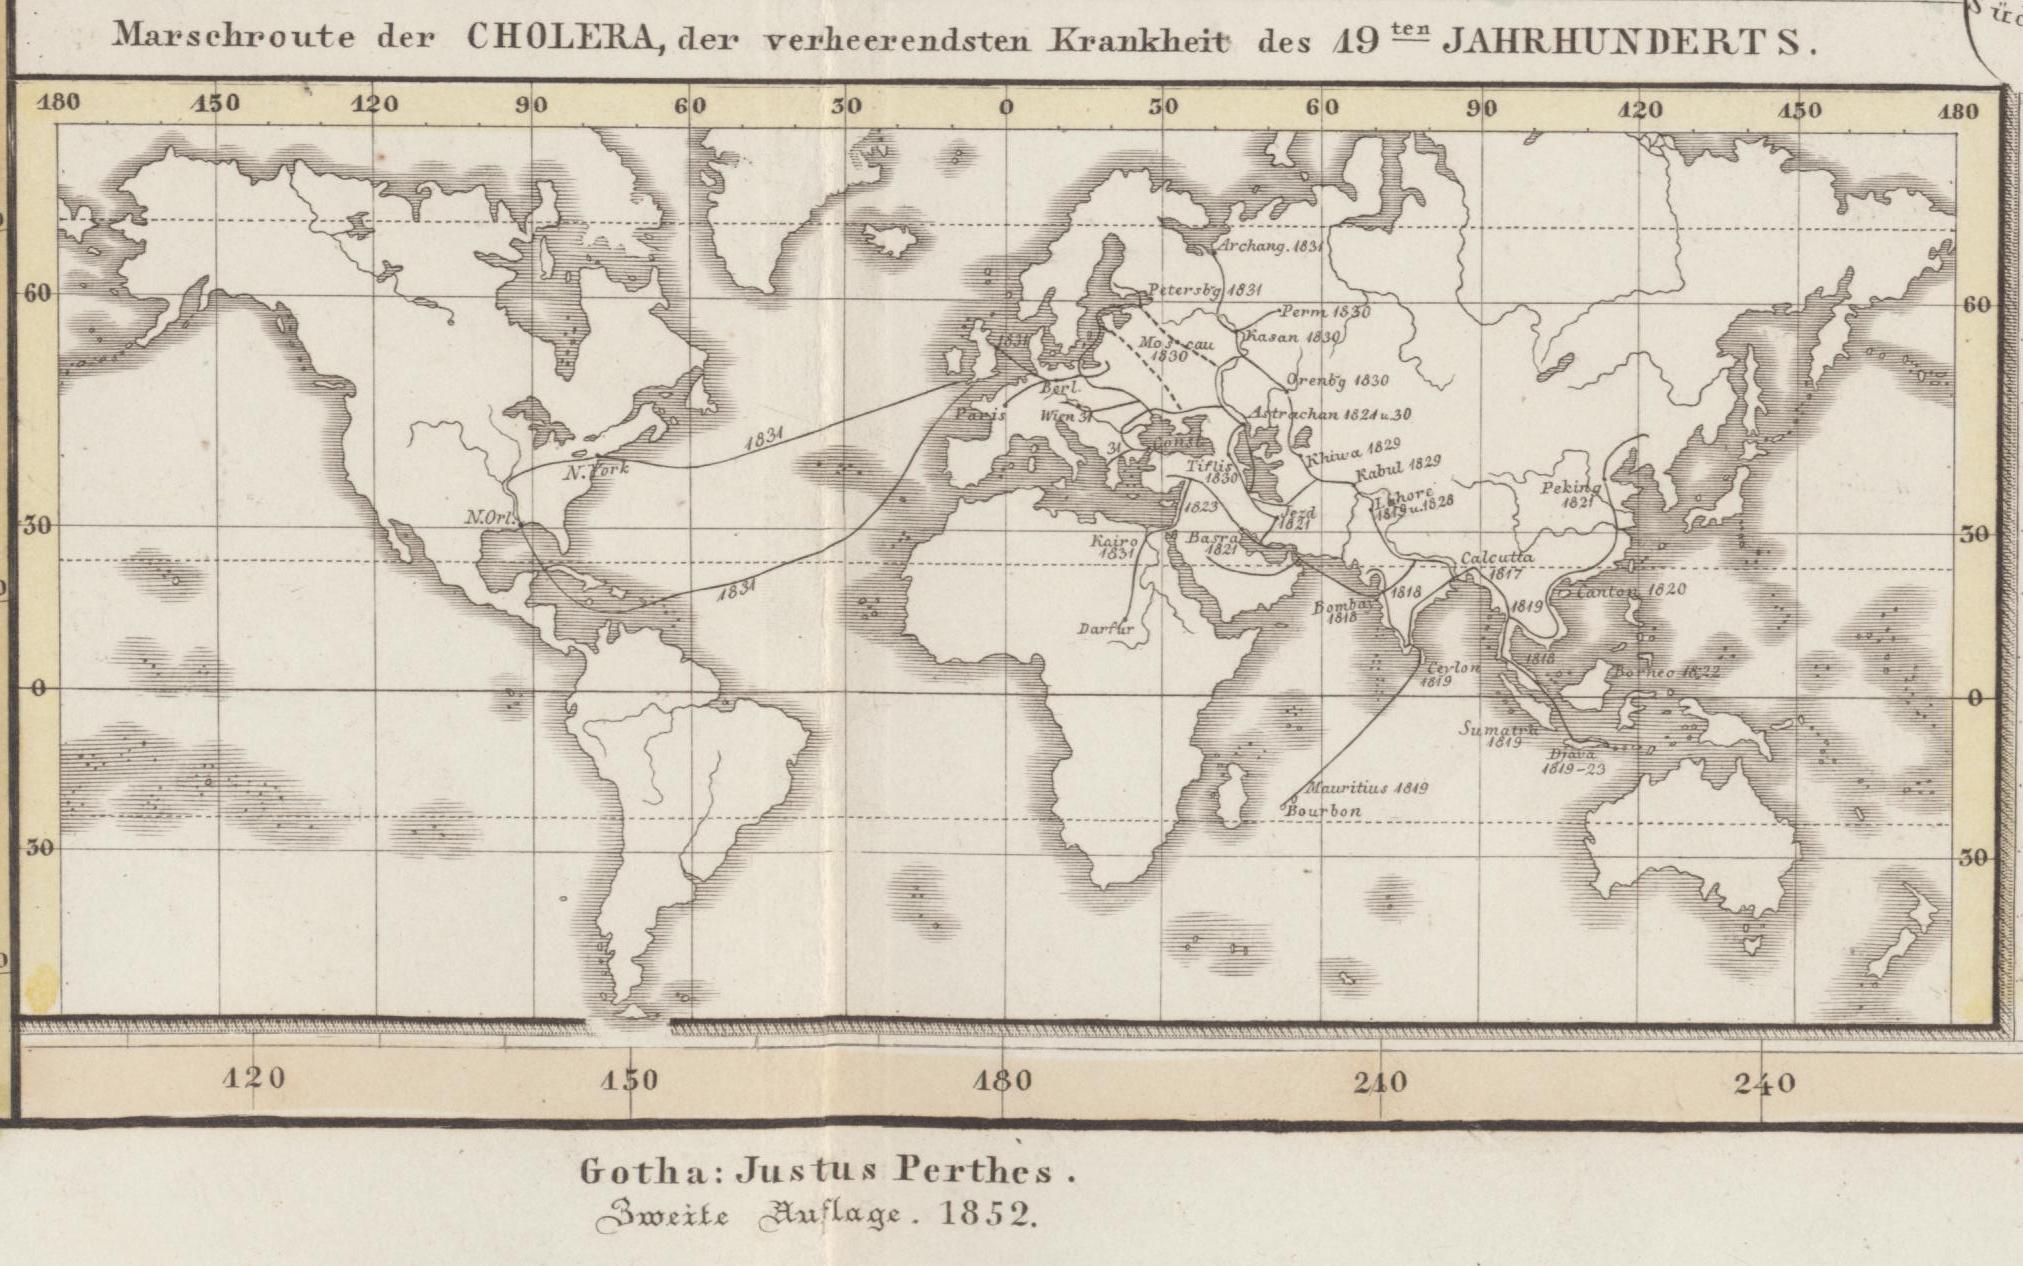
1848/1852? (2ed?). Heinrich Berghaus’s ‘Planiglob . . . der vornehmsten Krankheiten’ (1848). Full Page. Global Disease map. Inset maps: North America. Cholera routes, 1852. [0-30-0-30]
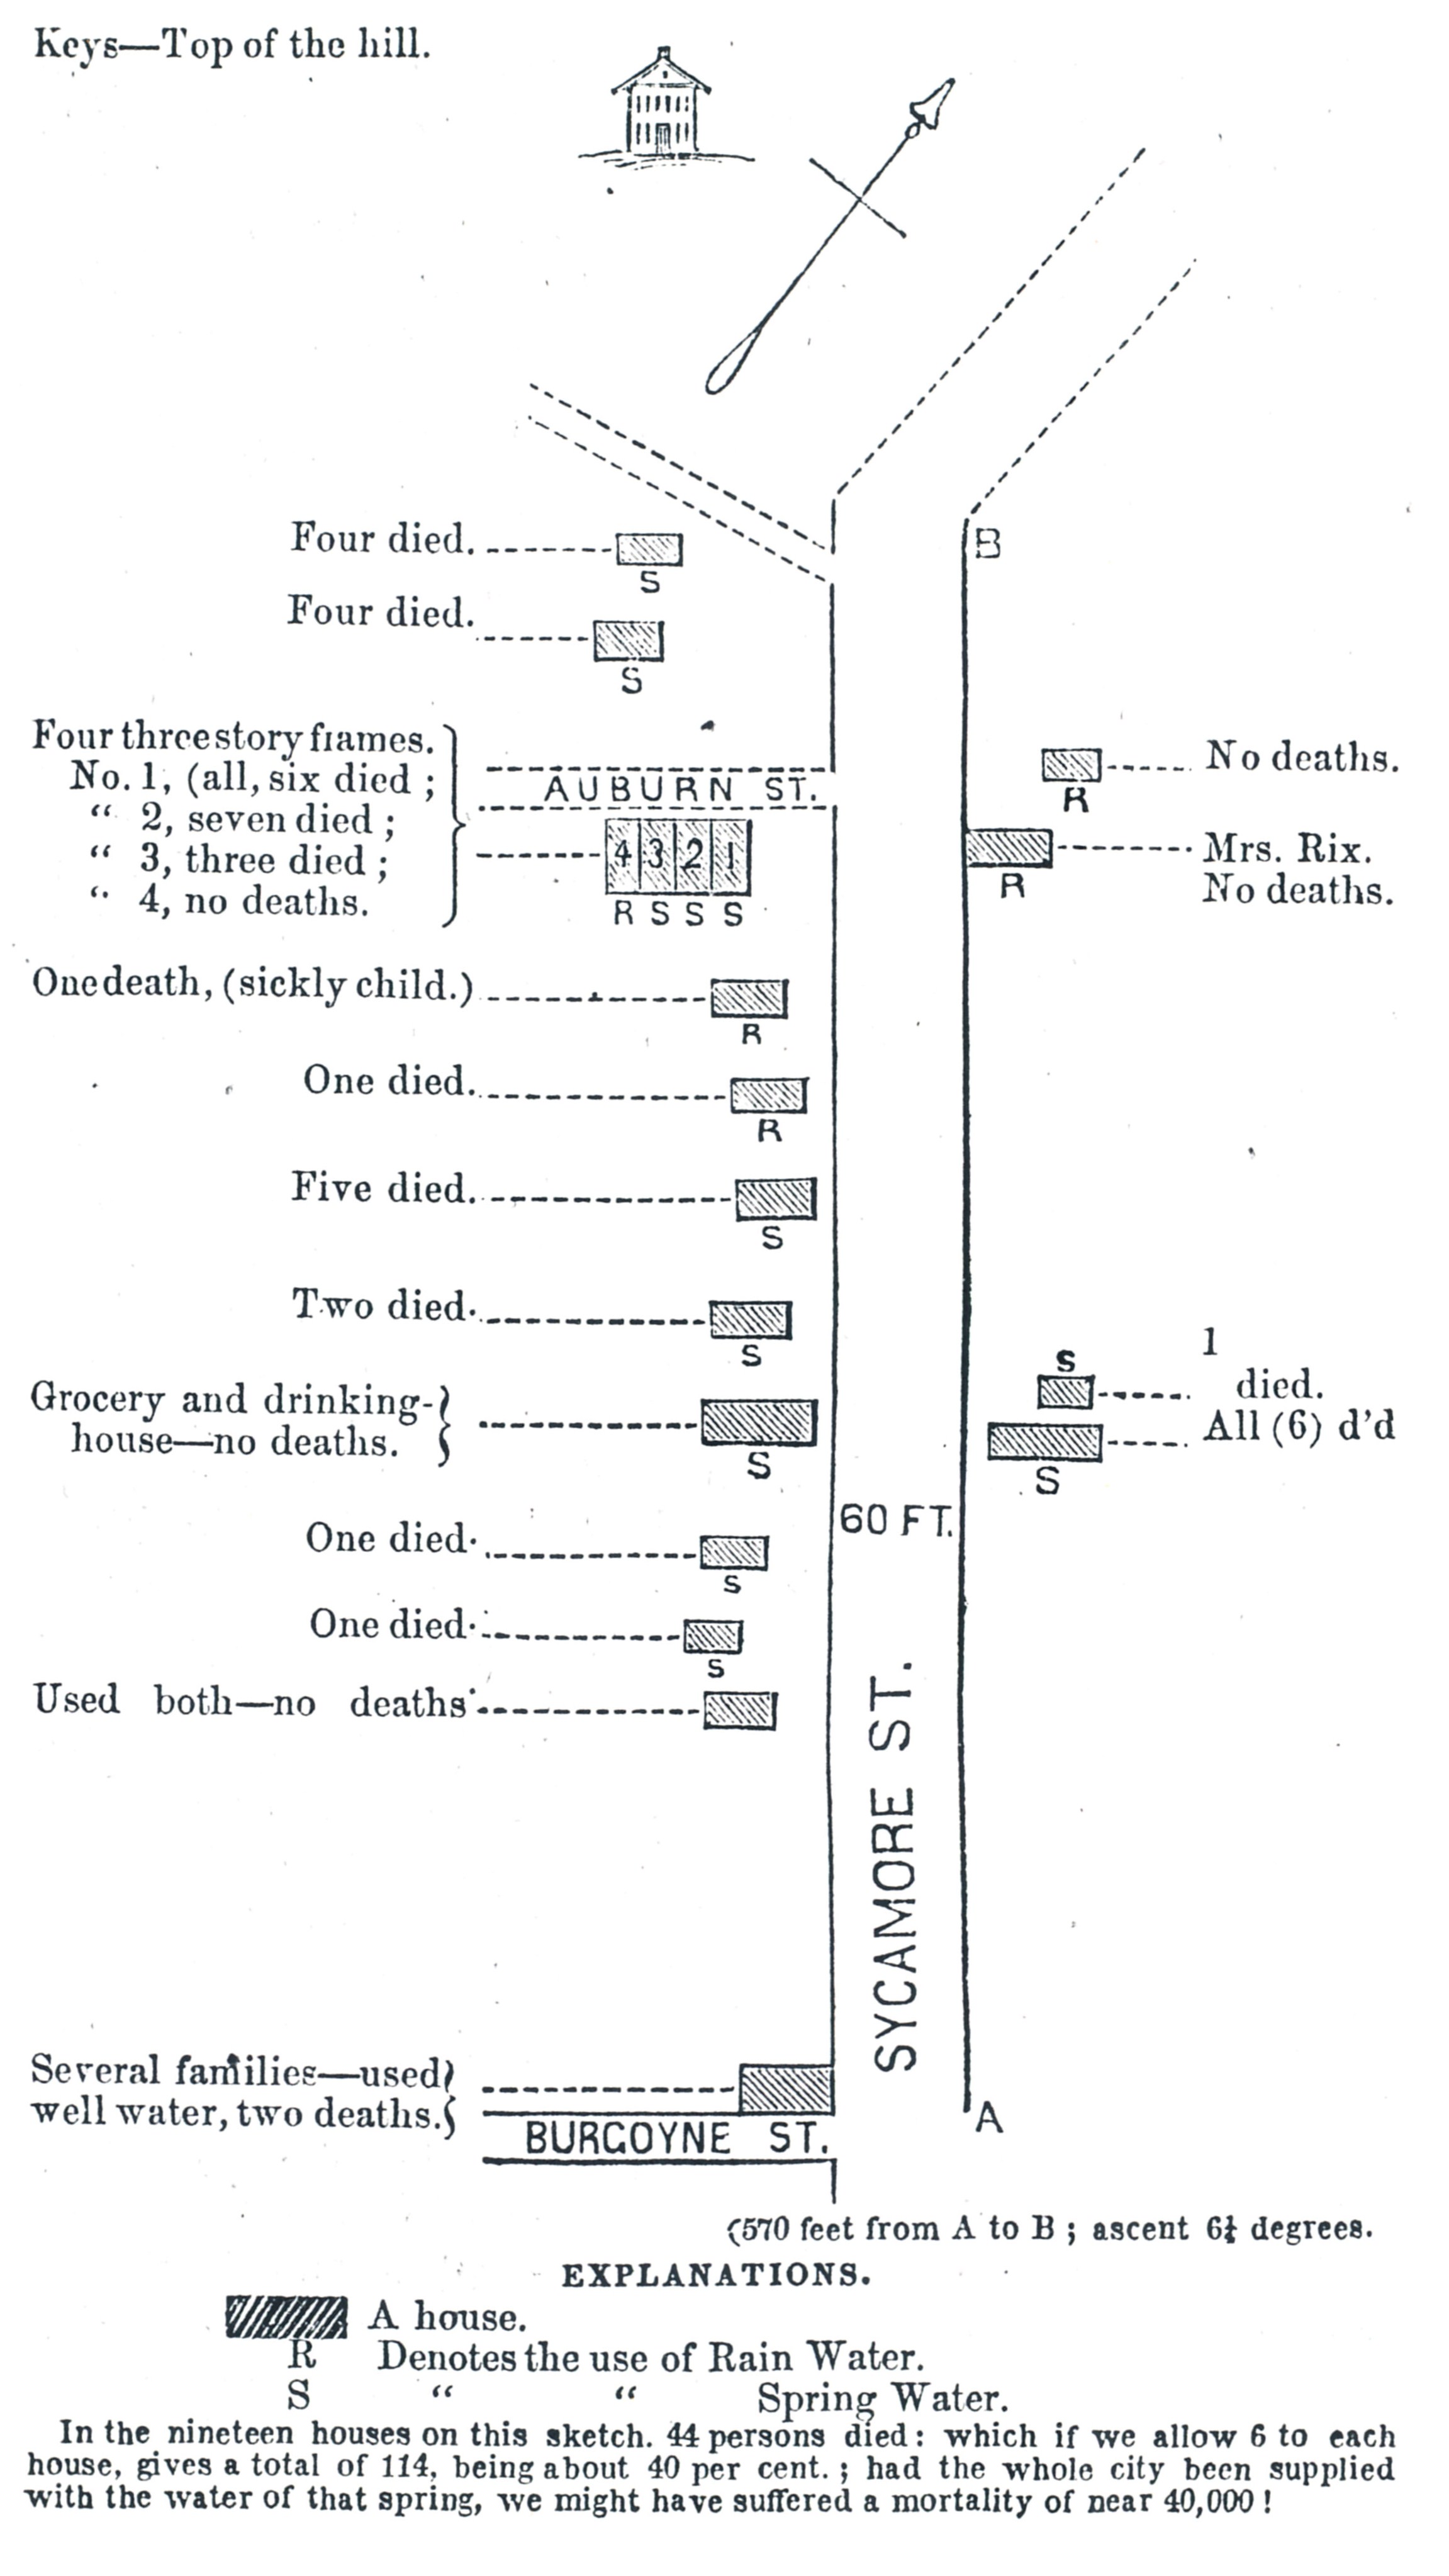
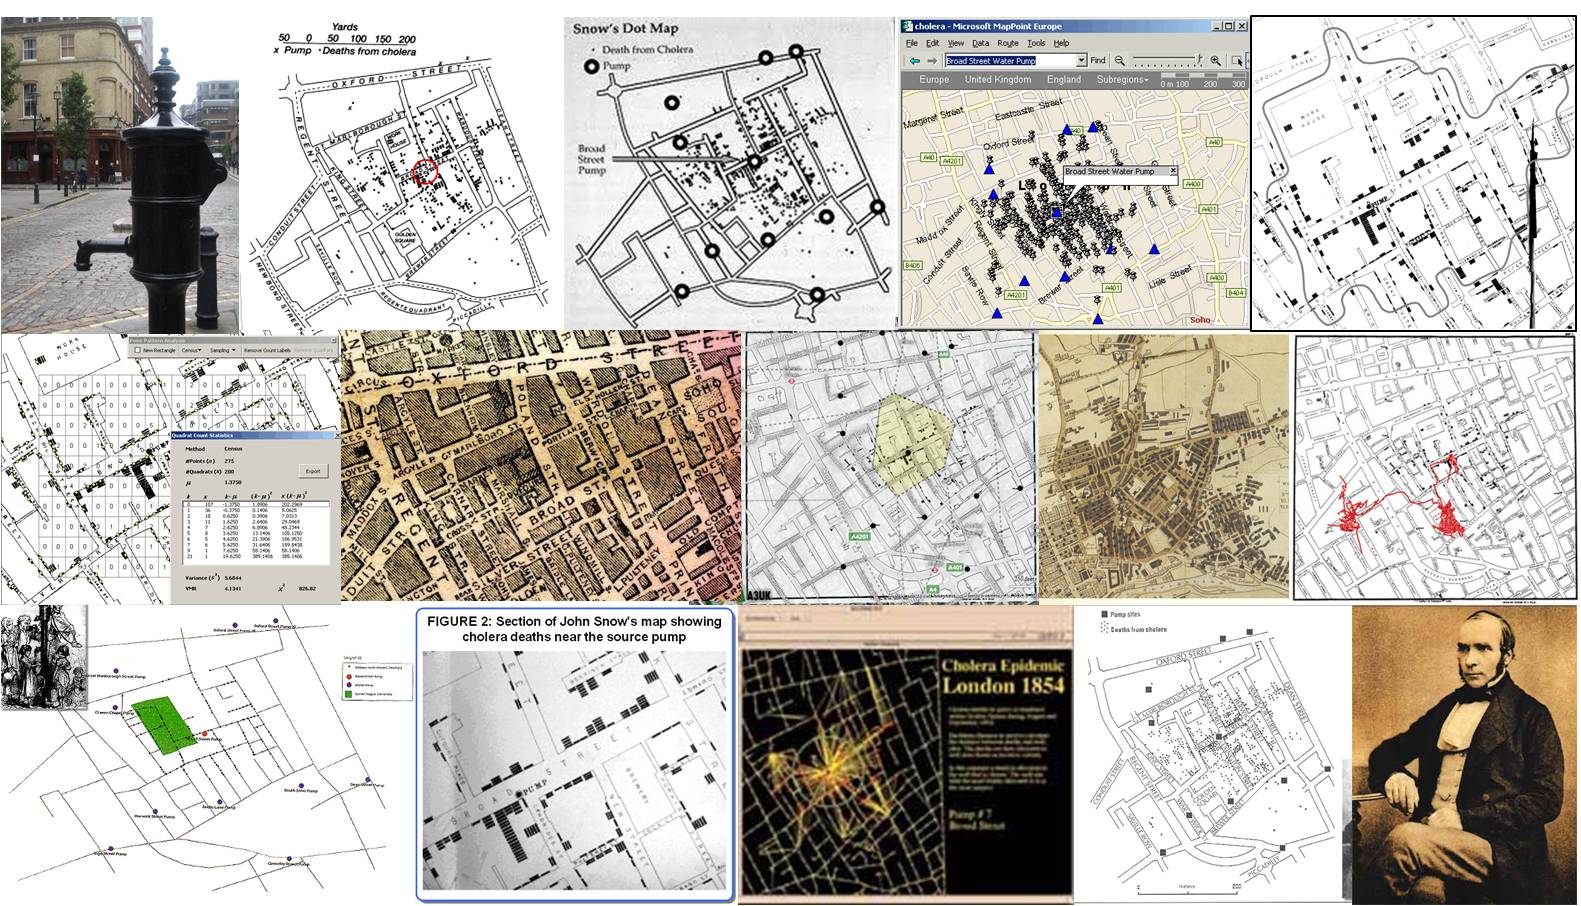
1850. John Lea and the Geology of Cholera (1849). Full Page. Map (very local, small area, in Cincinnati, OH). [1-0-0-1]
1854-7. Sir Henry W. Acland – ‘Health, Work and Play’ in Oxford, 1854-7. Full Page. Map (very local, small area, in London). Page also includes 5 maps for comparison, two by Seaman-1797 (2), one by AMA-1850 (1), one by Snow-1849/1854 (1), and one by Lea (1850); 8+ contemporary Aerial Photography reviews are provided (1 aggregate, 5 comparing + 2 standalones). [1-3-13-17]
1856. Adolph Muhry’s Global Disease Map (1856). Full Page. World Diseases map. [1-9-0-10]
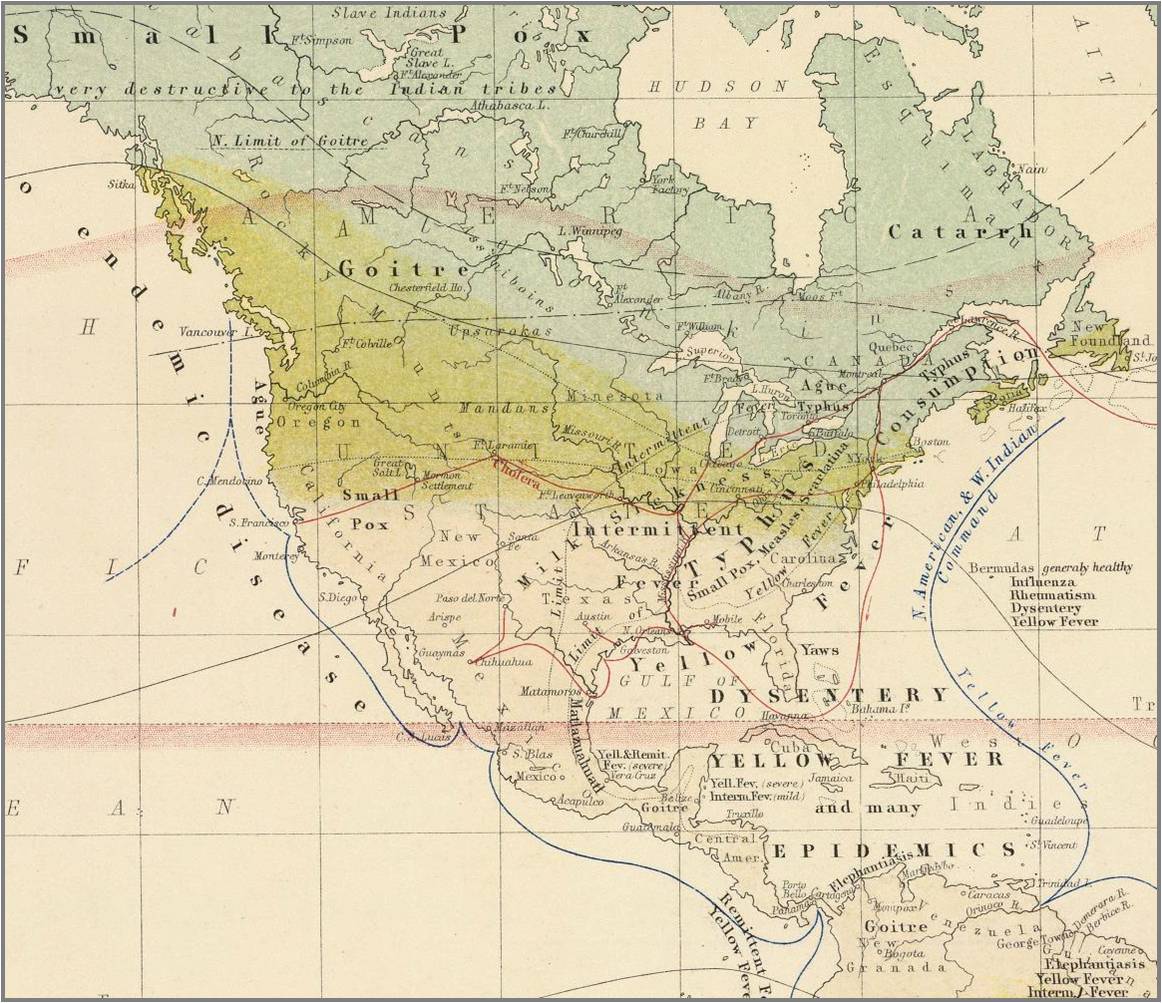
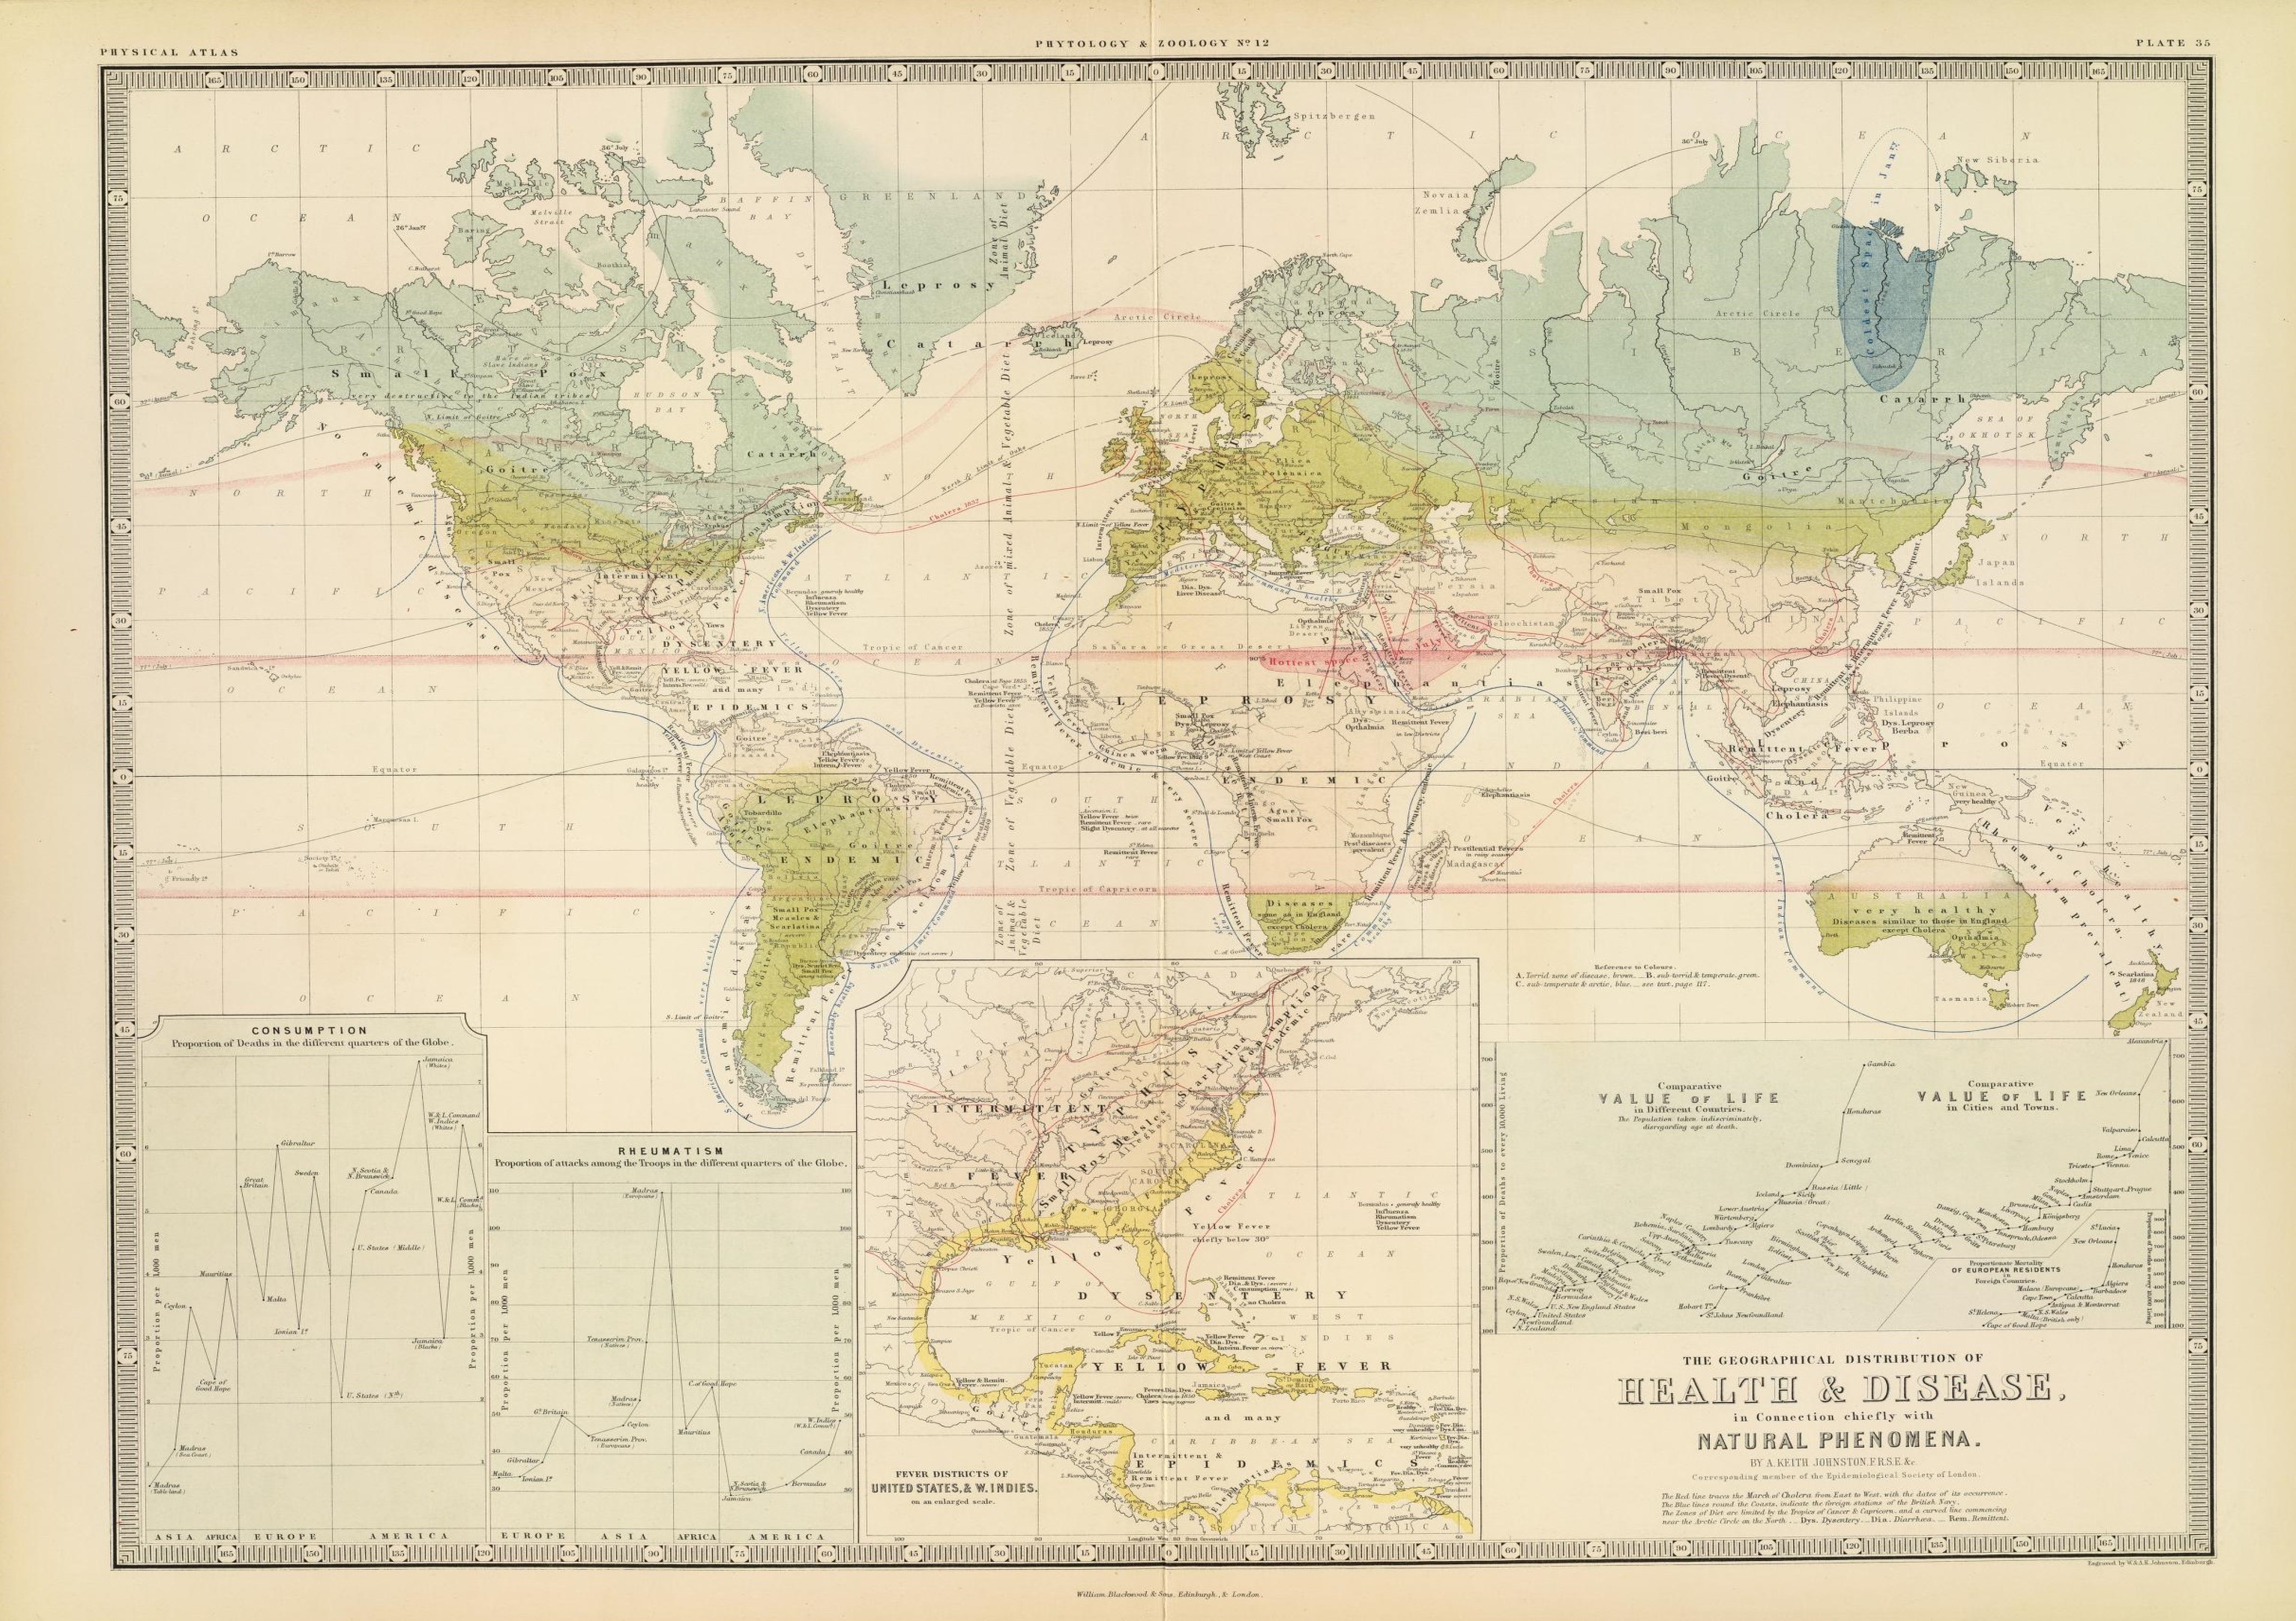
1856. Alexander Keith Johnston – “Health & Disease” in North America. Full Page. Global Map. Inset Map. This is devoted to just the inset of North America on Johnston’s global disease map folio. Disease zones are defined. [1-11-1(unstable)-13]
1856. Alexander Keith Johnston’s Map of World Diseases – A Detailed Review (1856). Full Page. Global Map. 6 tables, boxes, legend from map, 1 inset, 1 historical map for comparison (Felkin, with links to other classics–Lea, Snow), 1 aerial image (google map), and 1 collage also posted on Pinterest. [1-18-10-29].
1860-1869
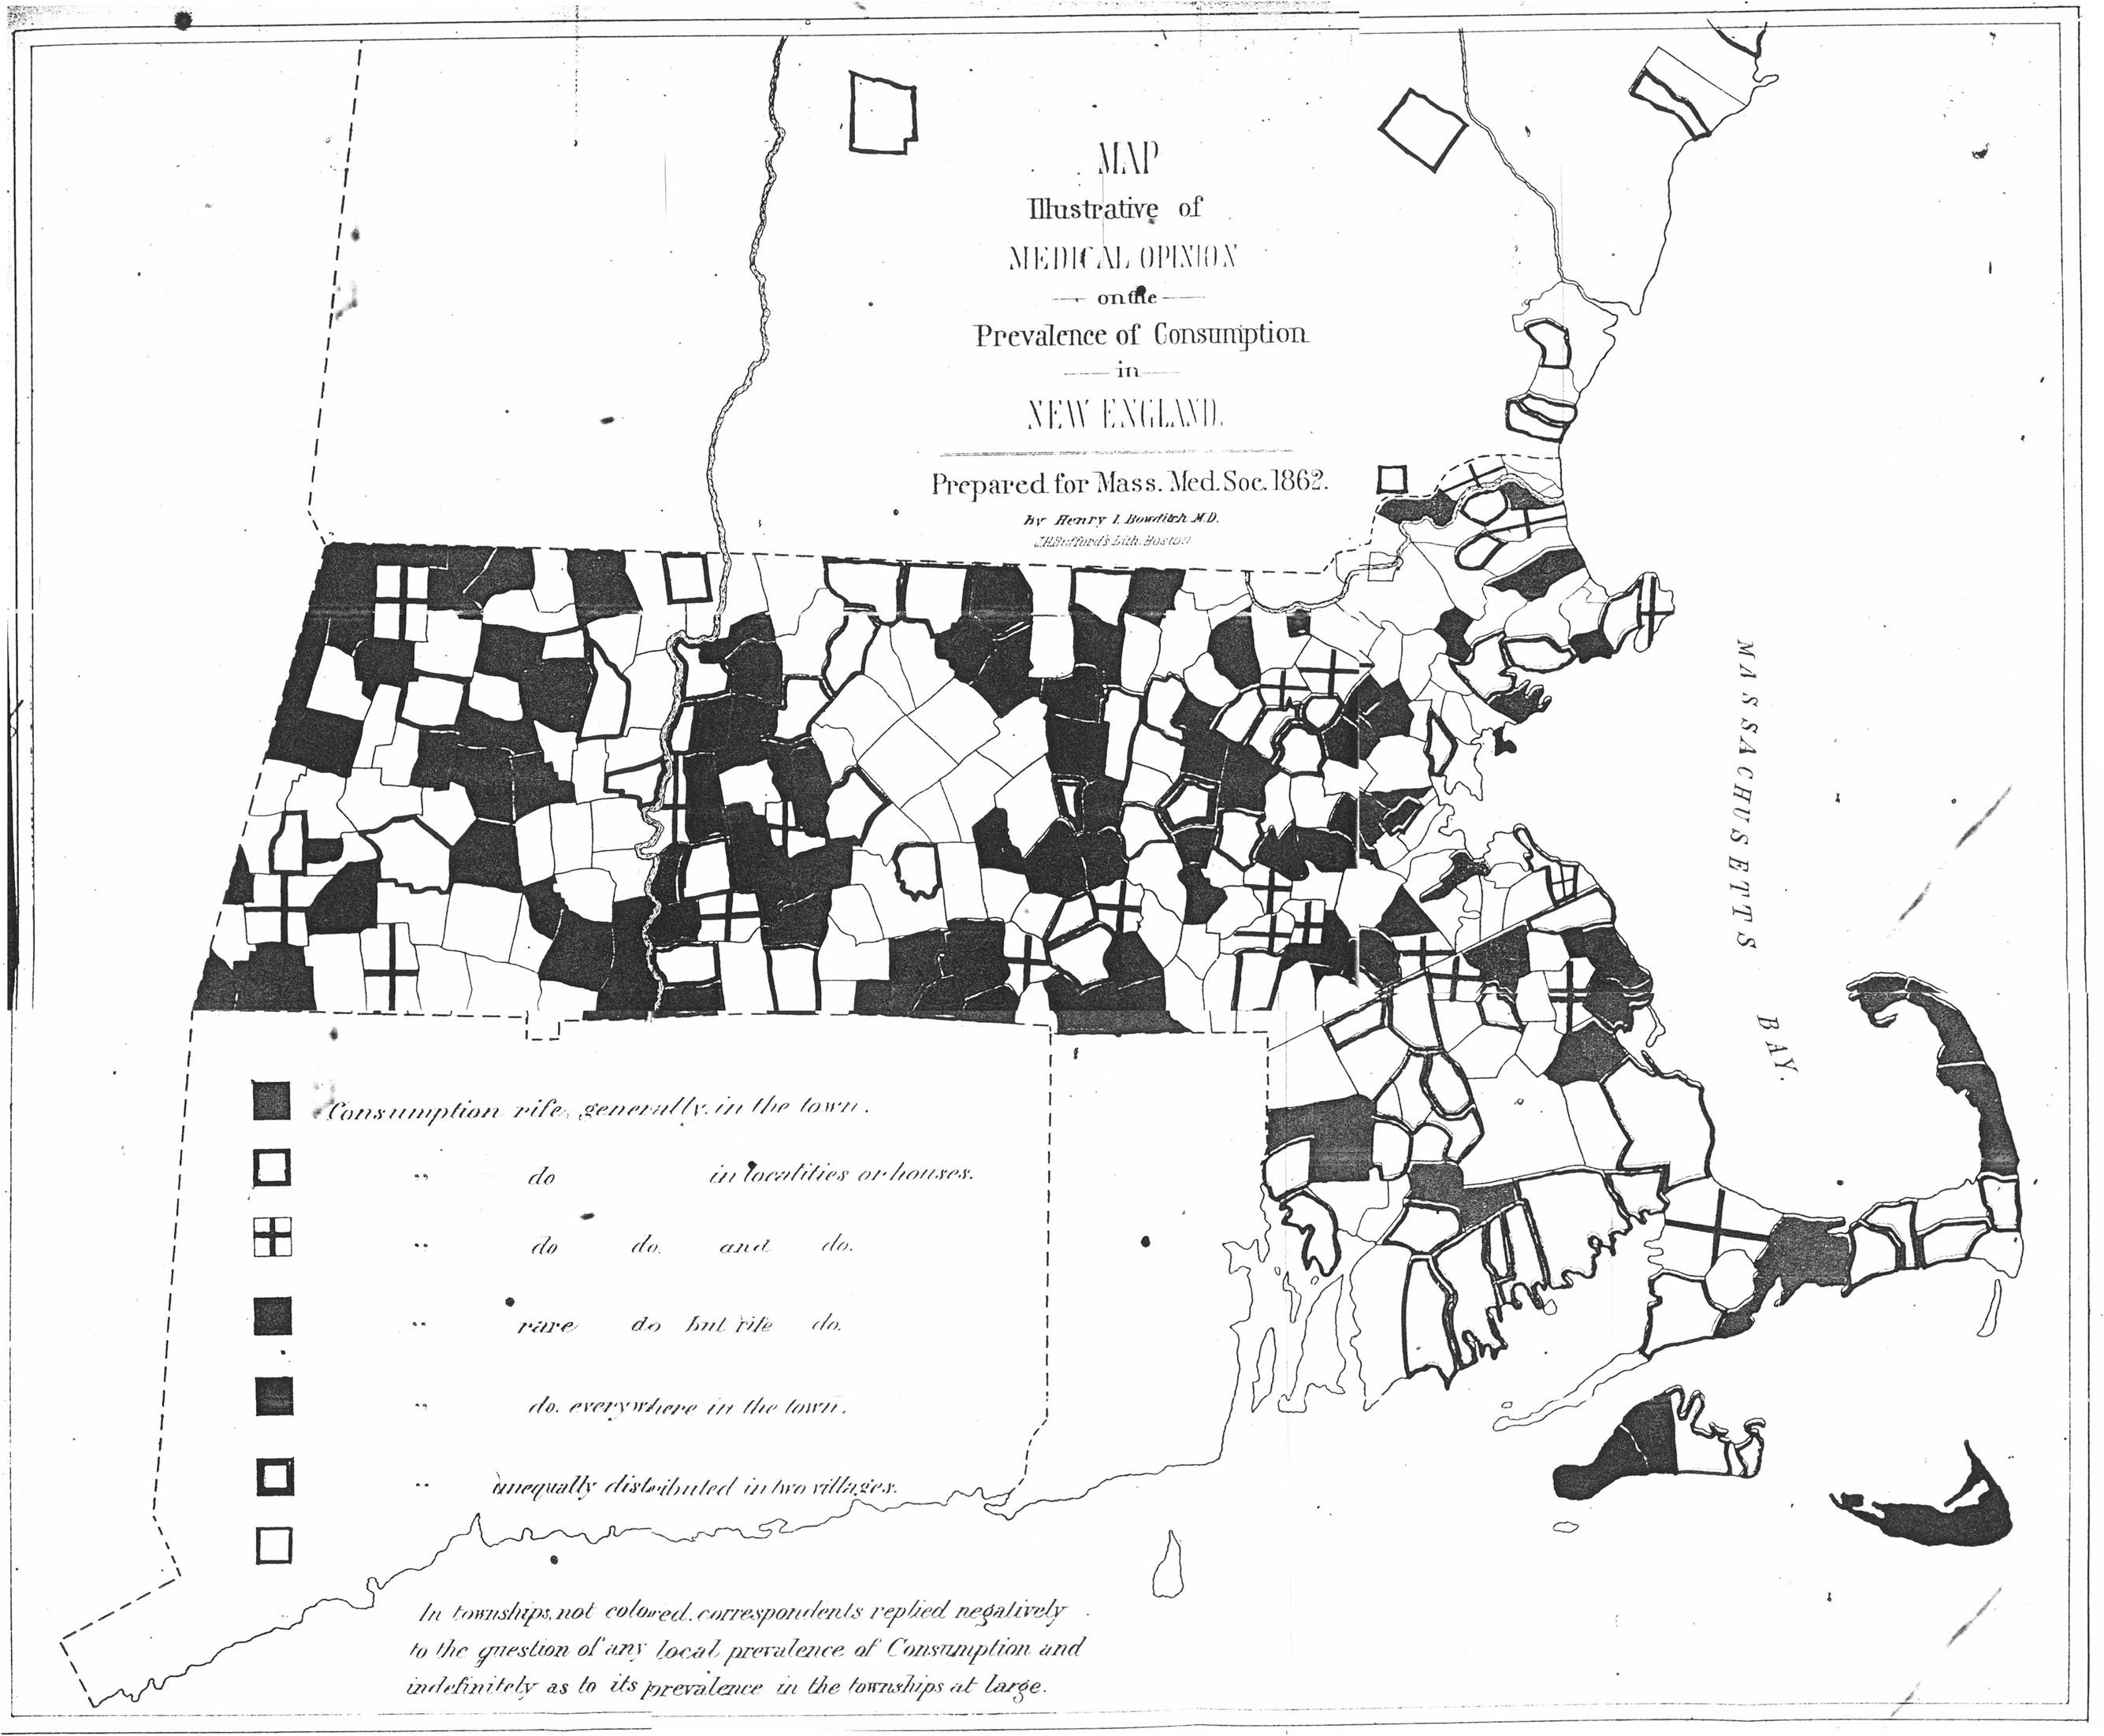
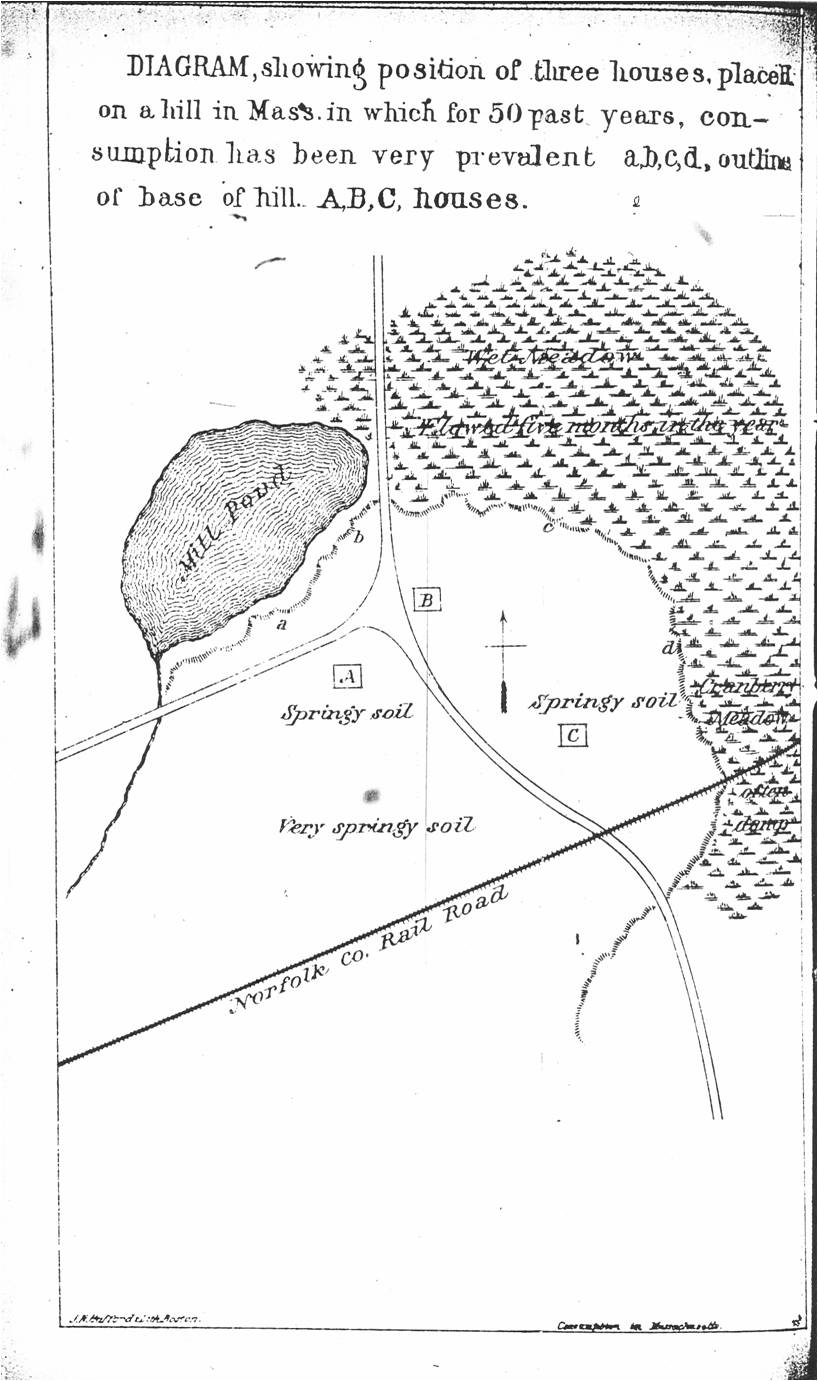
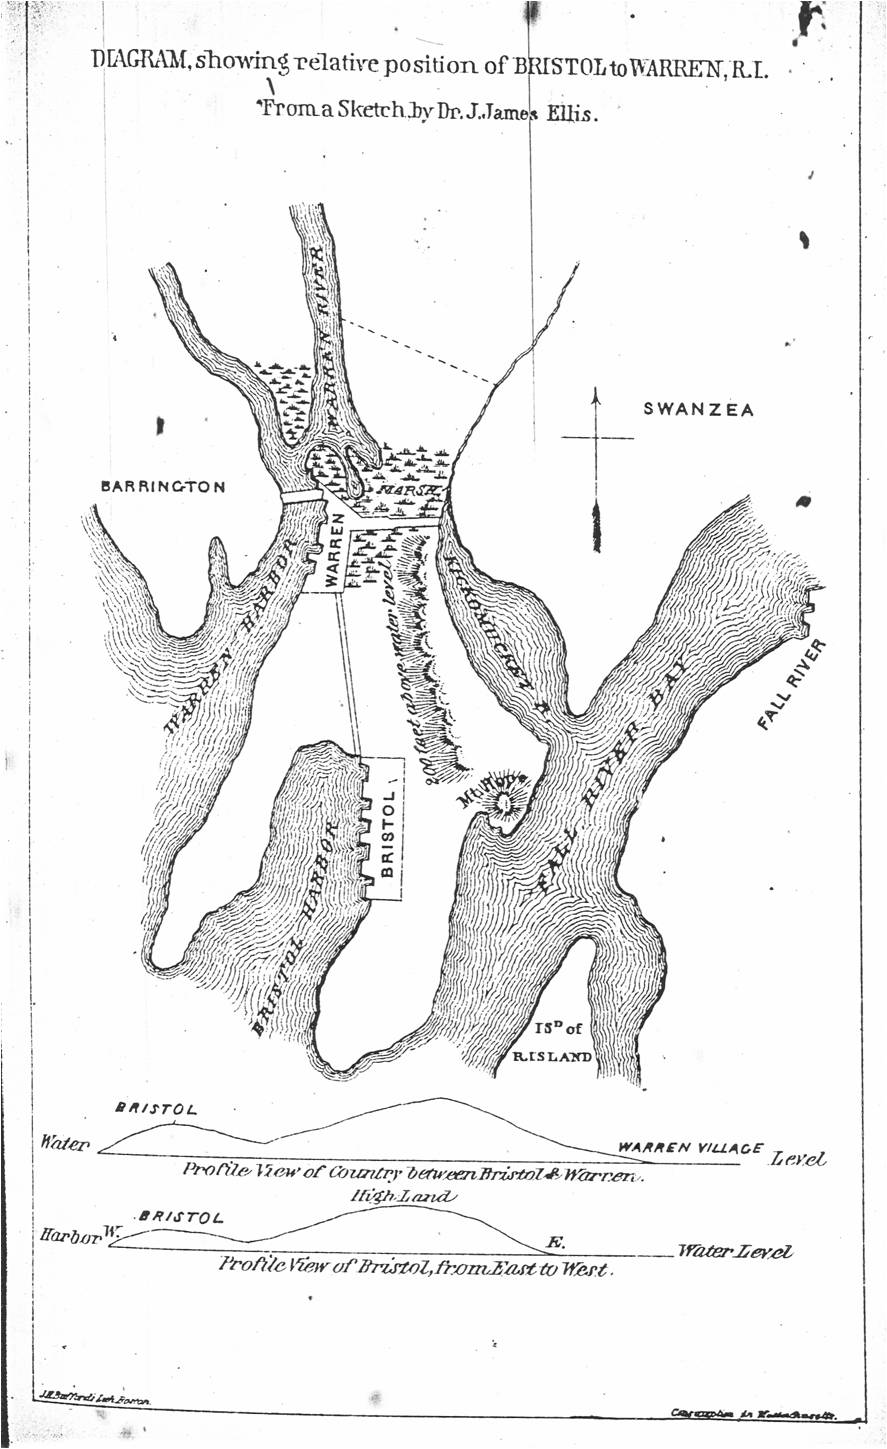
1862. Bowditch’s Consumption Maps, 1862. Full Page. Massachusetts State Map. Regional map1 (swampy area). Regional map2 (Mill pond). Regional map3 (Warren & Bristol), Regional map4 (West Newbury). State Map Photographed, with 2 close ups. [5-3-21-29]
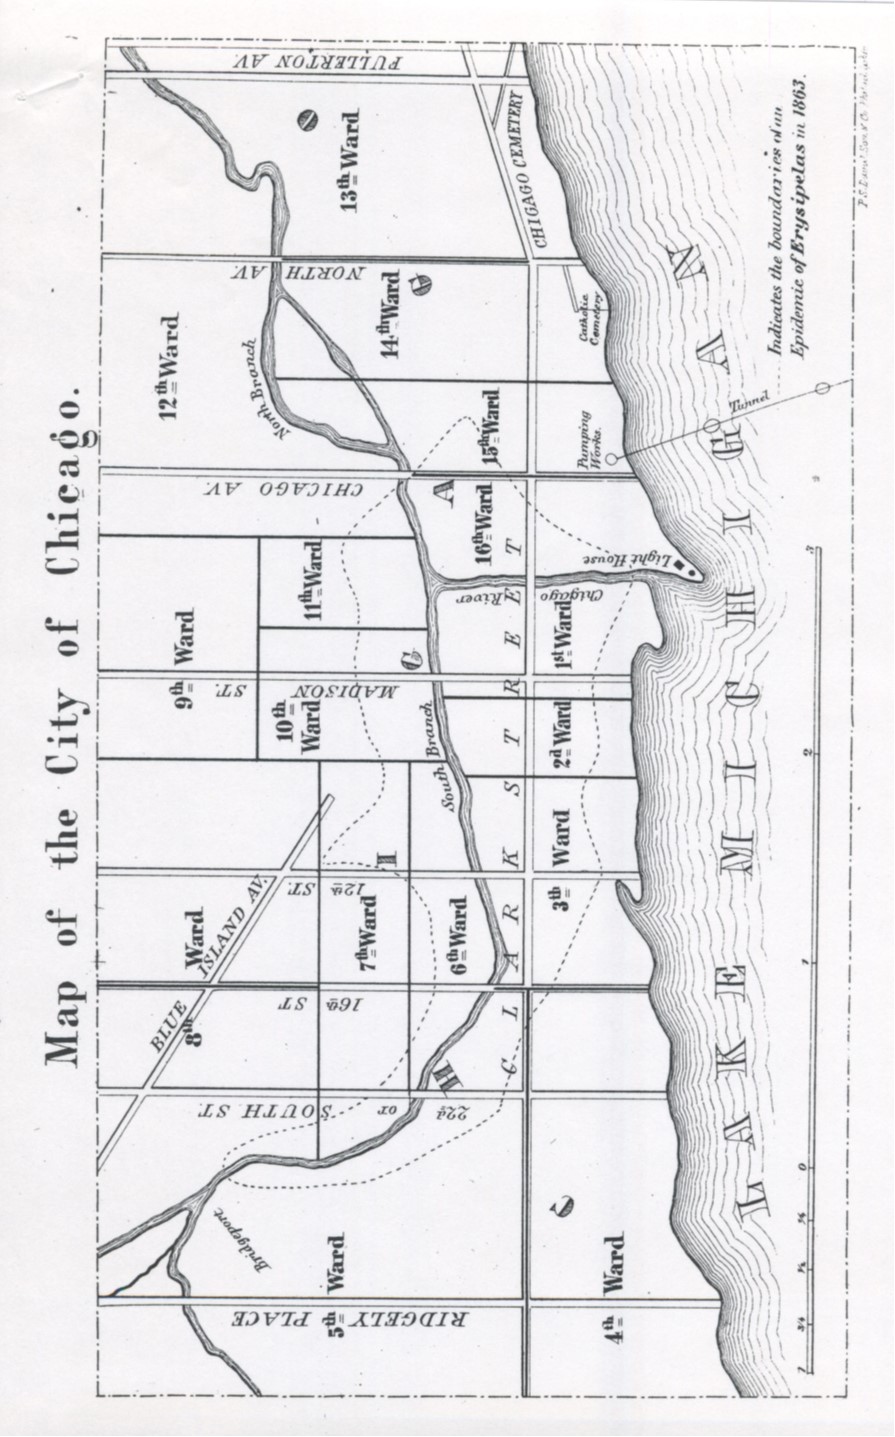
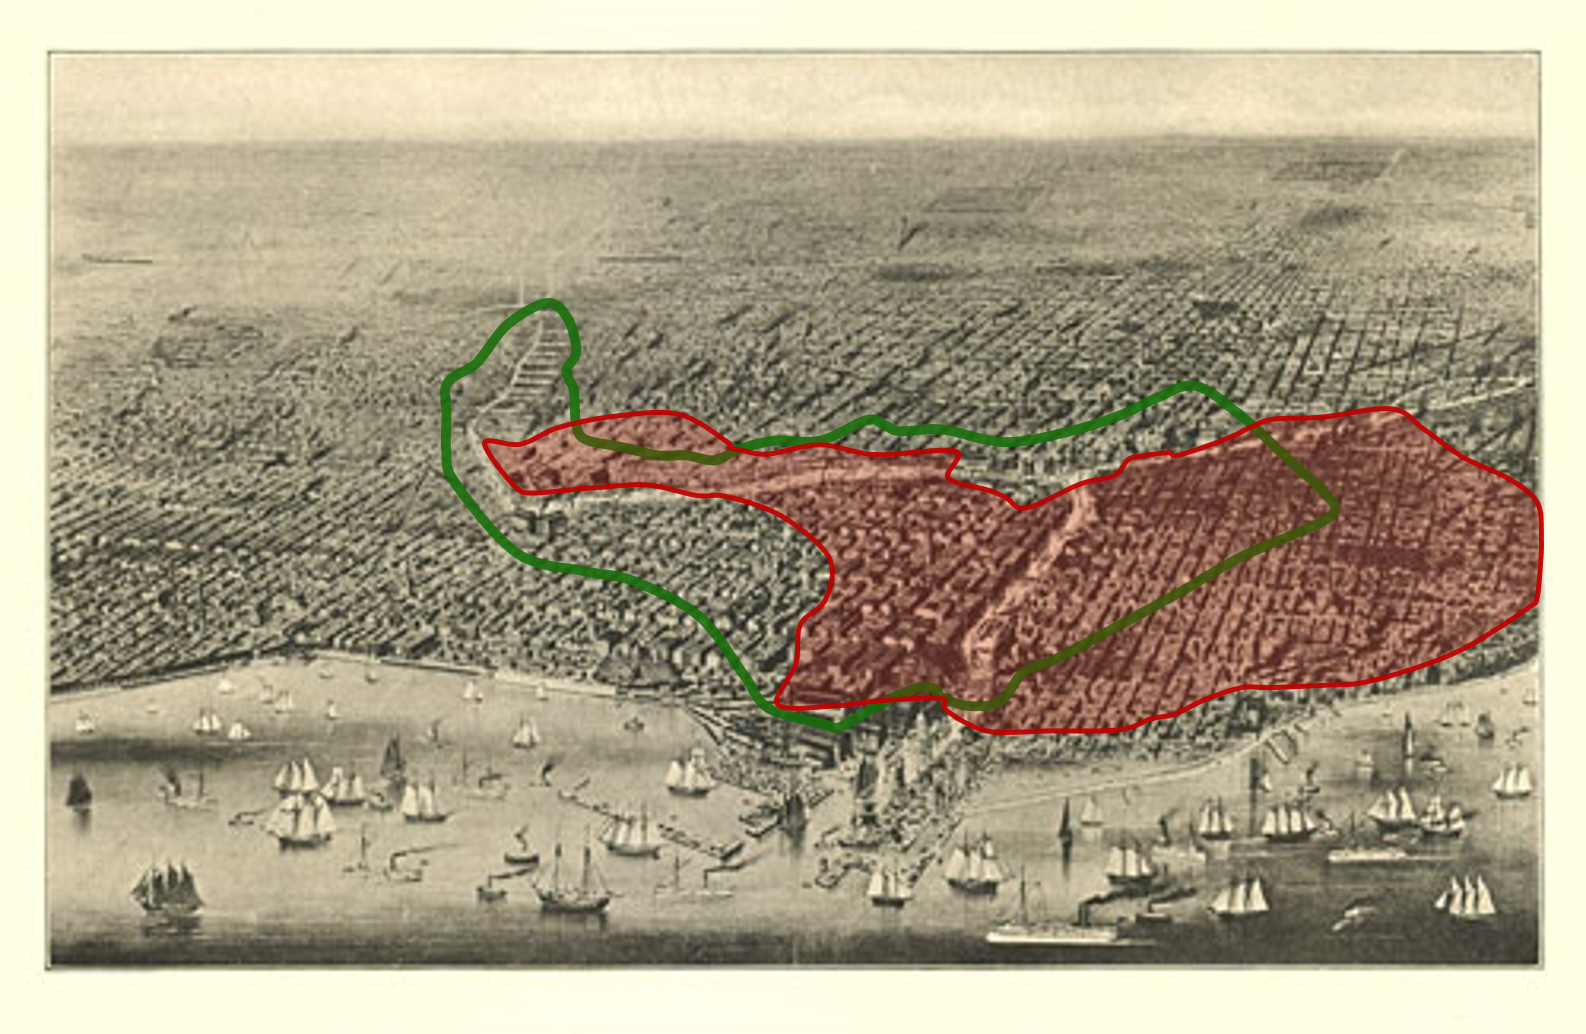
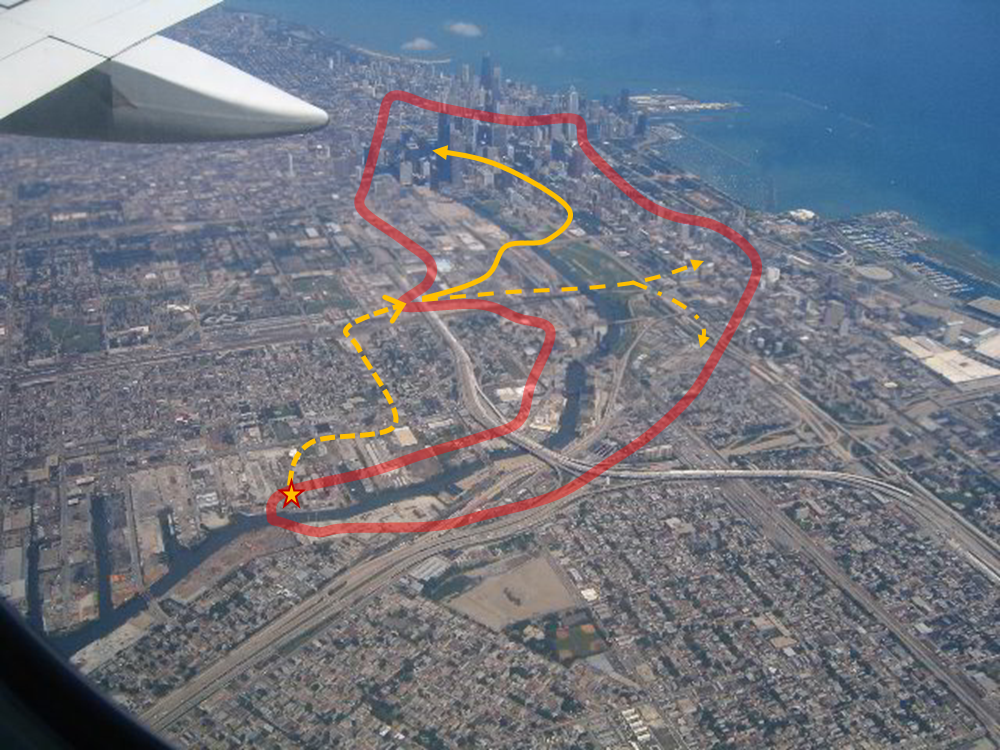
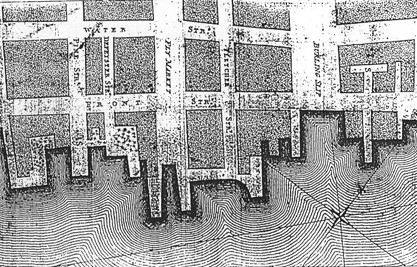
1863. Dr. Robert C. Hamill – the Geography of Erysipelas in Chicago, Illinois (1867). Full Page. Regional Map. Five important analysis related figures: Figure1 (rectangle used to rectify overlay for epidemic and Chicago Fire regions pulled from two different maps), Figure2 (epidemic region depicted several ways), Figure3 (another of the same), Figure4 (aerial view depiction of two events-epidemic, fire), Figure5 (possible route of spread, if spread through direct/indirect human contact). Several illustrations of the town-city area during several periods of development were provided as well. [1-7-12-20]
1863, 1872. William Aitken’s Realms of Men – Hygiology and Disease (1872). Full Page. Global Map (not yet photographed). Comparison maps: Schnurrer, Berghaus, Johnston, Muhry. Note: William Aitken described in detail William Farr’s nosology of disease based on the zymotic theory. [0-22-7-29]
1870-1879
1873. Epidemics in 1873 – the Public Health Crisis of the Milk Industry. Full Page (inaccessible for now).
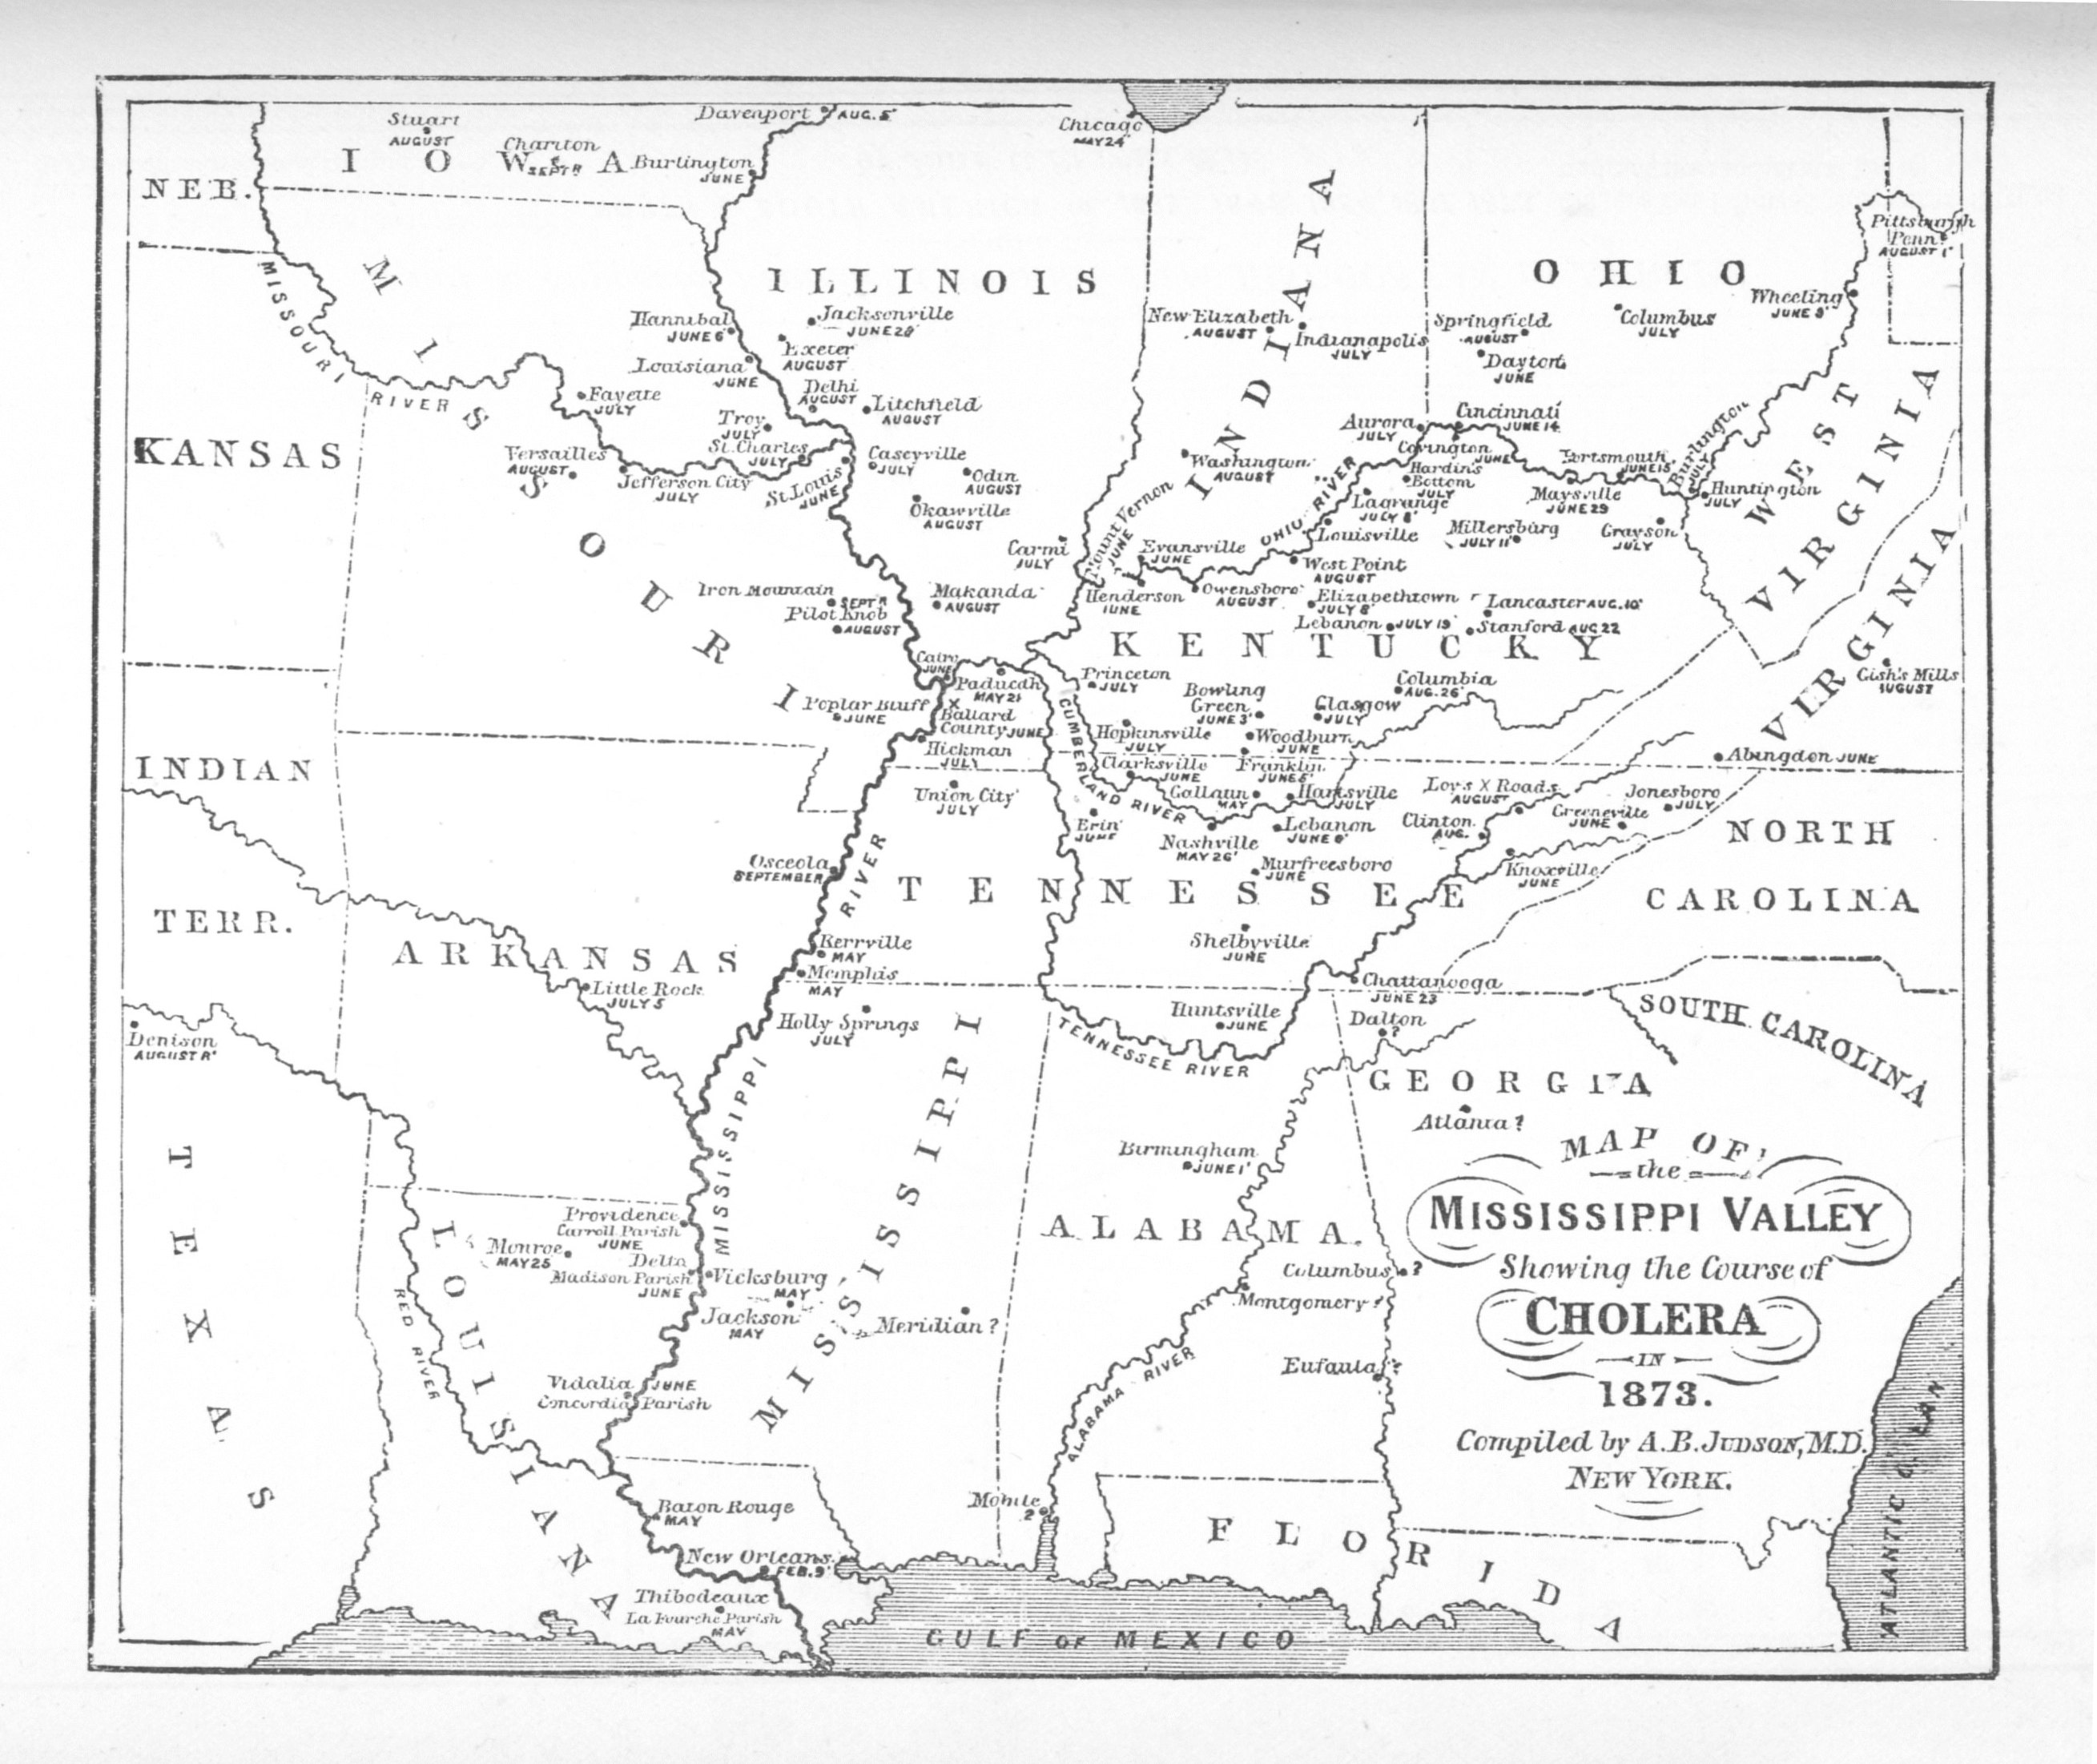
1875. John C. Peters and the Asiatic Cholera. Full Page (inaccessible for now). Map1 (ca. 1875, published by Wendt, 1885), Global Asiatic Cholera migration map. Although this page is intended to be specifically biographical, there are plenty of maps. Along with the traditional maps by Peters along with some up-close views of subsections, this page also includes maps by: Valentine Seaman, 1797 (external source used), Scoutetten, 1833, McClellan, c1832 (1875 published version), John Snow (1854/6), and Johnston, 1856 (North America inset only), and Judson, 1866/1875. Pyle’s work and maps are also discussed. [See other pages/links above and below on this page for more on each of these.] [2-5-10-17]
1877, 1881. Charles Denison – Rocky Mountain Health Resorts (1877, 1881). Full Page. Map (2 parts merged; need full single shot). Sections were selected to point out local features in close ups. Sections from eight pages from the book this map is in were added (more of this later). [1-12-8(book pp)-21]
.
1880-1889
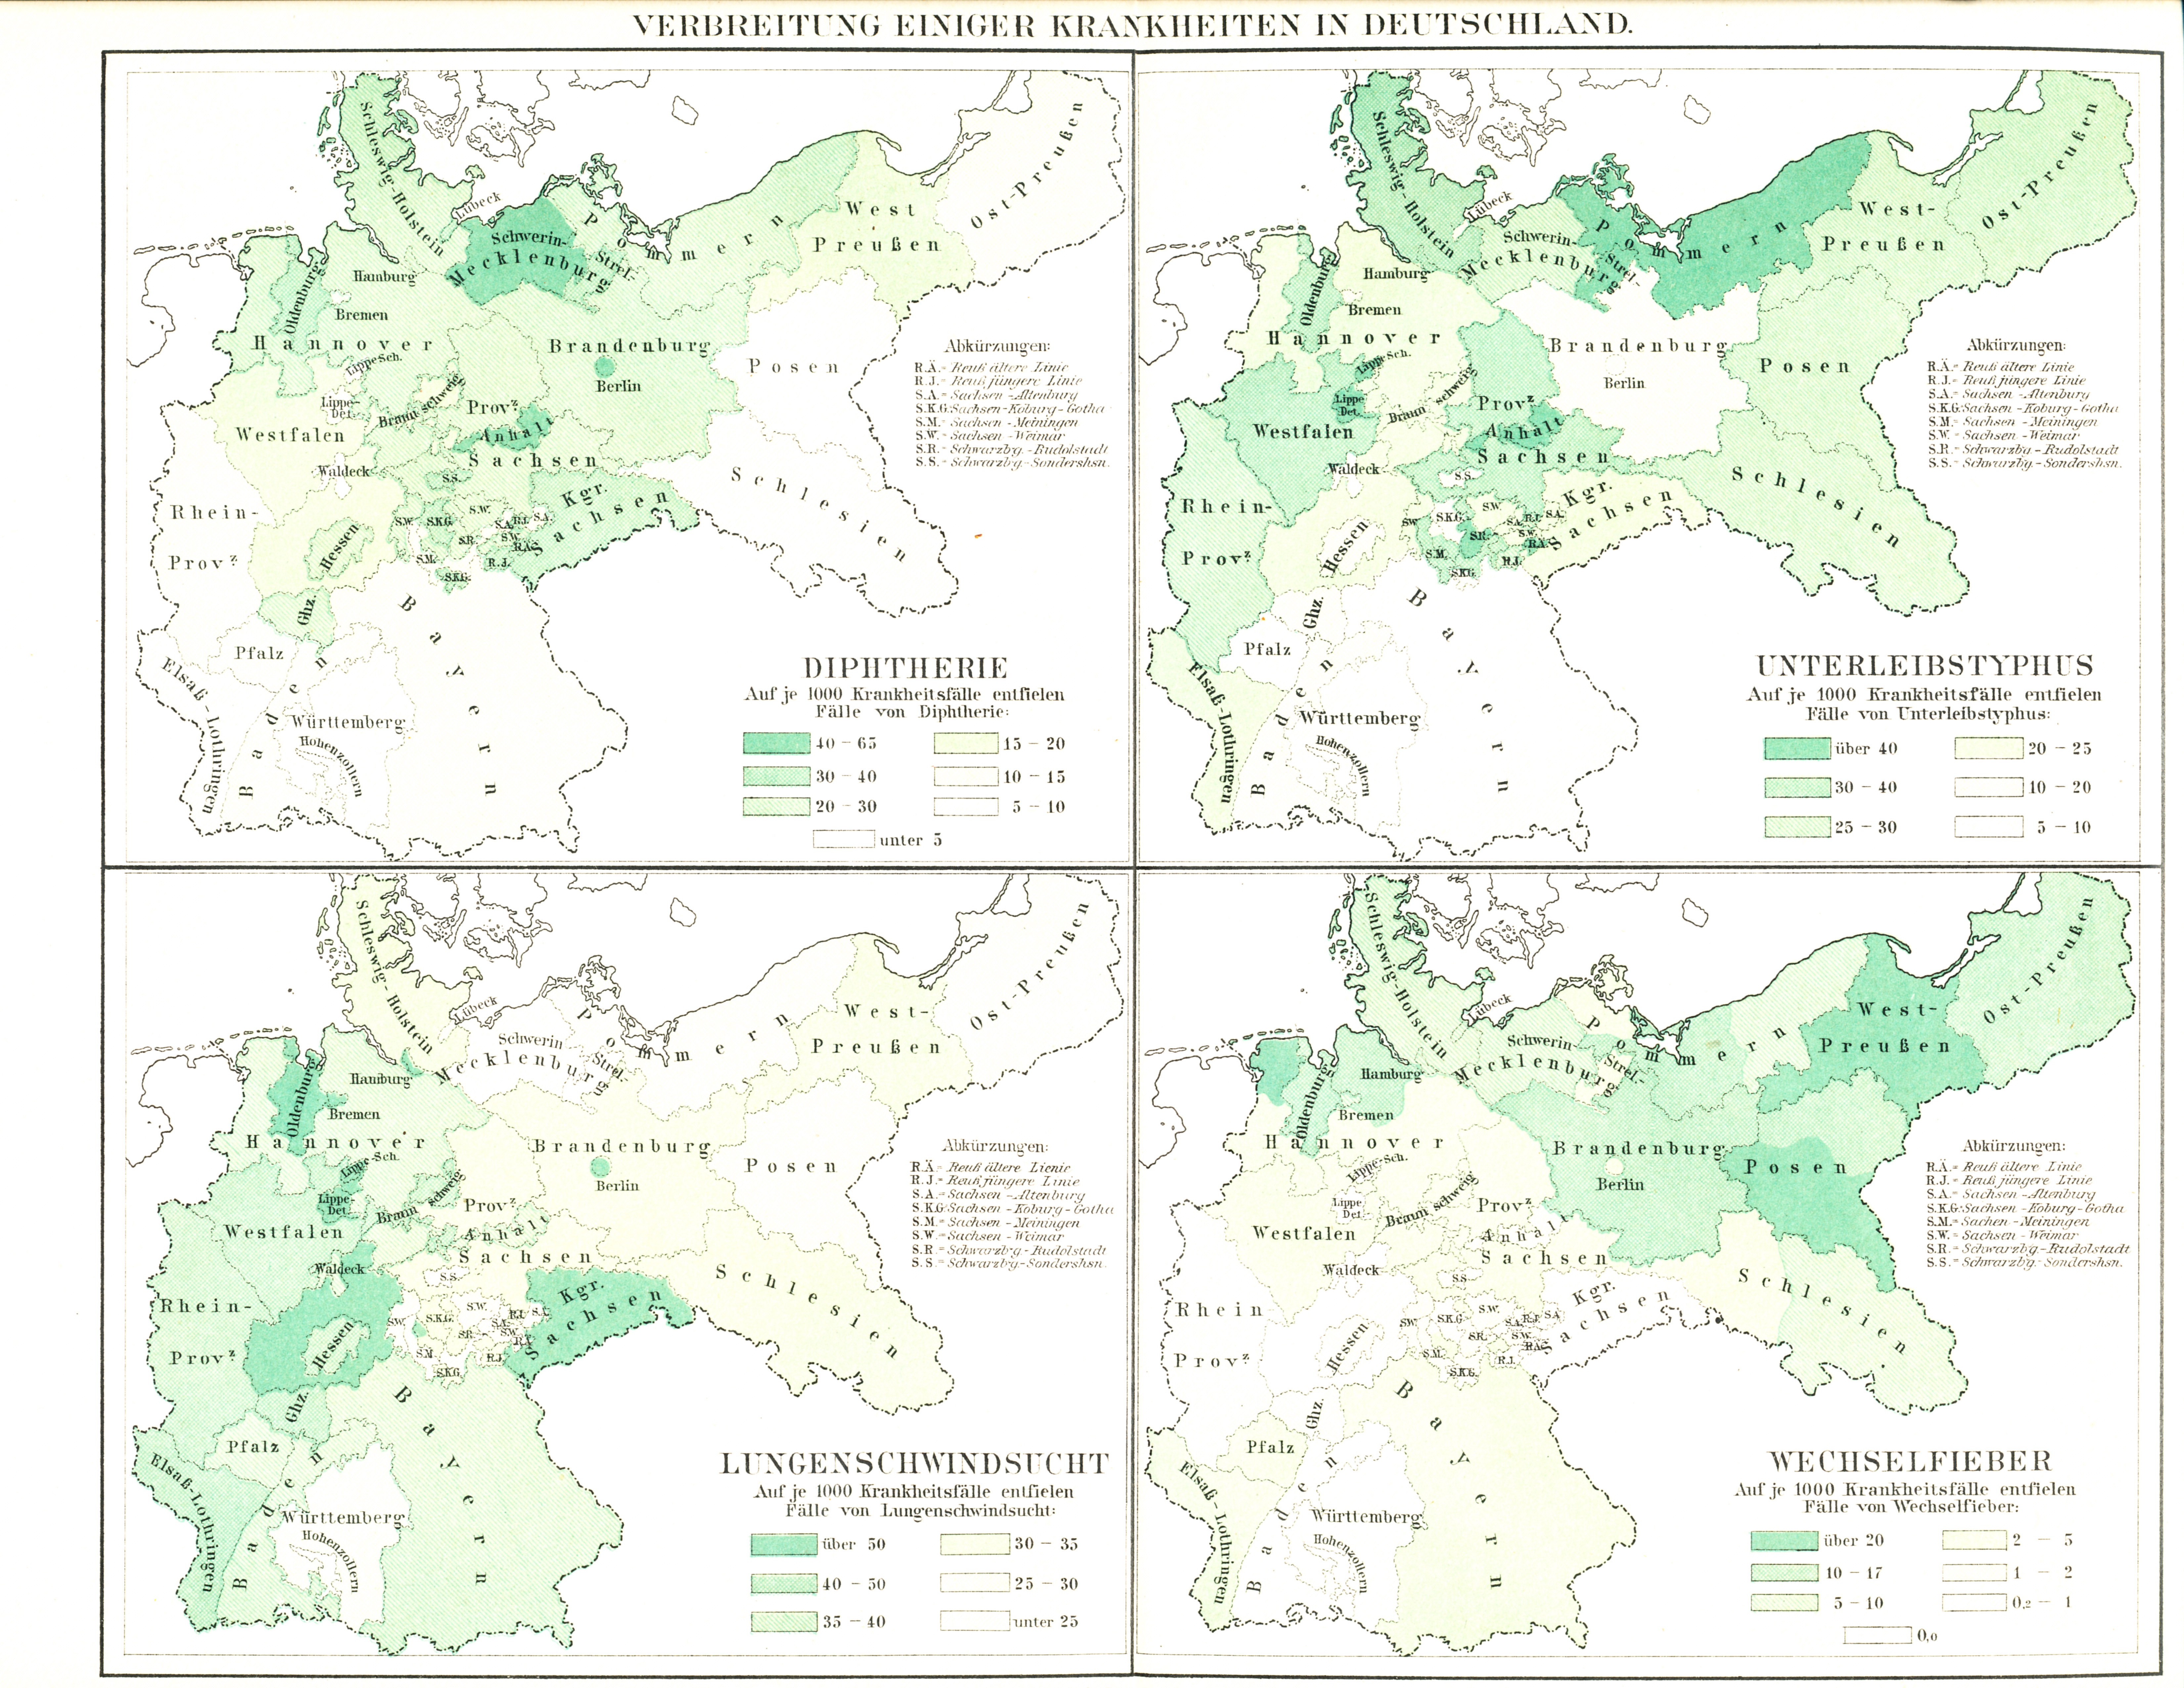
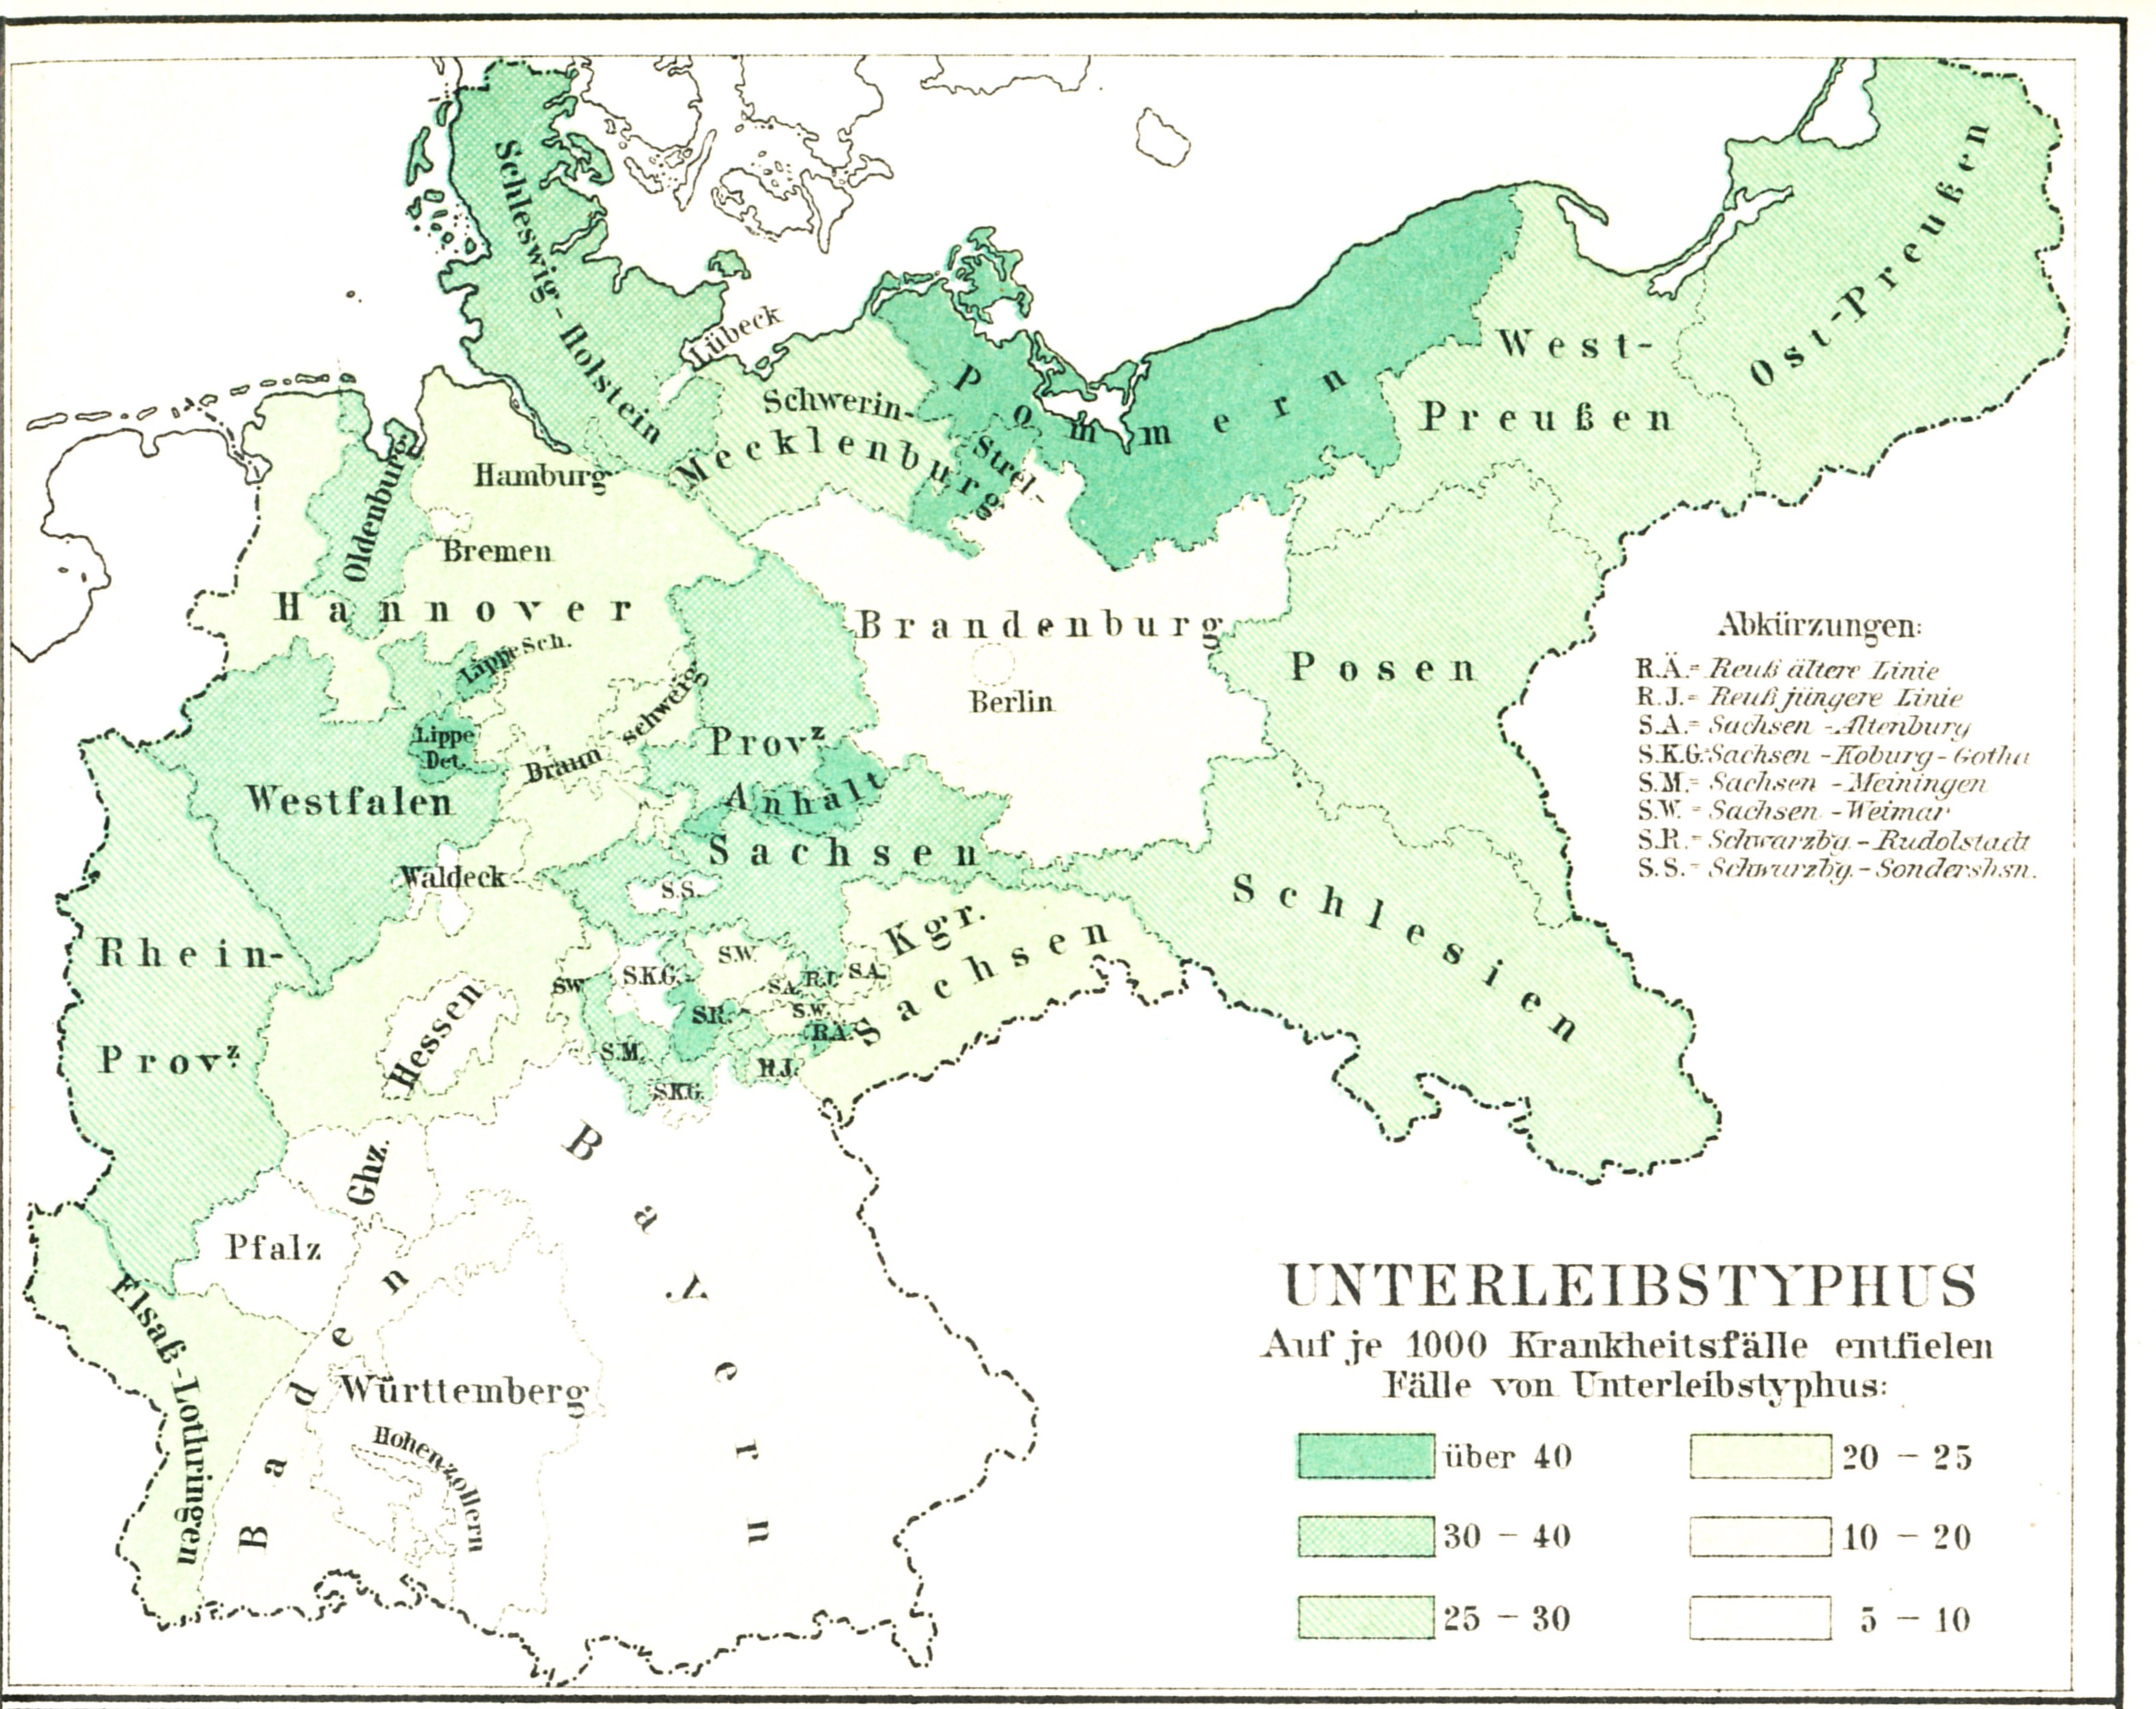
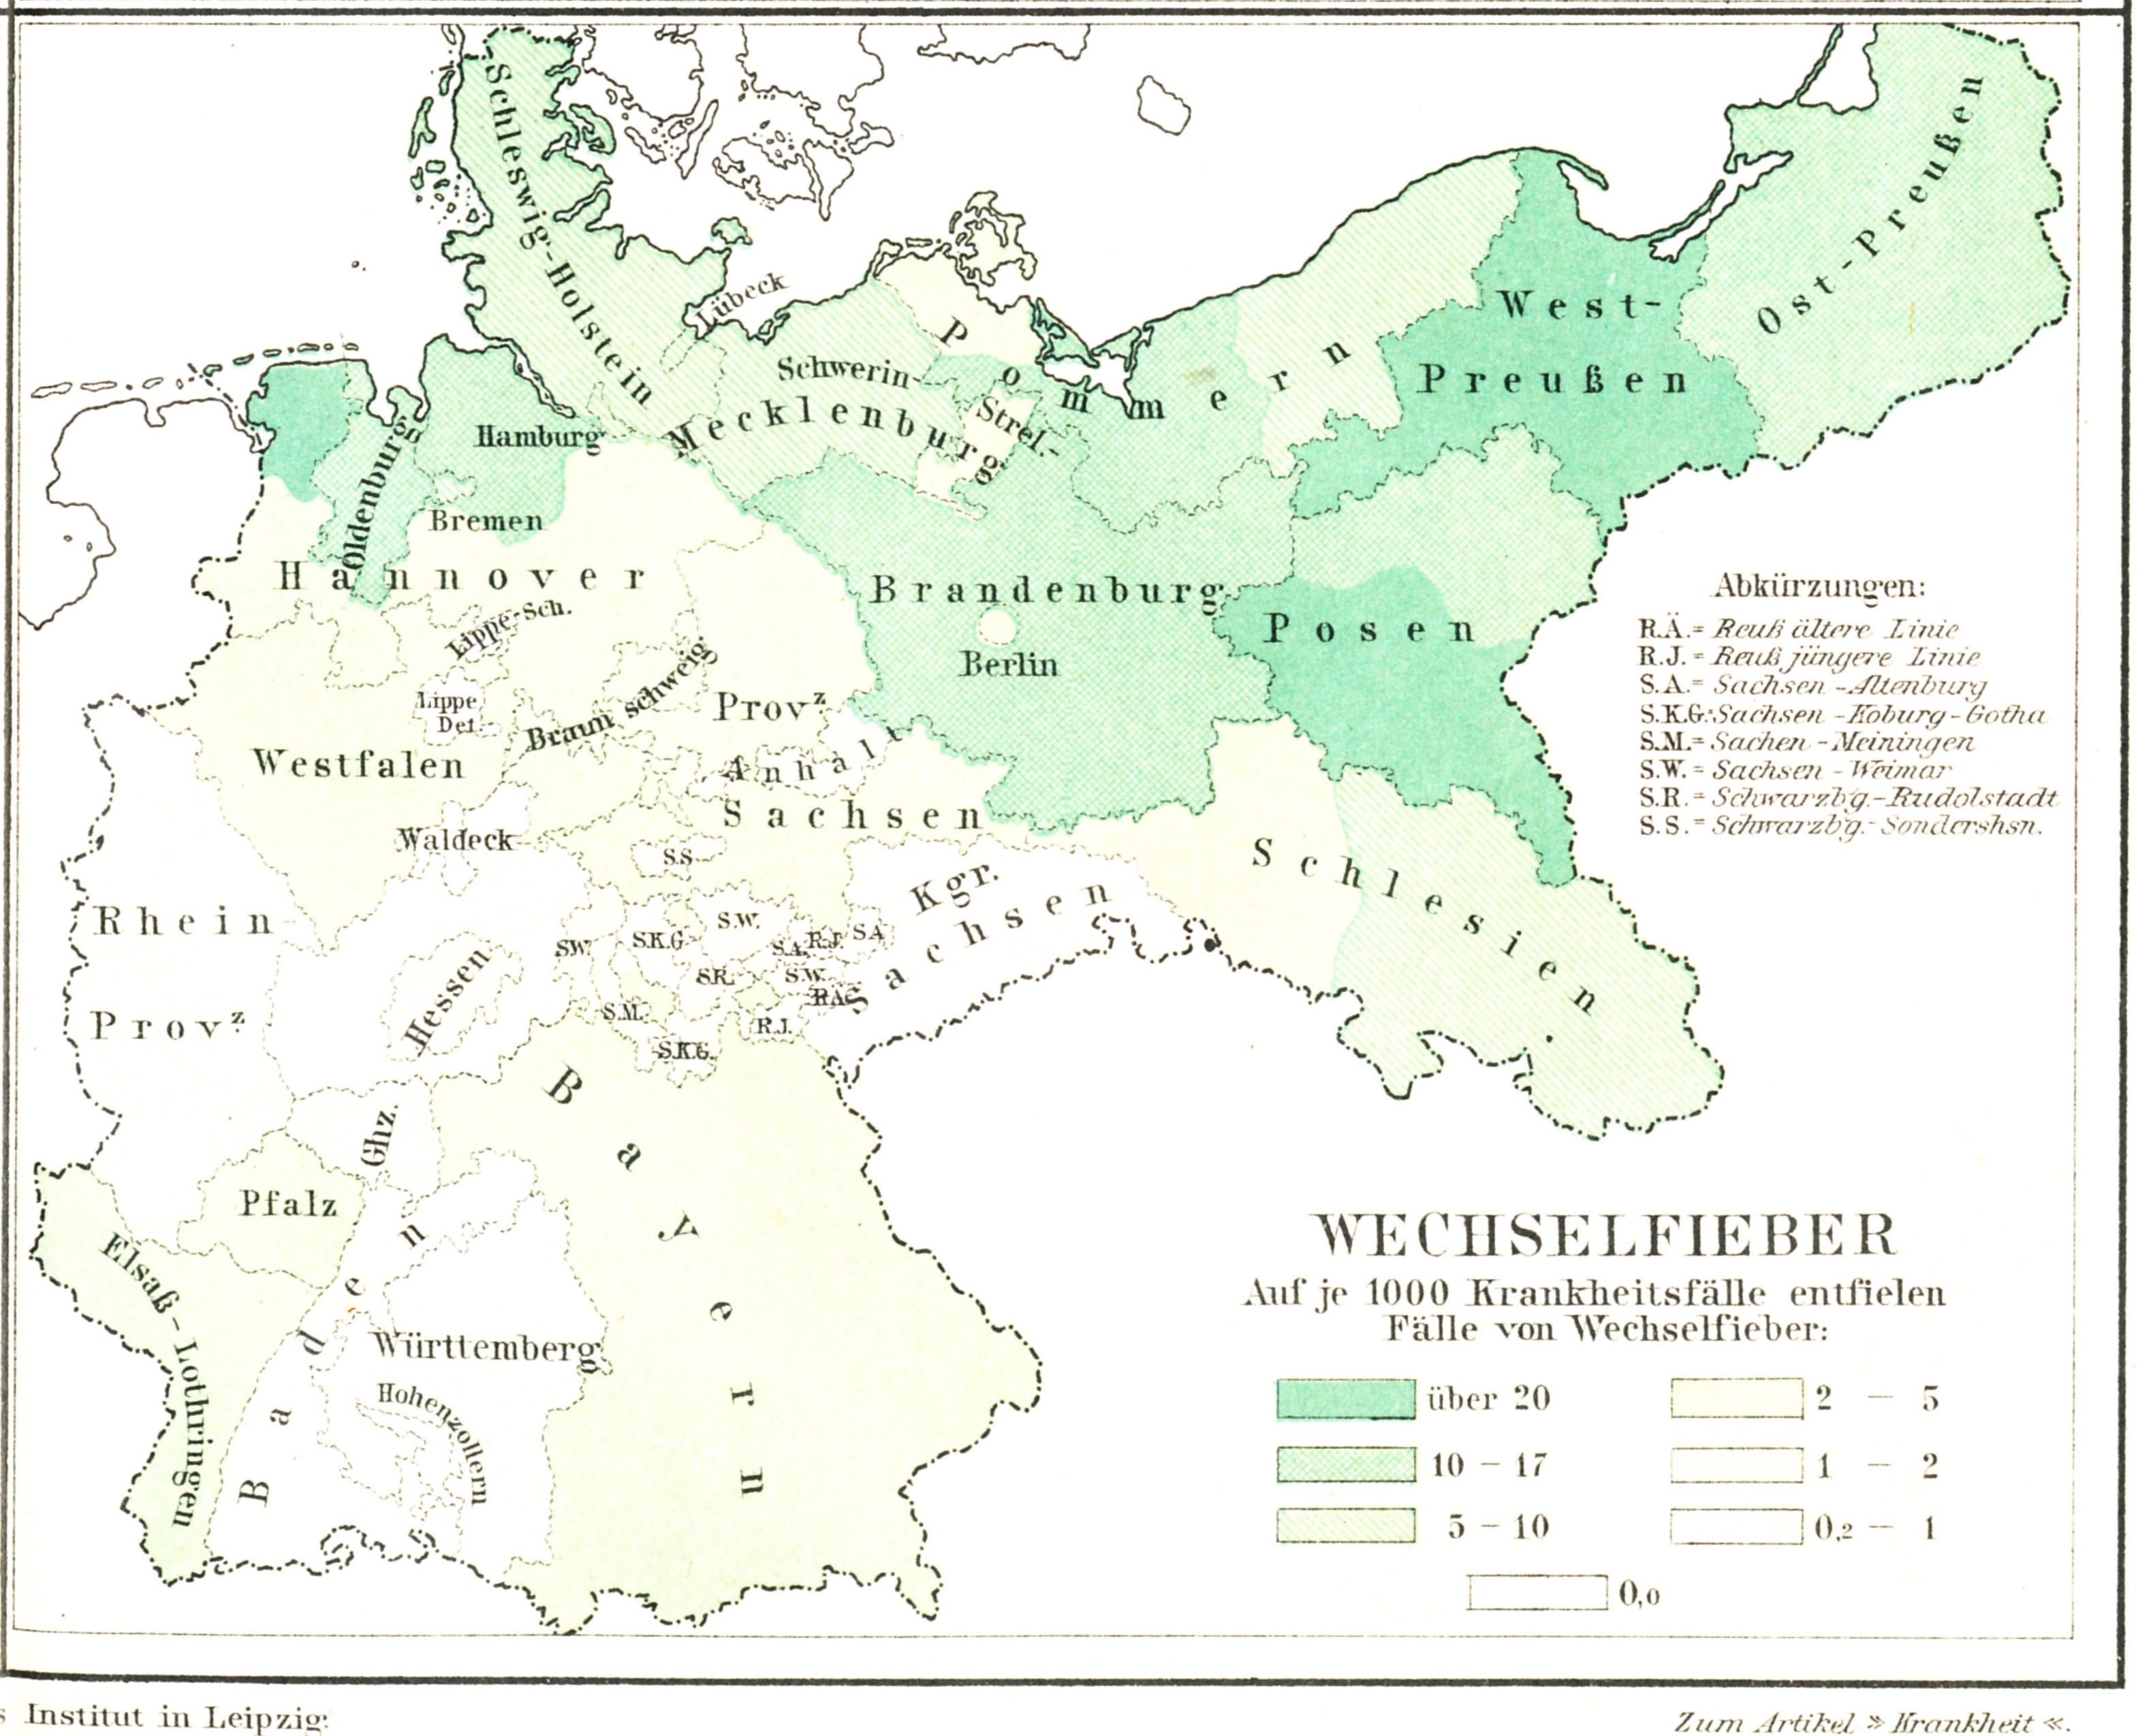
1880, approx.. Four Prussian Diseases (ca. 1880). Full Page. Map Collage. Individual diseases reviewed separately on this page: Diphtherie (diphtheria), Unterleibstyphus (typhus/typhoid), Lungenschwindsucht (tuberculosis), Wechselfieber (malaria). [1-4-7-12]
1880. Central Mexico Disease Geography (ca. 1880). Full Page. Regional Map. Original jpg appears multiple times on this page. [1-0-6-7]
1885.
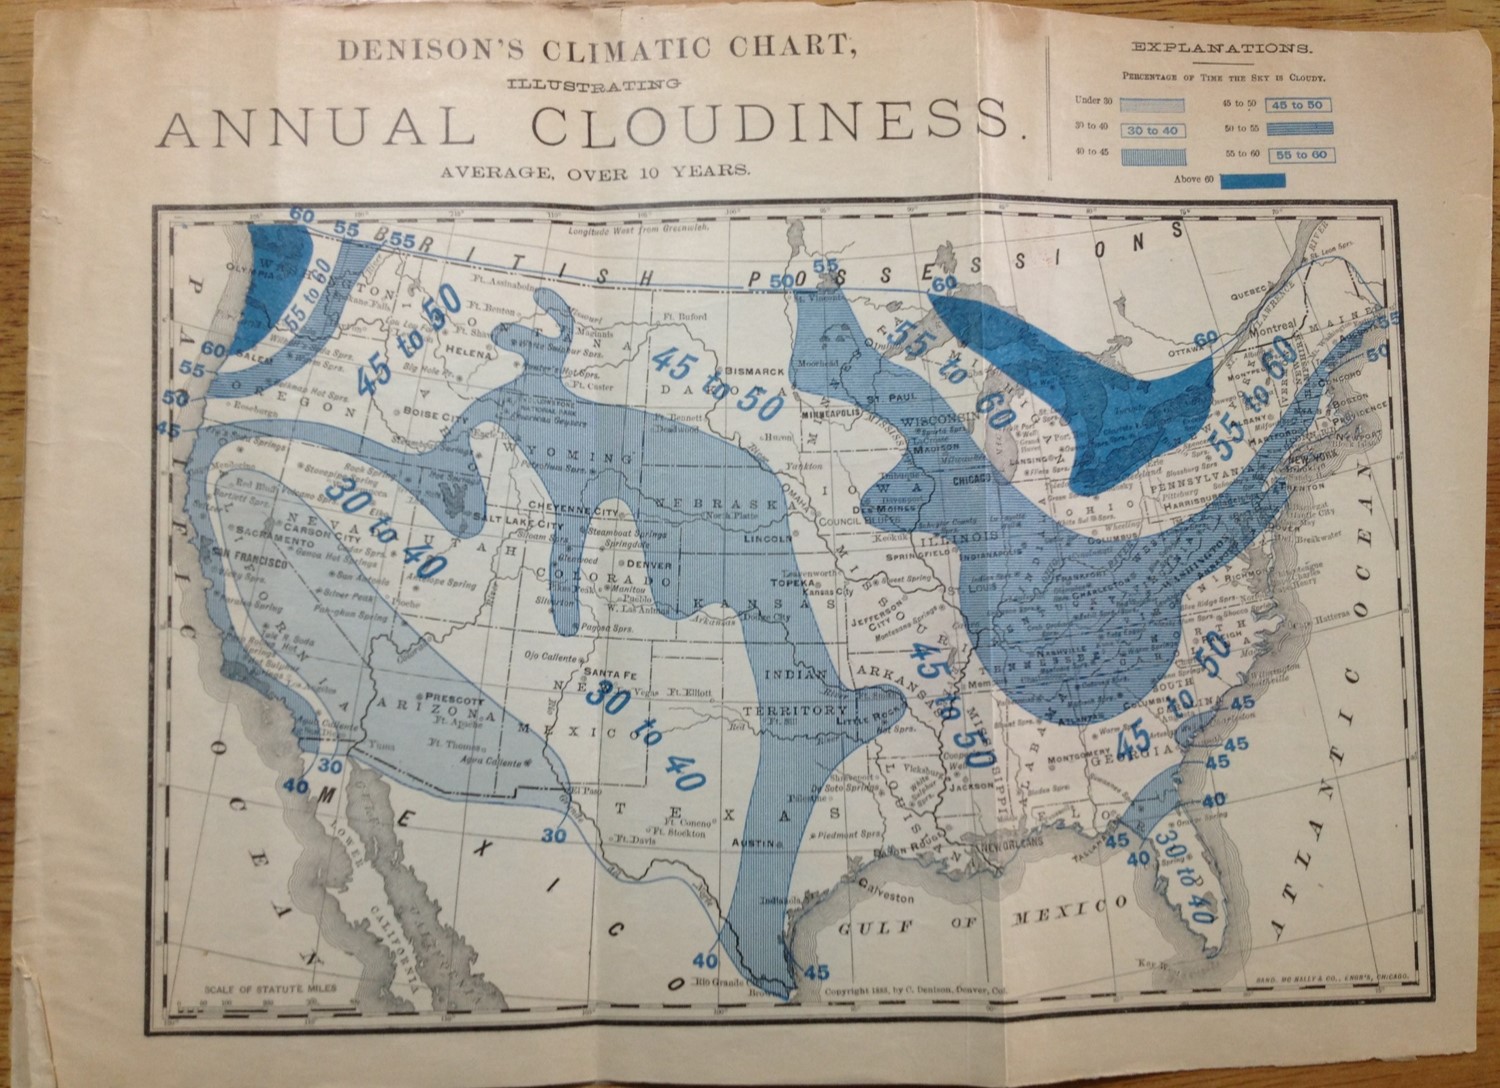
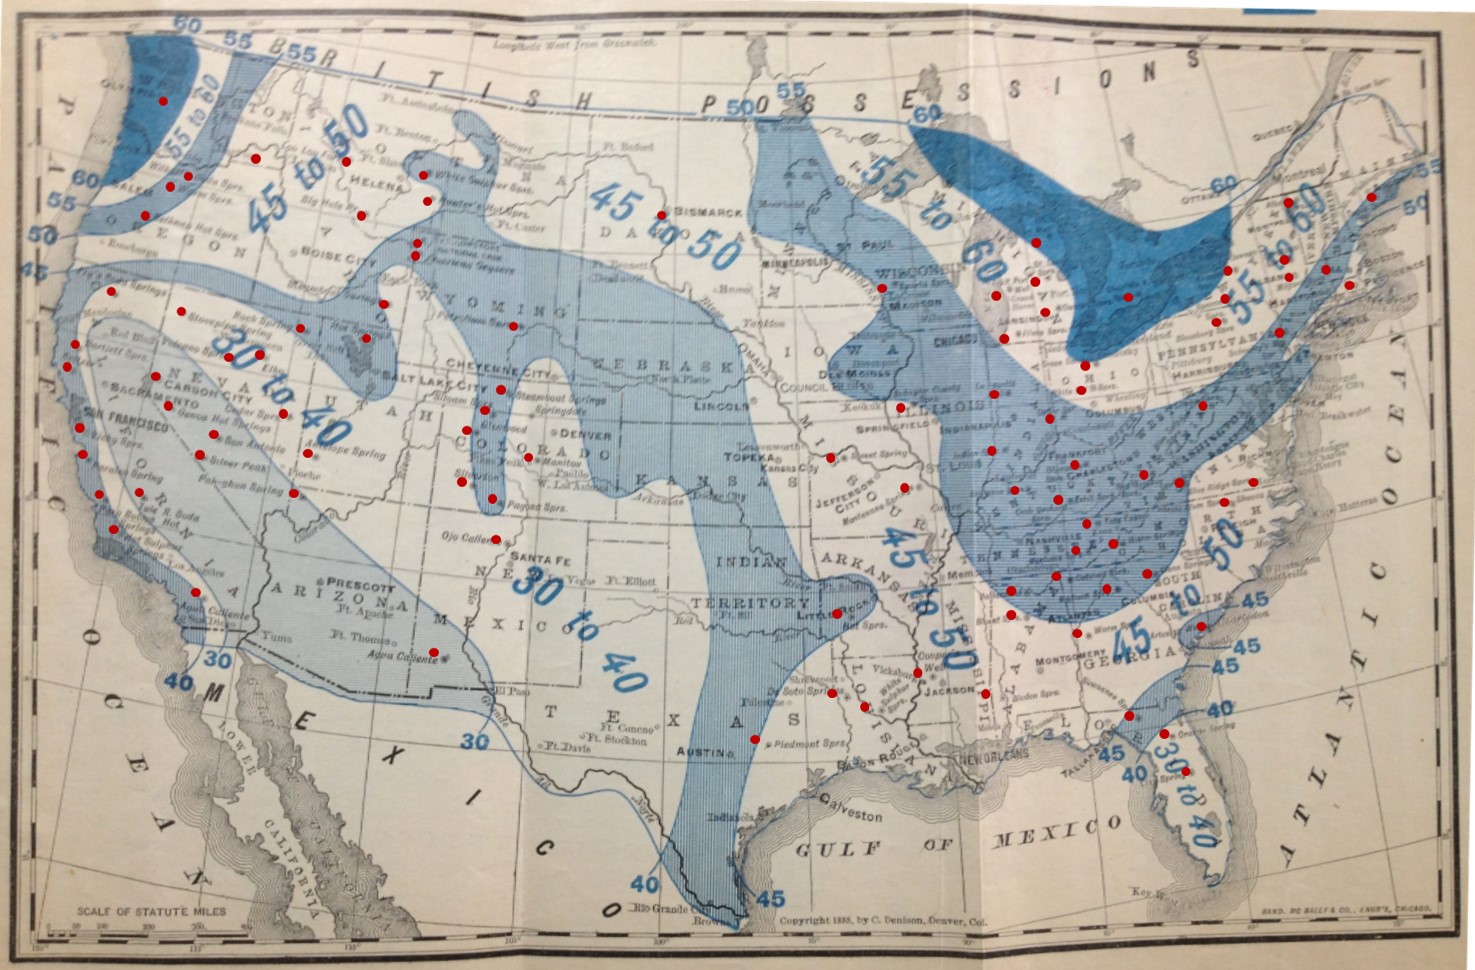
1887. Charles Denison – Phthisis, Climate and Mountain Air (1887). Full Page. Regional Temperature Differences-Diathermy. Regional Cloudiness-Diaphaneity. Primary theme is regional climate, topography and health. The points indicating town or cities with a focus on Medicinal Waters/Springs and Topography or Climate were hard to decipher on Denison’s maps, and so were manually accentuated for: Diathermy-Springs, Diaphaneity-Springs. A contemporary image of cloudy days was used for comparison with Denison’s Diaphaneity map. Maps were compared by manually tracing and overlap methods. The two maps produced by Denison used the same basemap, but had some very slight deviations due to the printing process and my photography of these irregularly printed, folded and creased map folios. (This entire document, a pamphlet, is oxidized, brittle and extremely fragile.) [2-24-1-27]
.
[To be continued . . . A WORK IN PROGRESS]
1890-1899
.
1900-1920
.
1921-1940
1941-1960
1961-1980
1980-1989
1990-1994
1995-1999
2000-2004
2005-2009
2010-present
