A Work in Process
For the various studies and measures of performance required of various insurance programs, HEDIS and NCQA have a way of defining regions of the United States. These regions, it is proposed, have related or shared results.
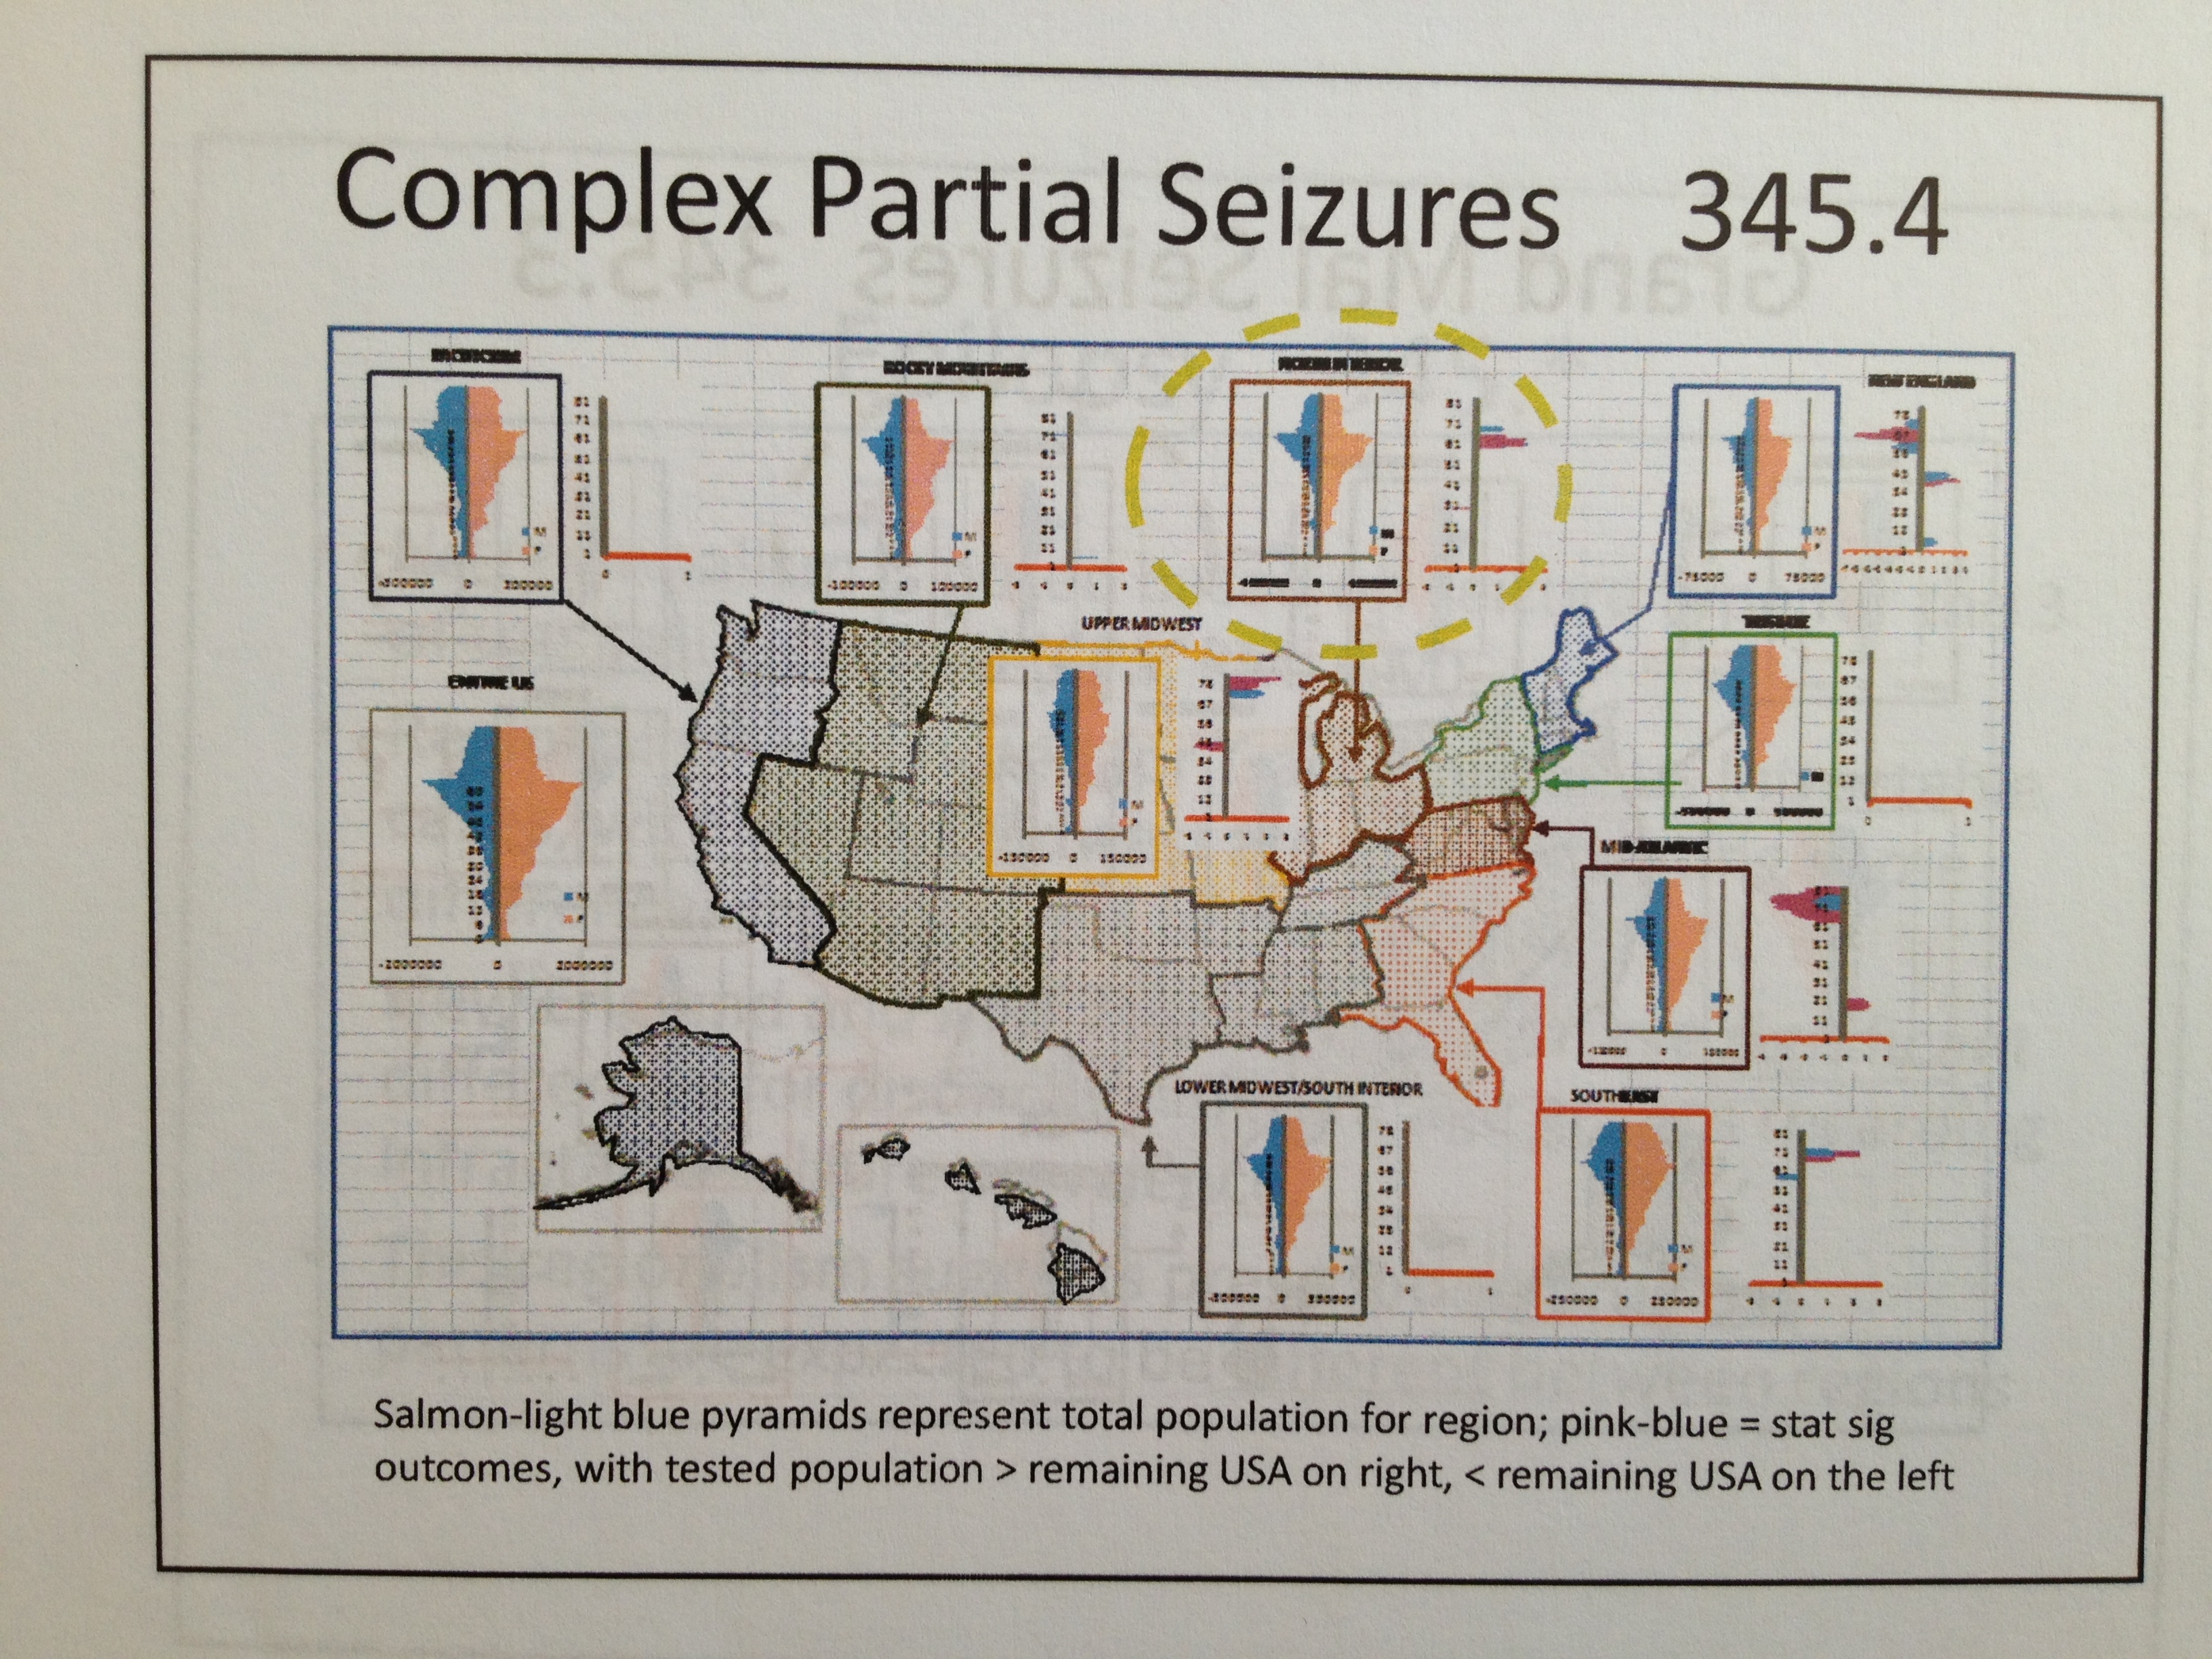
Both HEDIS and NCQA define about 9 or 10 regions of the country. Due to the nature of each of these regions and by observing their outcomes for various geographic subgroups (i.e. N vs. S, E vs. W), it was determined that 15 regions better define the subgroup behaviors observed for the data used in this analysis.
For example, using this methodology, it was found that the HEDIS-NCQA definition of regions leaves the western states lumped together too much. Economically, California is significantly different from Oregon, although hybridization of the two in recent years has reduced this social inequity somewhat.
The same can be stated for other parts of the United States as well. Northern versus southern Rocky Mountain are also not identical in terms of the public health perspective. Stating that Texas is identical to Louisiana demonstrates an insensitivity to the cultural uniqueness of both. Finally, even the northern plains states are not easy to lump into a single group. If north versus southern portions of the northern plains are compared, there are significant differences for certain age ranges. The same truth exists for east versus west for the northern plains states.
Therefore, to perform this regional analysis, each region selected was measured on its own, including the use of the subgroups defined above, and then the data for each region compared against data for the rest of the country, not the rest of the country including the region being evaluated. Most studies of regions test the regions against national averages, which include the regions being compared. This eliminates this overlapping of results and making for a more sensitive formula to use whenever you wish to engage in accurate regional analyses
In the initial phase of this work, approximately 160 ICDs were tested. Each ICD was tested for 12-16 regions, depending on the outcomes and state of testing this analytic process was undergoing.
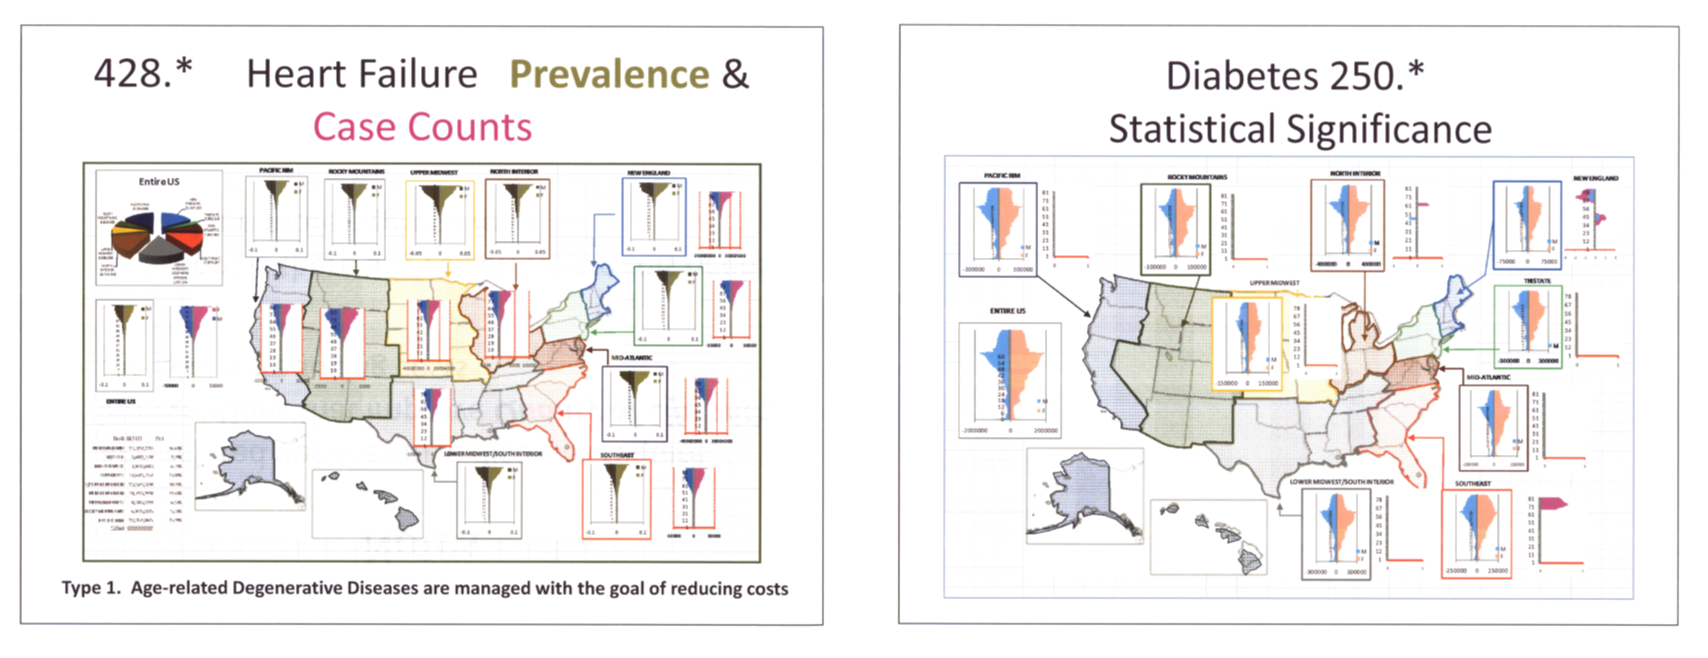
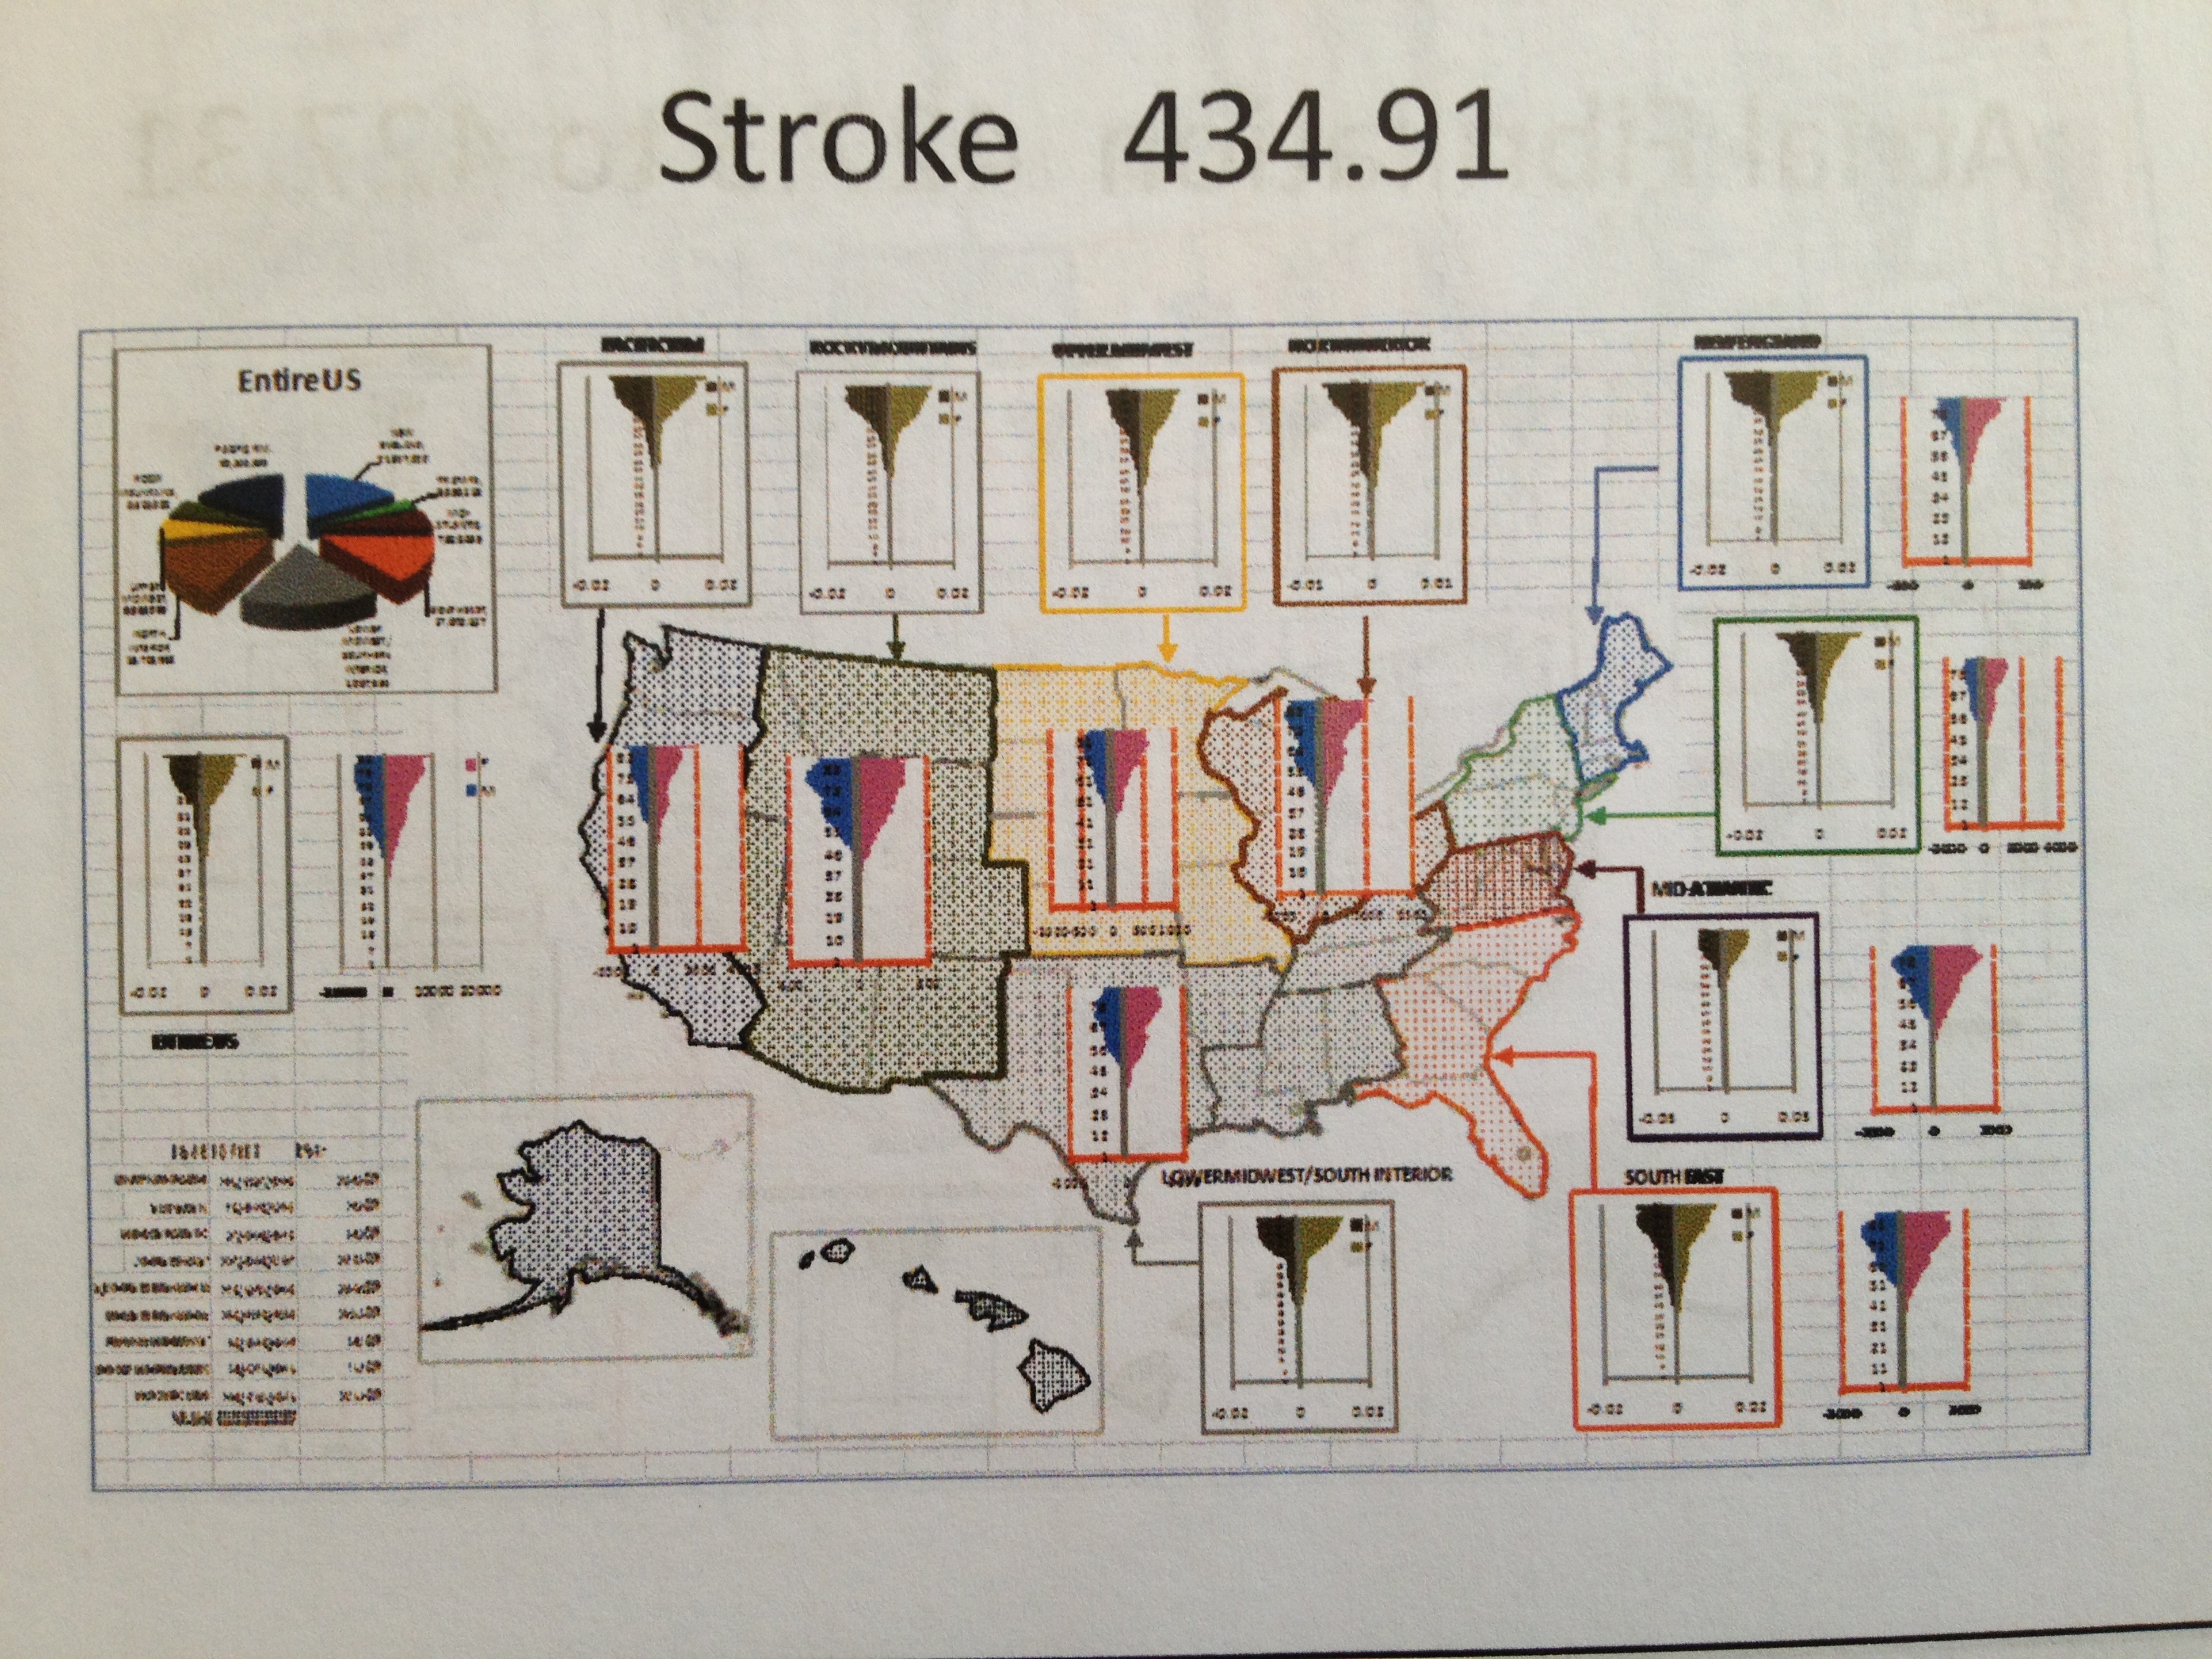
The ICDs chosen for this review included the most important ICDs such as those for various chronic diseases and high cost medical conditions often requiring expensive surgical care and follow ups. Examples of diseases reviewed this way include: Diabetes, Heart Failure, Asthma, Stroke, etc.
This study was carried out primarily with the goal of testing out the potential applications for the new formulas developed.
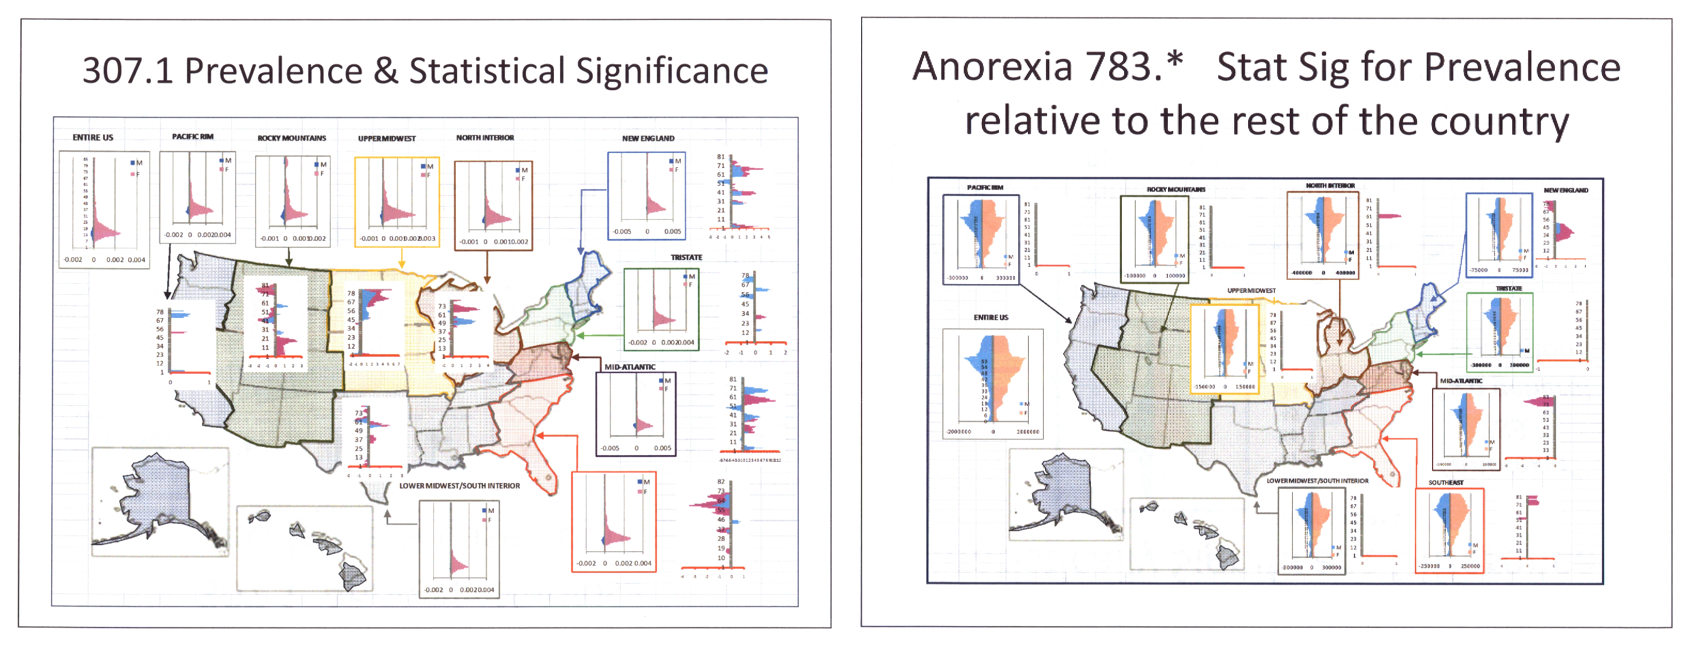
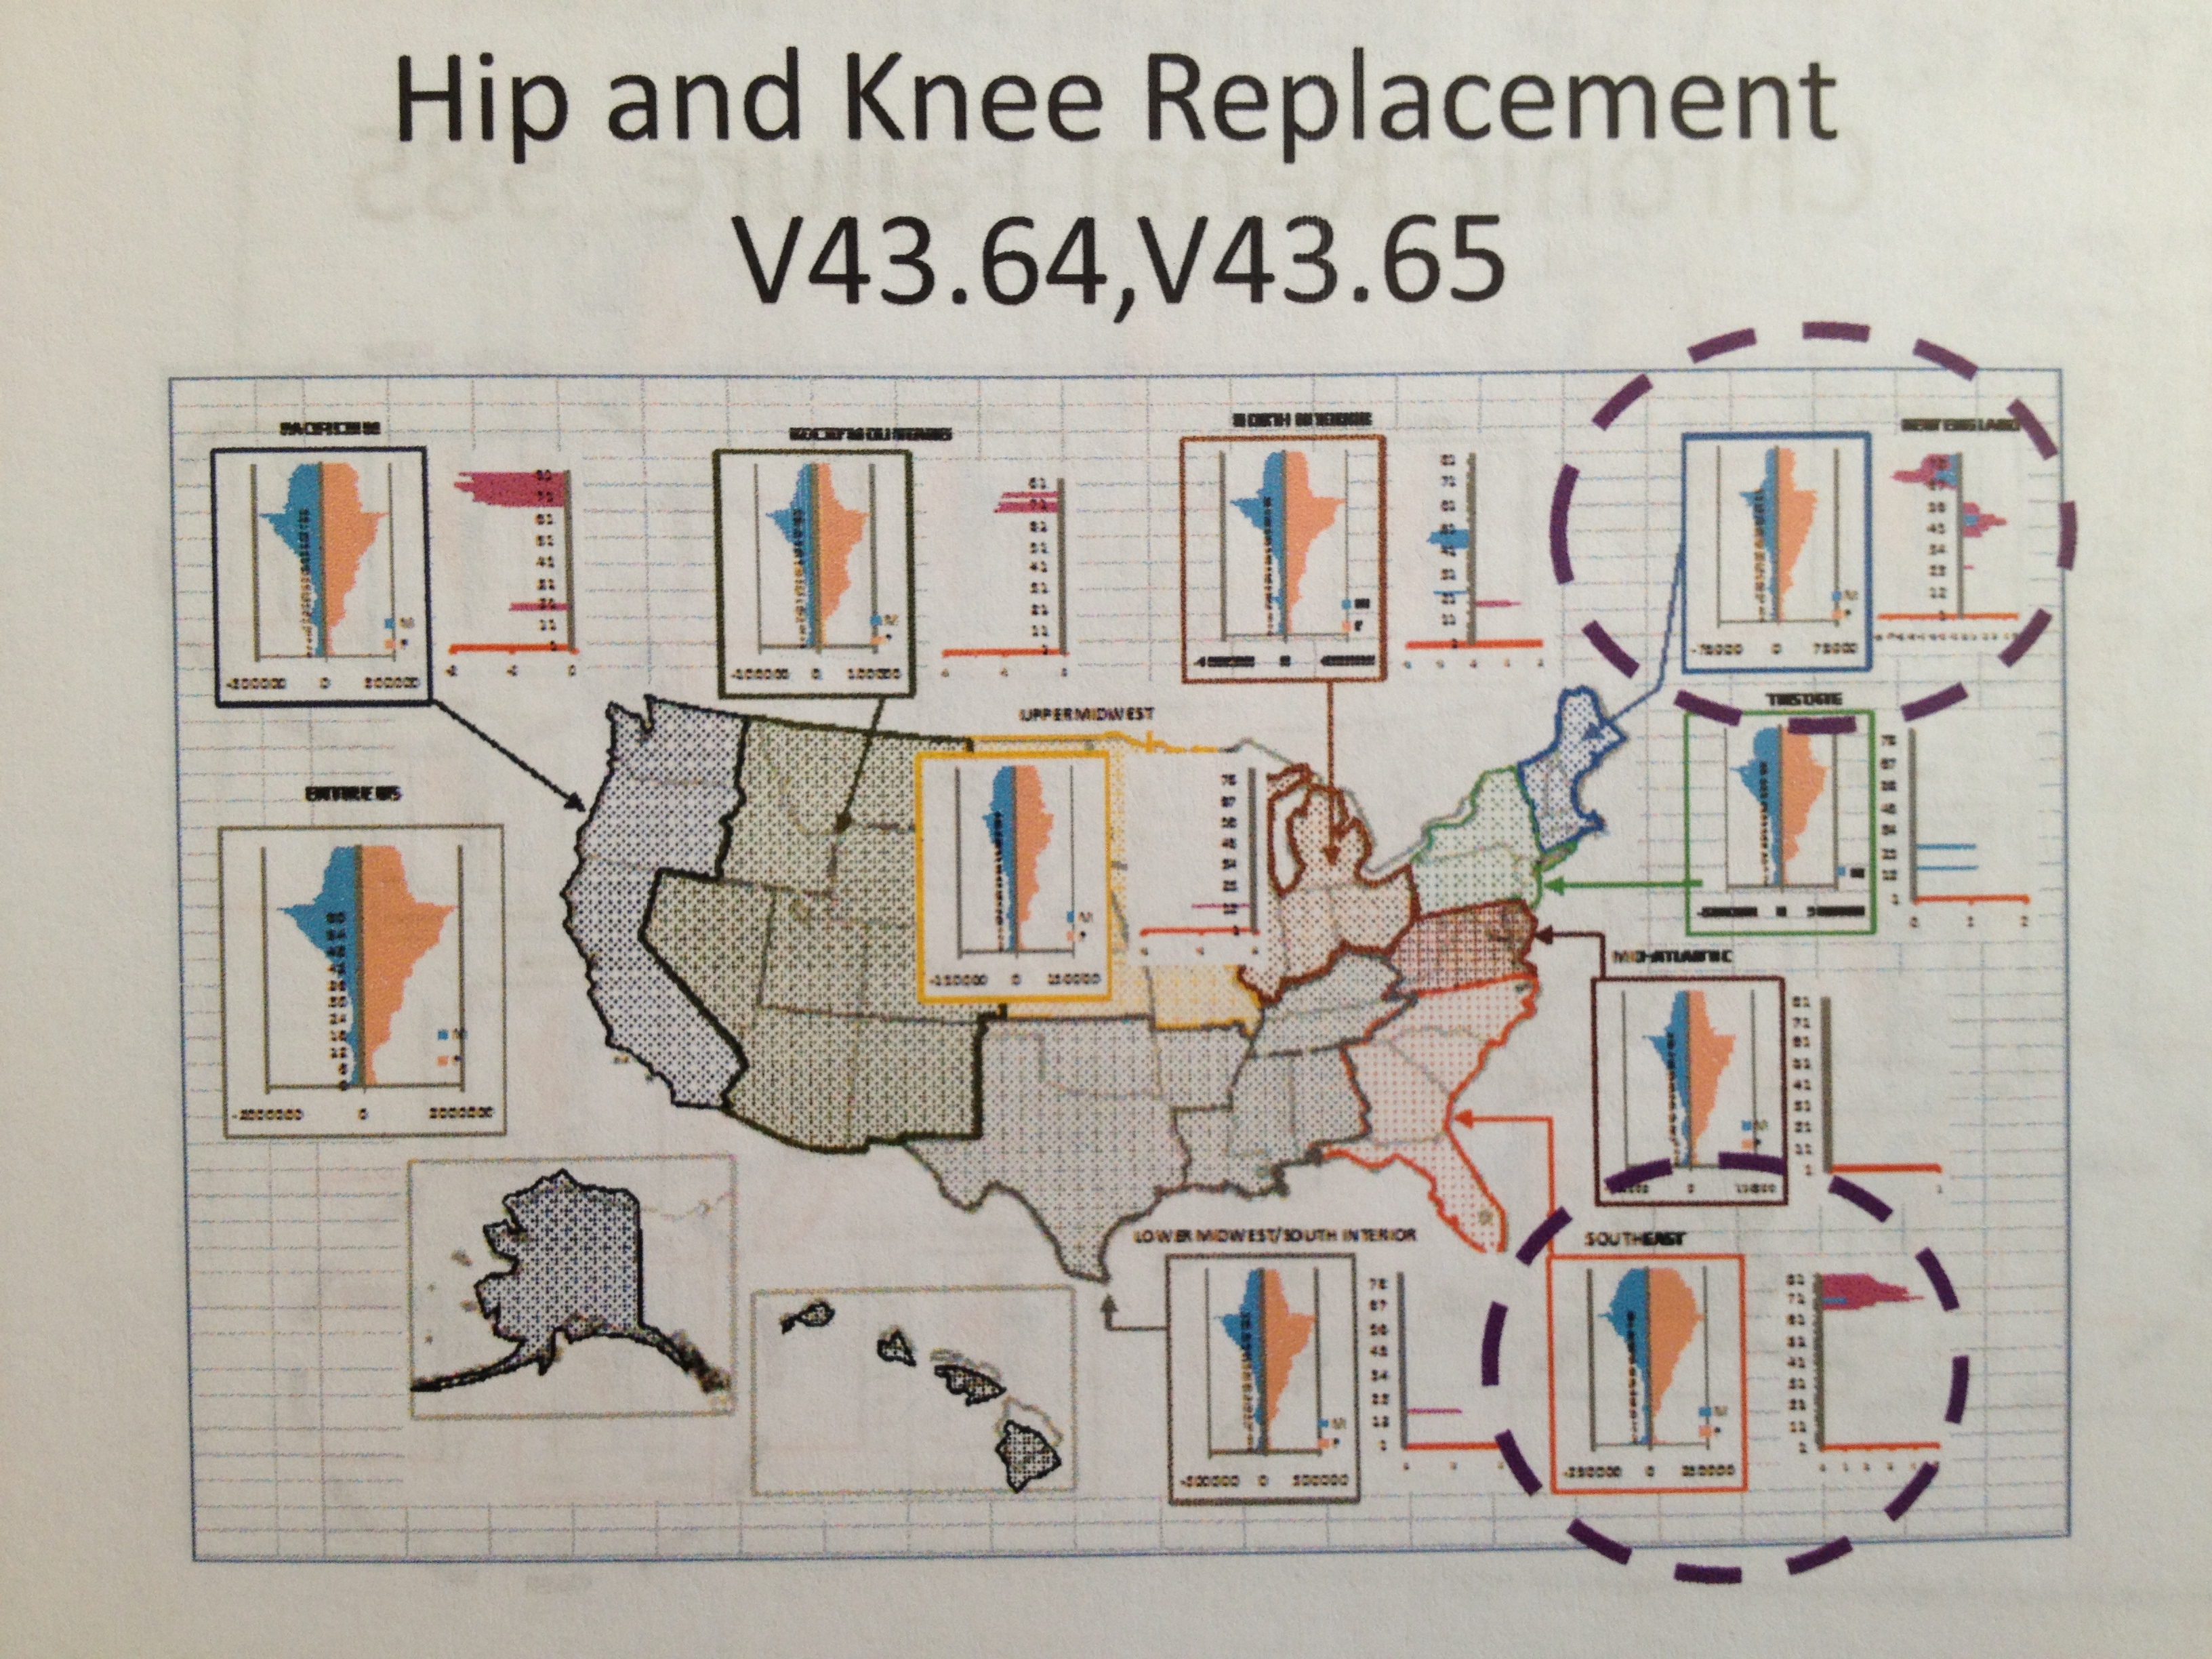
These formulas document age counts and incidence-prevalence as defined elsewhere on this site. I then added the statistical formula methodology developed for identifying where statistically significant differences exists at the 1-year age band level. This methodology was applied for all of these series.
The maps that were produced (to be added asap), for the most part, are self-explanatory. They demonstrate several regional features that exist in spite of the size of the region selected for this study. The most important regions to pay attention to are as follows. For each, the age-gender induced tendency is noted.
- Southeast – old age population related diseases highly prevelant
- Northeast (New England) – what we typically might consider old-age disease seen at or after retirement years is occuring at earlier ages in this section.
- Great Lakes – mother-child related disorders and conditions are most prevalent.
- Mid-Atlantic – mother-child related disorders and conditions are most prevalent, suggesting higher percentages of female spouse coverage and larger numbers of children per household.
Healthier regions could also be defined using this methodology. The Northwest (4 state region) was found to be an example of a healthier region.
.

.
.
.

.

.
DETAILED ASSESSMENTS
.
CHRONIC AGE-RELATED DISEASES
Ischemic Heart Disease

.

.
Stroke
.

.
Osteoarthritis

.

.
Hip and Knee Replacement

.
.
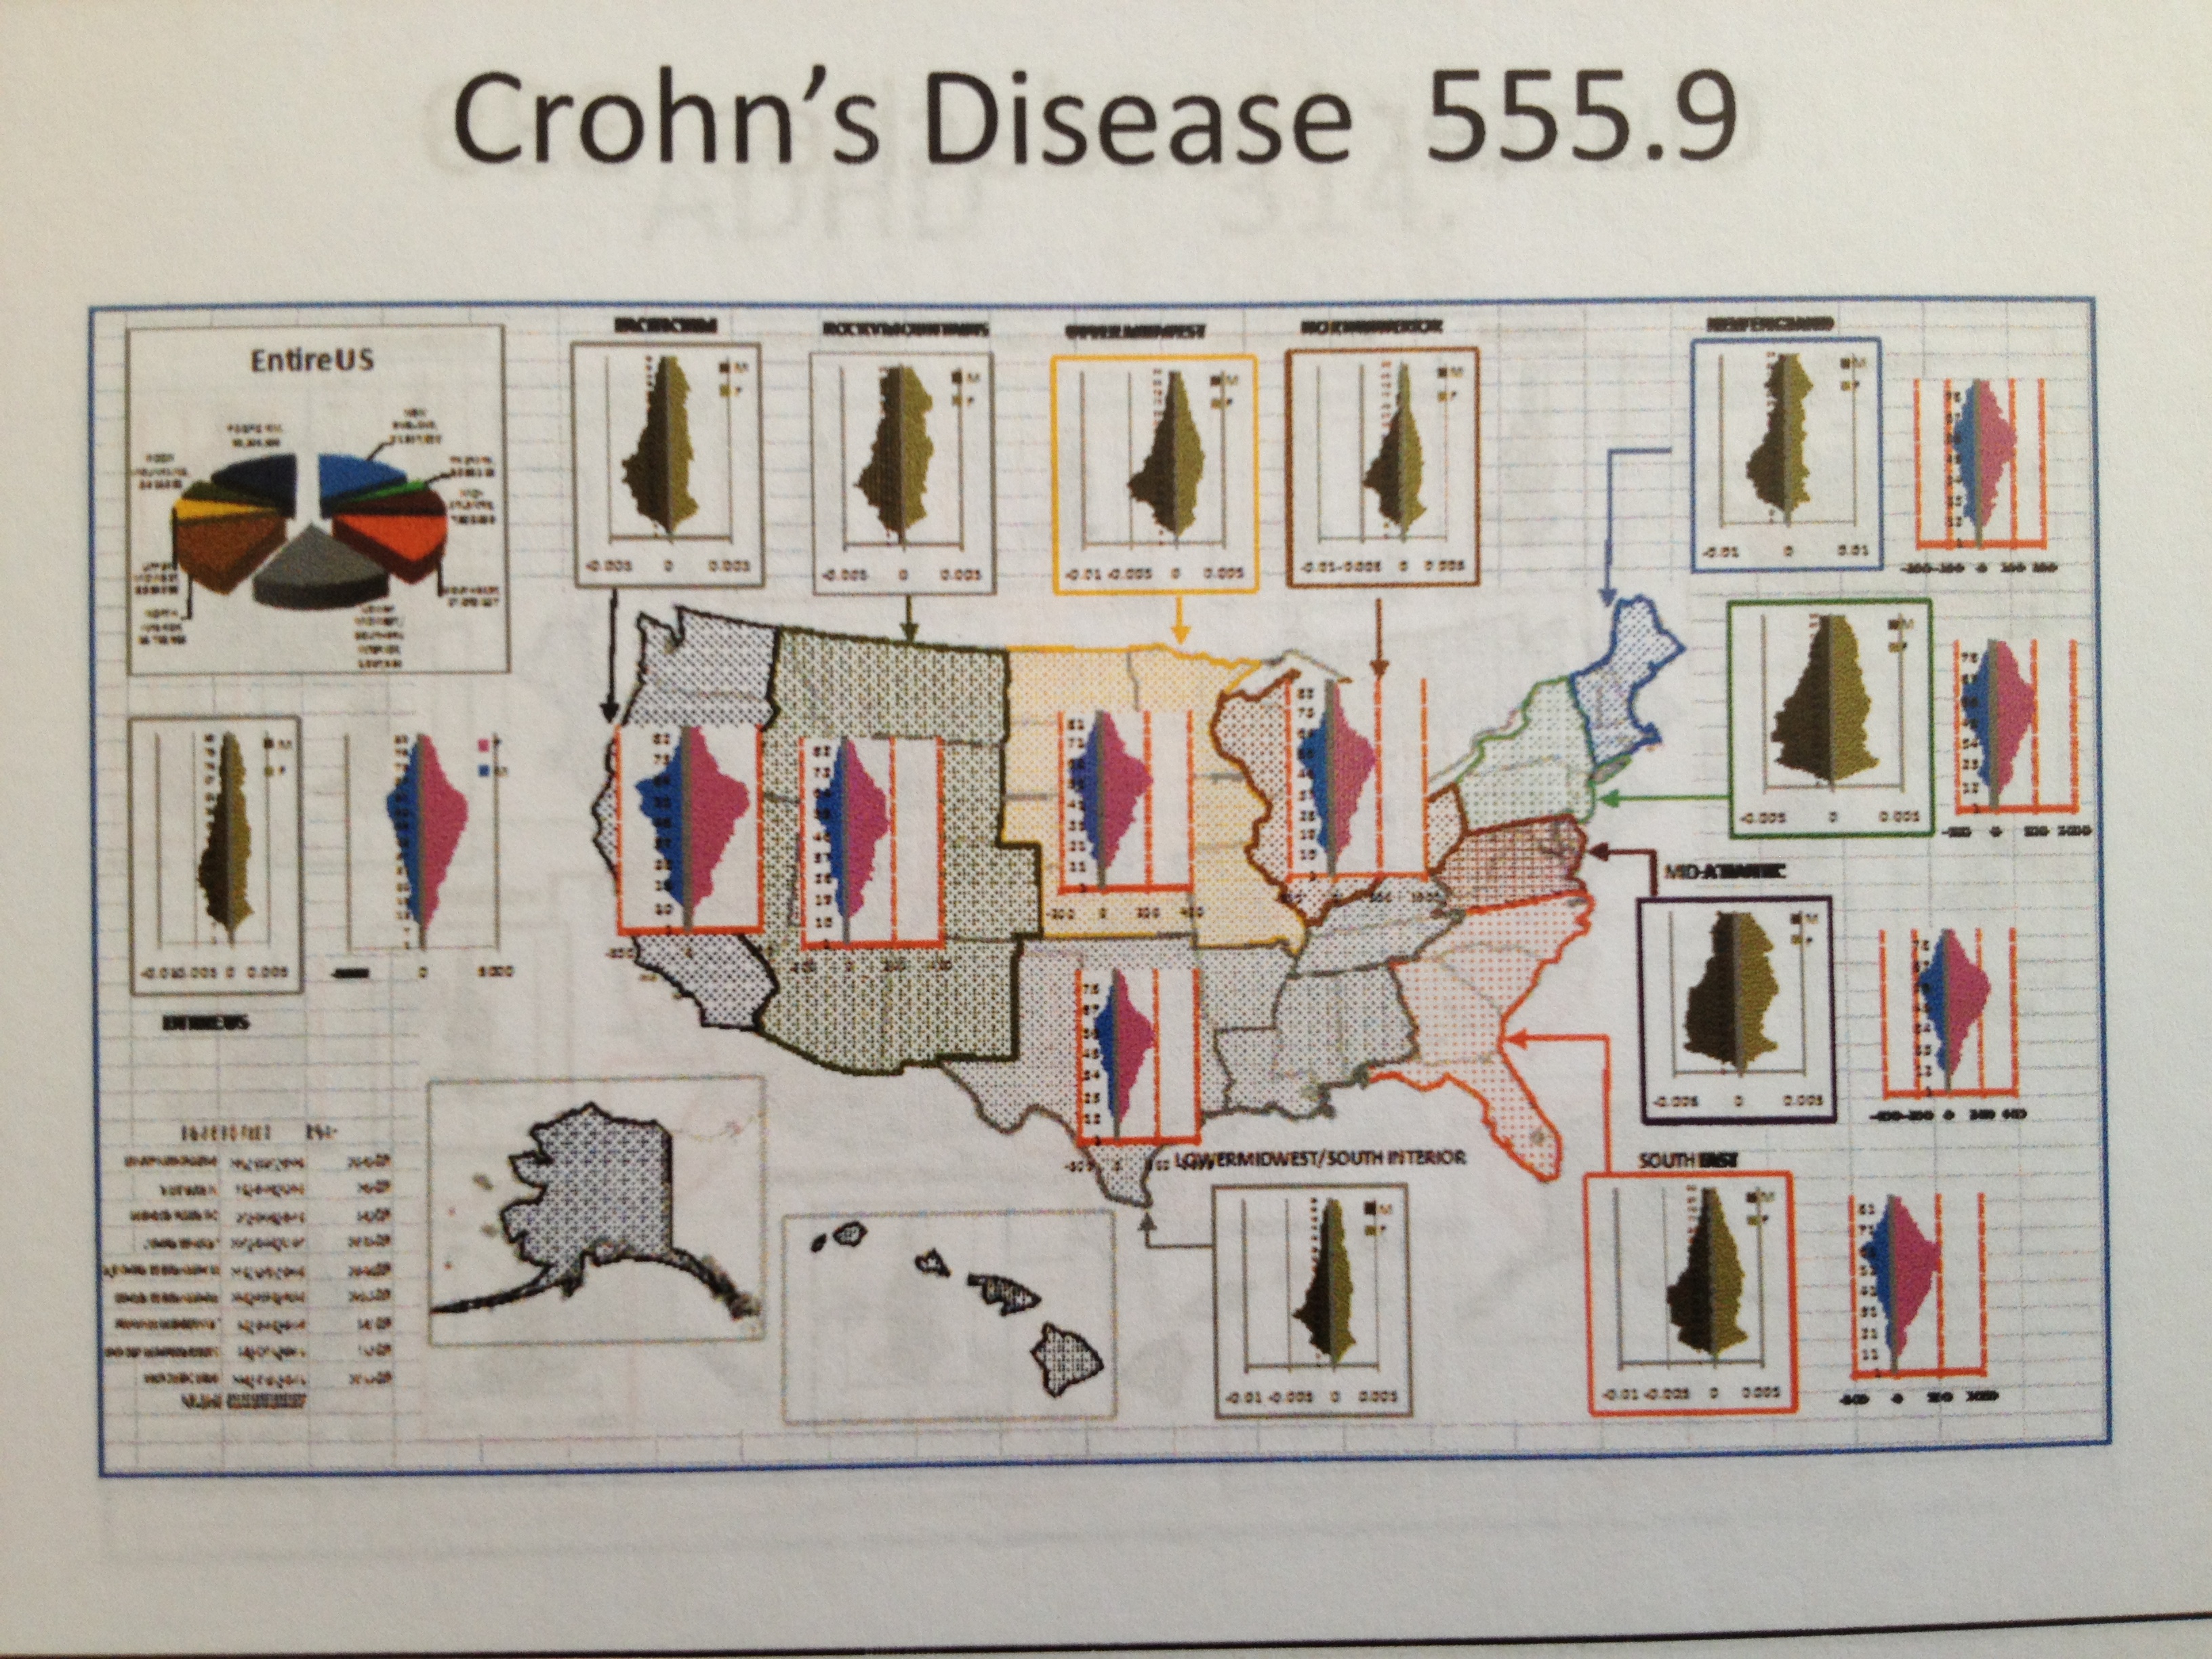
Crohn’s Disease
.

.
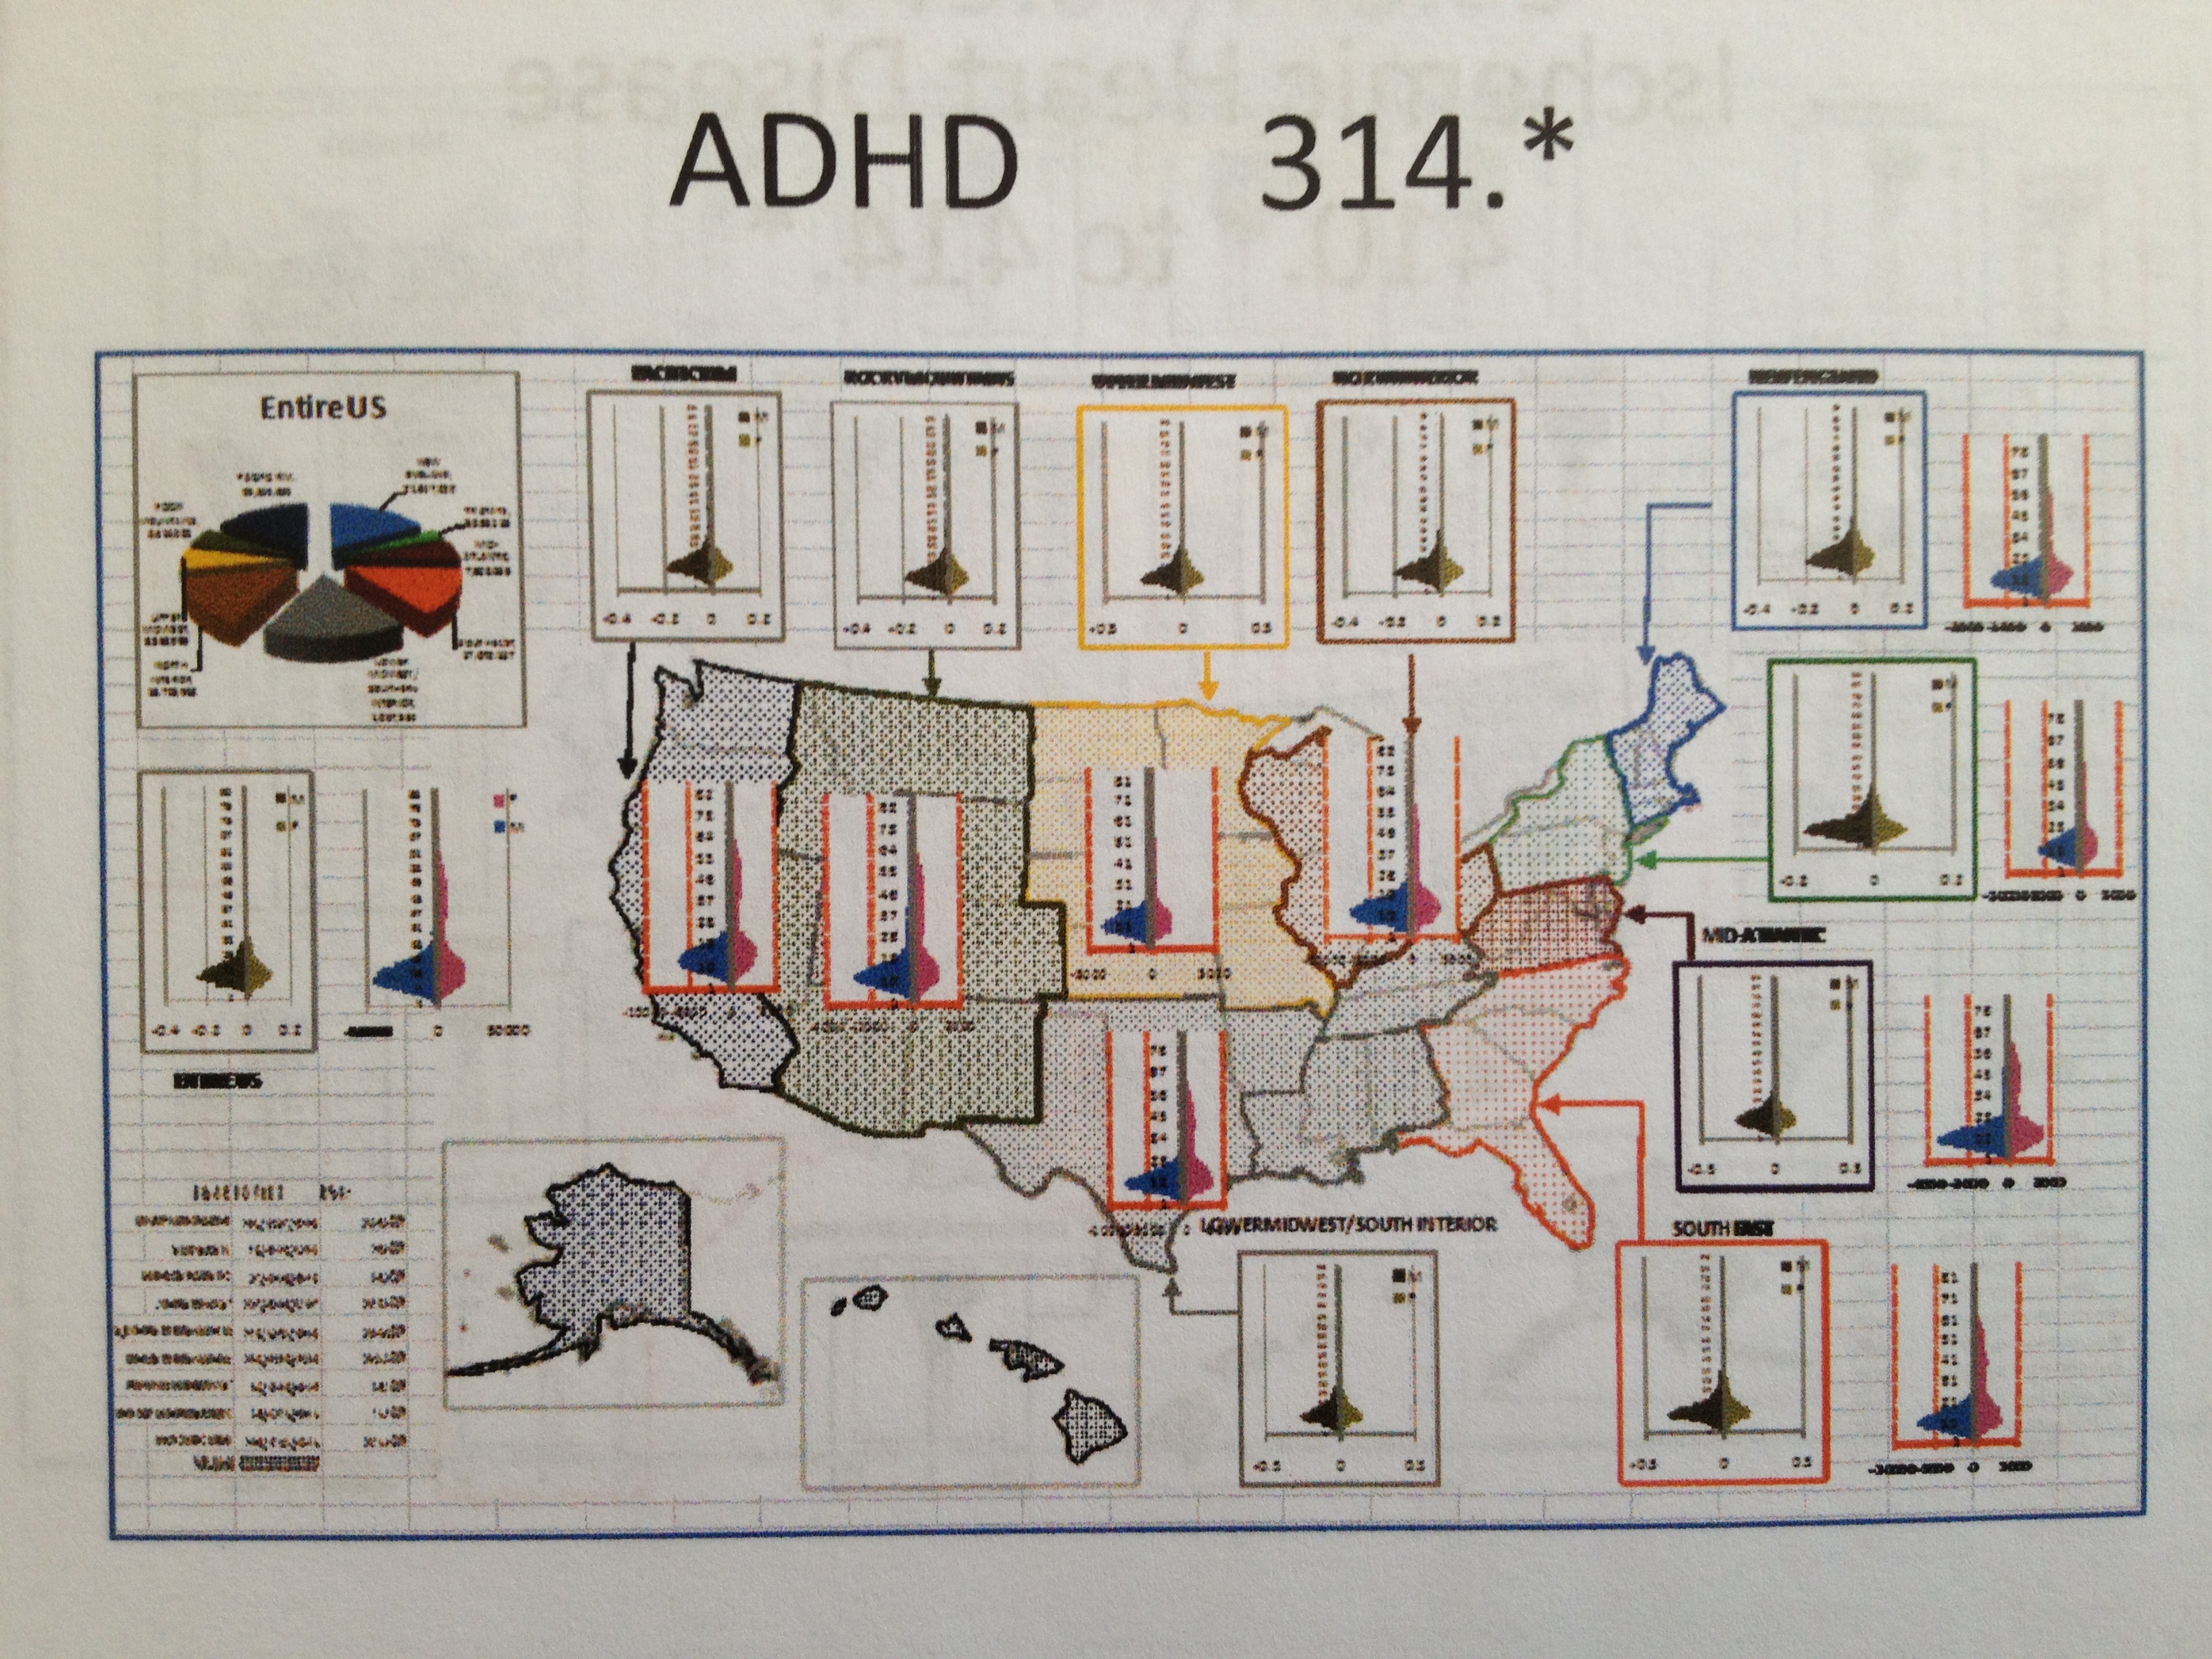
ADHD
.

.
BIPOLAR SYNDROME

.

.
.
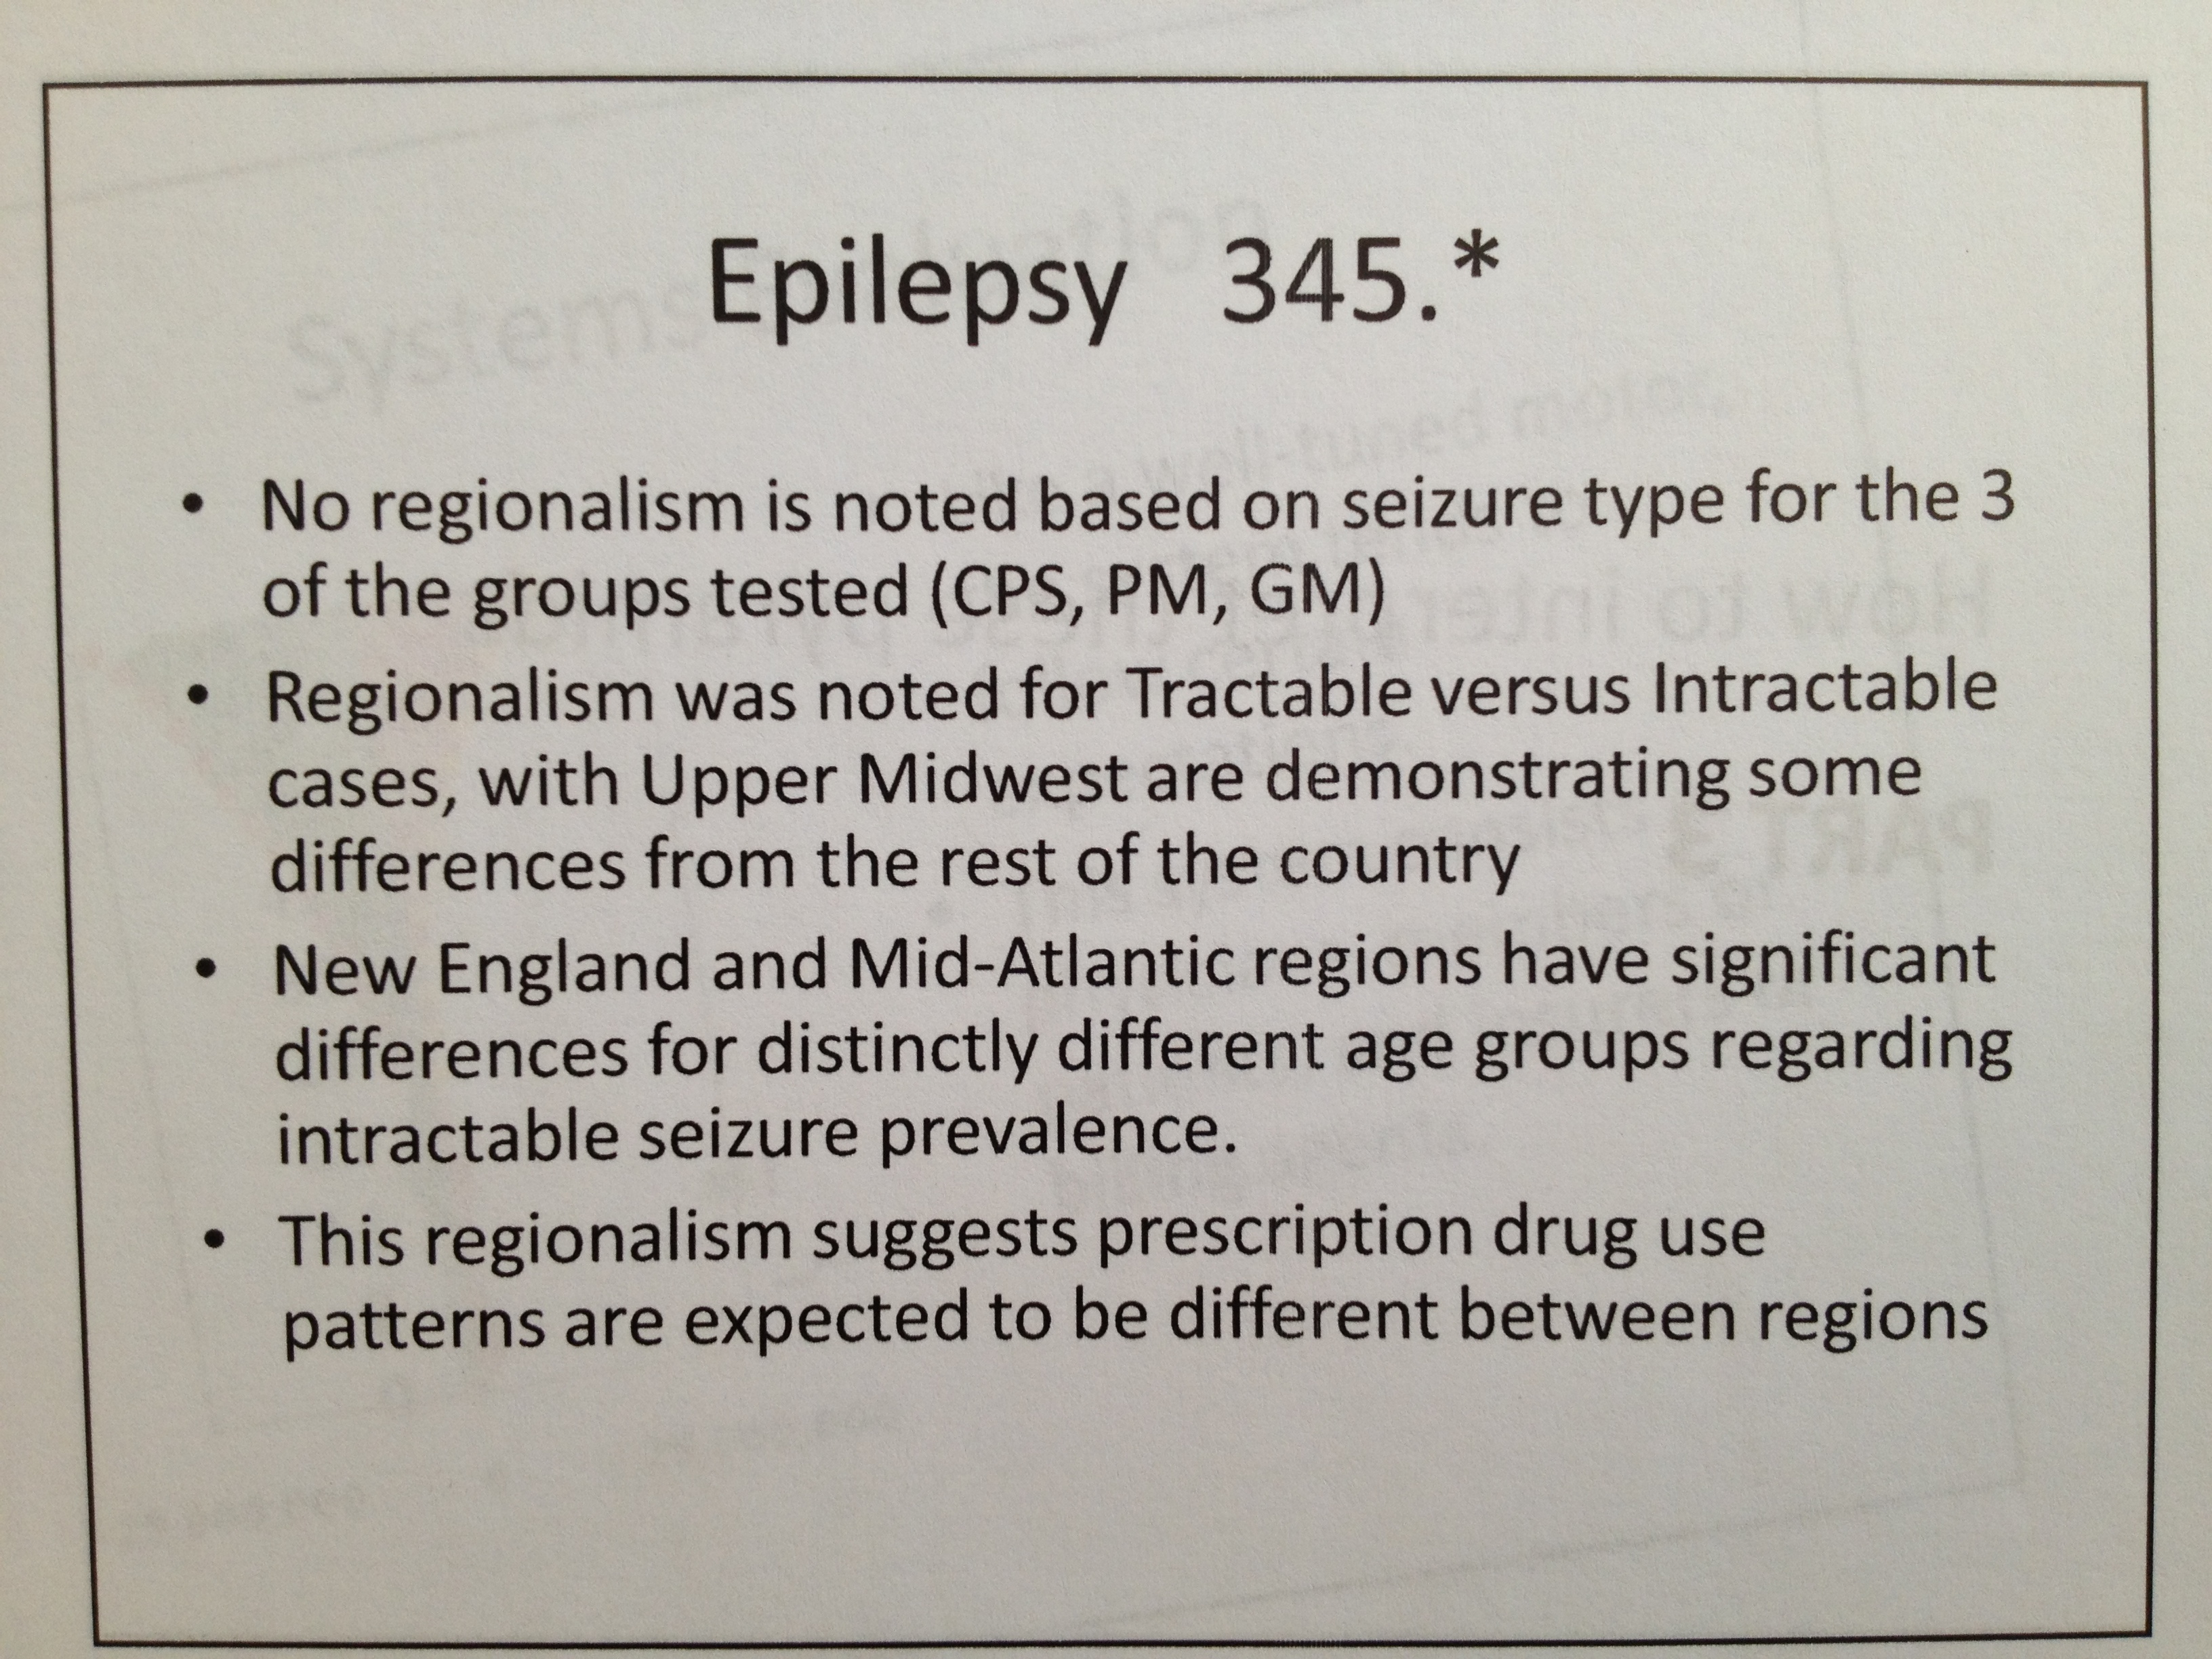
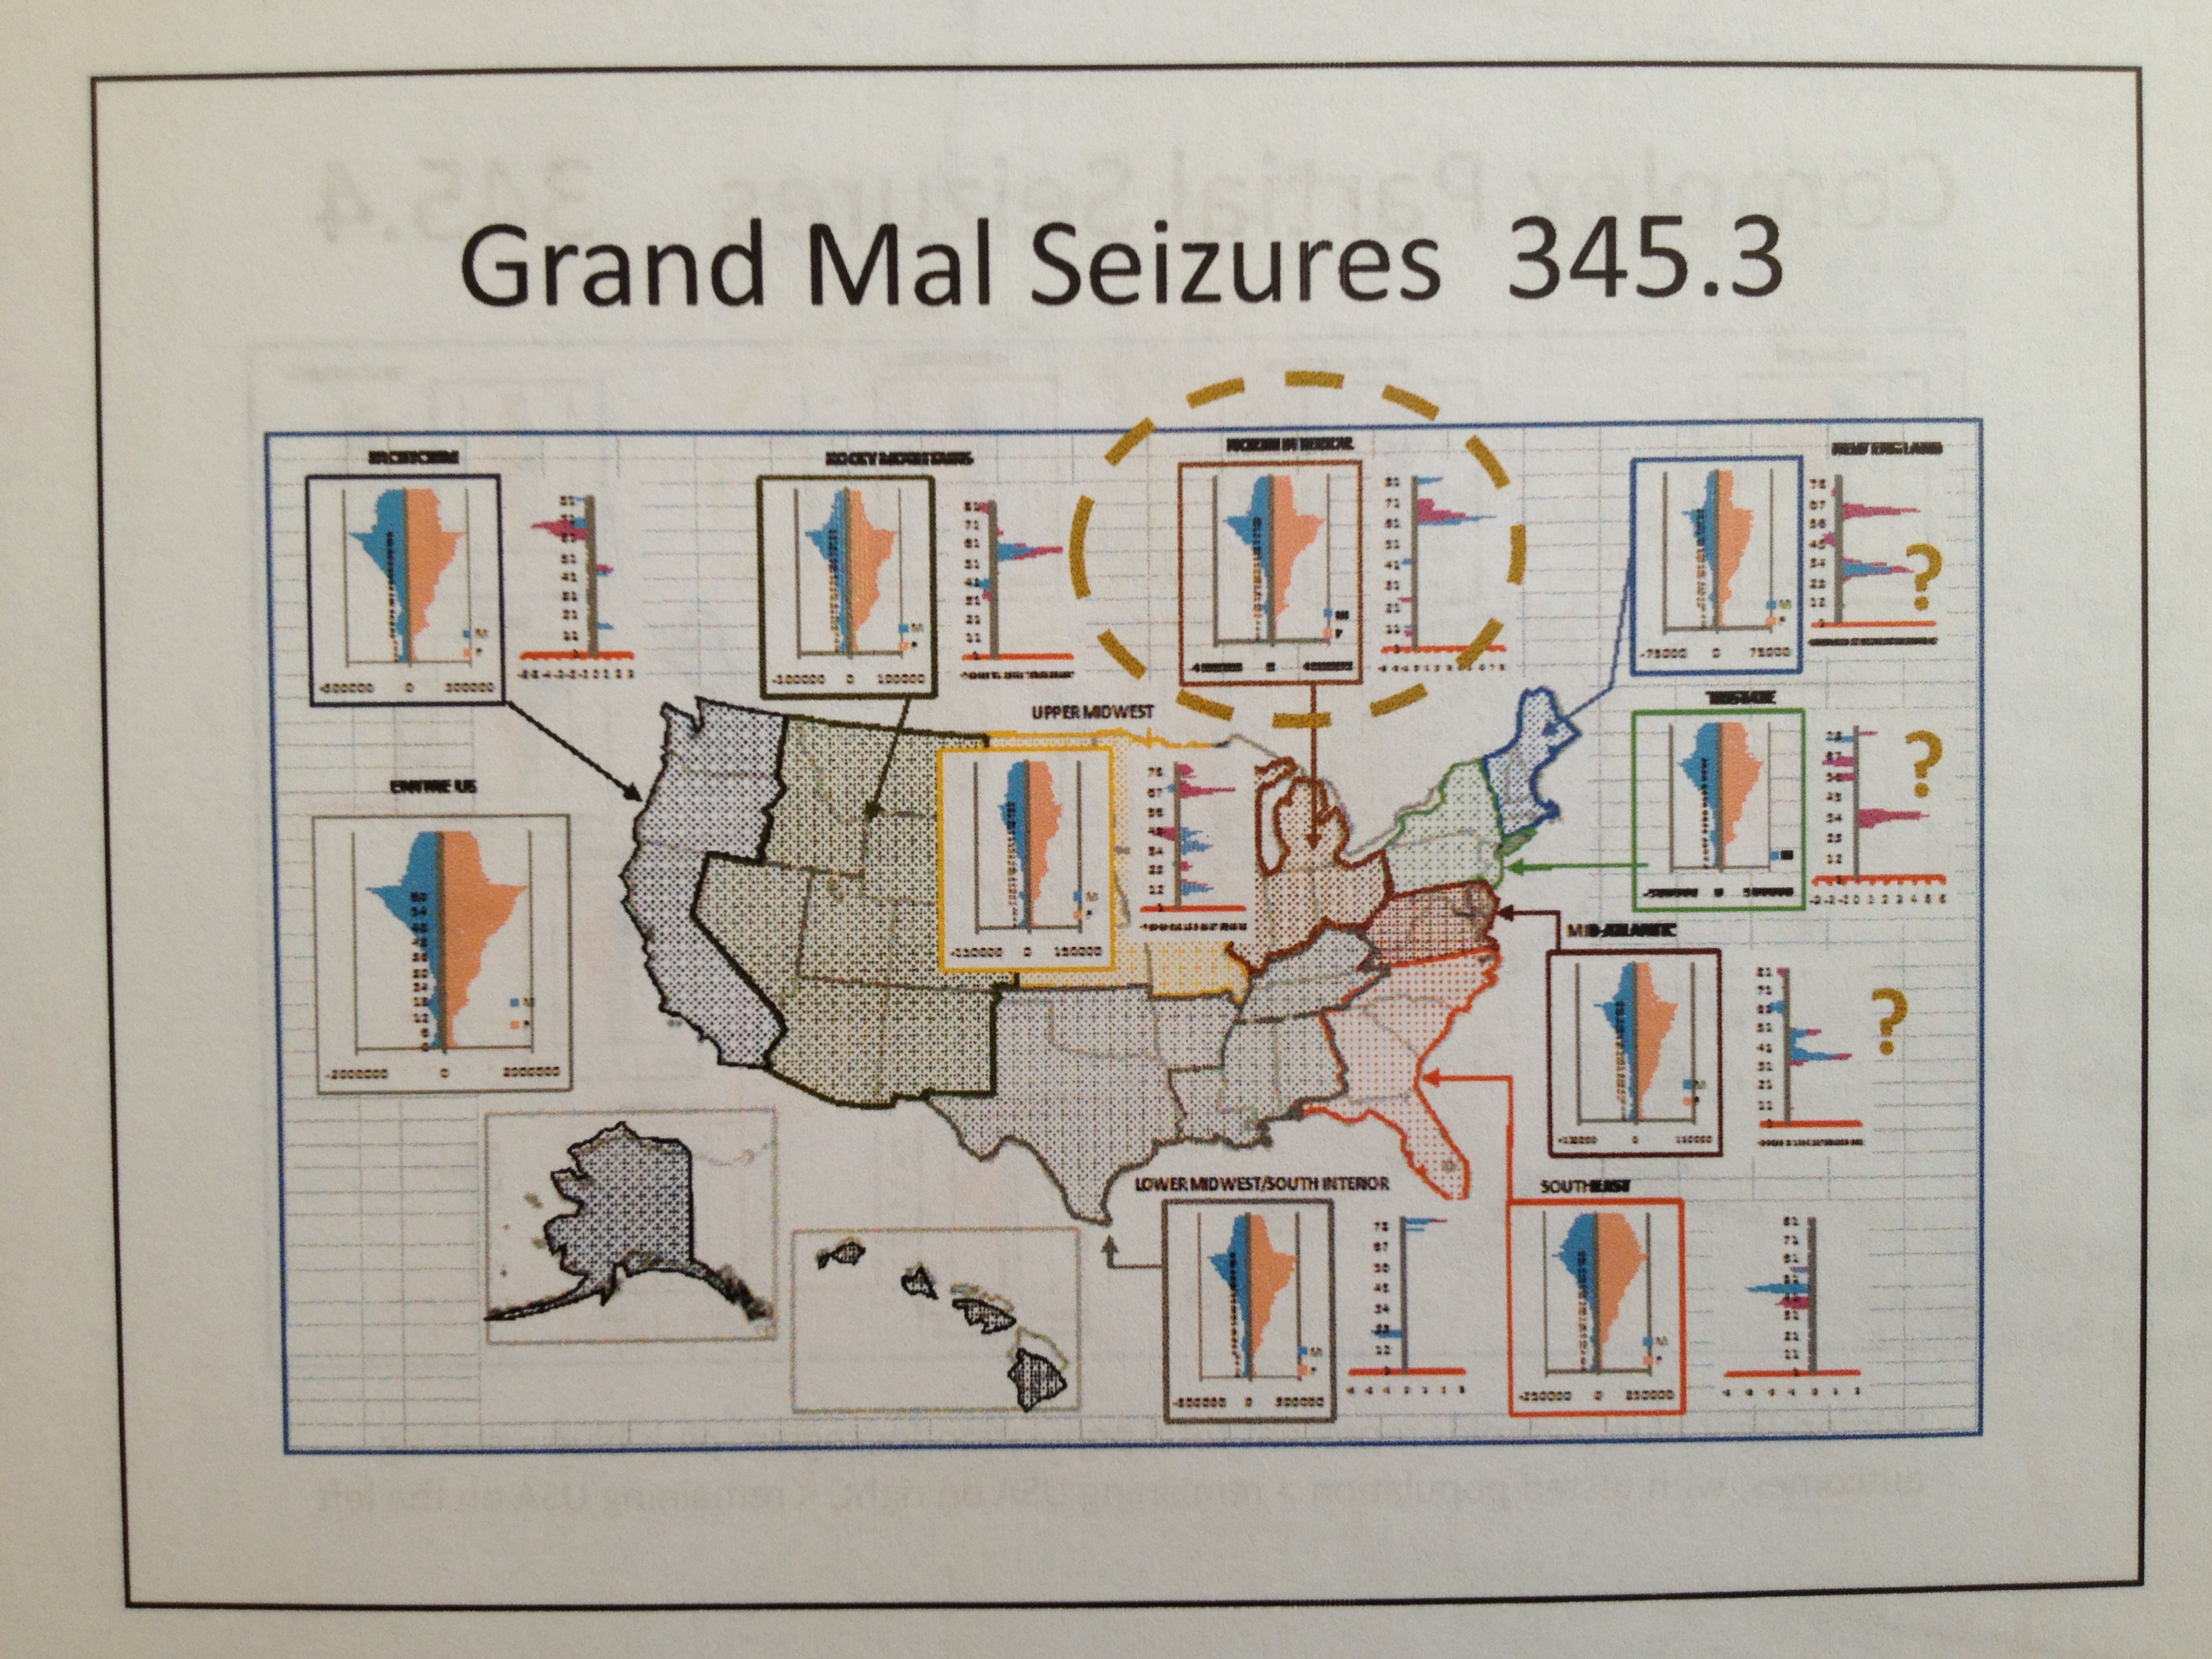
EPILEPSY
.

.
.

.

.

.
.

.

.

.


Leave a comment