.
 1-.
1-.
Medical GIS Public Health Activities at the Big Business level.
Pins = GIS savvy, but none at any high level of productivity,
i.e. producing regular monthly or weekly reports for surveillance of:
infectious and animal born disease outbreaks,
changes in suicide or abuse patterns,
socioeconomic disease patterns,
spikes in street drug deaths,
bioterrorism,
etc.
…………………………………………………………………….
![]()
Note: As of May 2013, I have a sister site for the National Population Health Grid [NPHG] mapping project. Though not as detailed as the other pages on NPHG, it is a standalone that reads easier and is quick to navigate through. LINK
………………………………………………………………………
I am also relating the value of my NPHG project
to contemporary public health news items at
http://pinterest.com/altonenb/nphg-the-news/
………………………………………………………………………..
NOTICE!!
A Survey has been developed to document and compare GIS utilization in the workplace. This survey assesses GIS availability and utilization in both academic and non-academic work settings. The purpose is to document the need for GIS experience as an occupational skill. GIS is currently being underutilized by most companies. Spatial Technician and Analyst activities and a few managerial activities requiring GIS are reviewed.
This survey, which takes about 20-25 mins to complete (’tis a bit long), can be accessed at
Survey Link
……………………………………………………………………………………………………
. 
HEDIS/NCQA QIAs/PIPs, Colorado Medicaid/Medicare/Employee Health, 2006, from: https://brianaltonenmph.com/biostatistics/quality-assurance/population-disease-monitoring-the-elephant-of-public-health/part-1-groups-health/
![]()
JOB SEEKING STATUS
GIS/Tableau/SAS
PhD Candidate – advanced reporting on disease and population health statistics.
..
Click on this to see its details
PROFESSIONAL DESCRIPTION (Most recent jobs)
SPATIAL HEALTH & BUSINESS ANALYST (Current and recently contracted systems developer). I have yet to see any insurer, PBM, pharmacal HEOR, health/business analyst, or Big Data BI information mapping company produce an effective mapping tool for specialists in BI, disease, fraud, prediction modeling, medical forensics, human behavior and people-environment interaction analysts or specialists. At least no such examples exist that are regular (weekly to daily) used and on the web, something comparable to the national population grid mapping techniques I developed back around 2000, a GIS or non-GIS tool that works at various resolutions down to areas as small as you like, to the community and household level if you want.
Now being this certain about my process (to some, arrogant) is probably going to delay any hiring of me to provide such services. But after ten years+ of this work and the numbers of accomplishment I have made, the goal her is more to demonstrate to businesses how behind they are in information mapping technology. It is better to be ahead of the IT curve and risk not being in the lead once the corporate environment managed to catch up, than it is to be behind so much that your company fails to generate any more income at some point and utlimately has to succumb to competition, close down, or be bought by your competitor.
There is a certain amount of corporate pride being engaged in this process of not accepting the fact that changes are needed for you business to achieve some level of success. With companies not willing to admit they are behind as much as they are (see my survey stats on GIS in the workplace), these 50% or more of the masses that exist right now are doomed to failure in the next ten years. We saw the same for such companies as Cygnus, one of the first bioengineering companies that tried to lead this new breed of pharmacal businesses back in the mid-1980s.
Unfortunately in the corporate world, innovation is not that common. Many businesses like to think they’re innovative, when in fact they are simply reinventing the wheel and/or producing something their competitors already thought out as well. By rule, bell curve statistics dominate in the IT world and businesses, with 90% companies behind the leaders, and more than 50% tagging behind too much to recover. There are the ‘dos’ and ‘do nots’ , the ‘cans’ and ‘cannots,’ very few if any of the formers. Too many of the latters out of touch with what’s really happening in the IT world and need for detailed spatial analysis.
.

.
Unlike a method that tells you how the northeaster US compares with the southwest, or one that shows use where major problems exist at the county level or less, but cannot provide us with the details we need to know where to begin our attempts for change, my system is currently capable of answering this question, hundreds of time over per day. I can produce 400-500 reports, each requiring 500 maps, per month, semi-automatically; if applied through an automated sql means, using Teradata, this productivity increases ten to twenty fold, for starts.
I use this medical mapping technique to tell me how events behave and are distributed, such as human behaviors, diseases, abuse, drug abuse, andmoney flow spatially or diffuse throughout this country, either hierarchically or linearly along transportation routes, or by way of how the environmental and climate based limiters influence their flow and behavior. By fine-tuning my standard reporting process, this enables me to know where the next rat bite fever is likely to take place for example, or the next outbreak of some condition brought in by illegal immigration from the west. This product enables companies to answer their most important financial questions, like what town is it that causes us to loose so much money with erroneous positive diagnoses. This detailed mapping method will most certainly generate some of the most impressive disease and health data map to date for this country, or for smaller population segments managed by big business.
Also important to note are some underlying controversies and social-political issues linked to my mapping method. I can tell you the routes of carriers of certain disease patterns. The way genetic diseases flowed into the country and continue to prevail can be told using this method. I am able to map most of the basic ICDs or diseases down to the rarest disease/small area level with this method, like my genetic disease maps produced of certain culturally based genetic disease patterns. These patterns can also be evaluated on a weekly or monthly basis, a feature certain NIH funded companies asked me about in 2005 regarding the applications of GIS to anti-bioterrorism, disease surveillance and outbreak prevention work.
.

.
For a company reviewing the spread of cases of diphtheria, for example, at a rate of several towns per week westward, this process can easily be seeing in the video programming aspects of my work that I use to depict disease spread over time and place. This enables us to review epidemic behaviors temporally, reporting at the small area or small population level. Such methods for surveillance are already in place in federal offices and programs by this time. To most big businesses, there are numerous insurmountable obstacles to companies doing the same, or so their CEOs think. At the CEO/Big Business level, being able to engage in this sort of mapping right now is essential. If we can prevent losing as much money as the federal agencies say we are losing, than why start a program to produce such a method for surveillance, when such a system is already possible and works 10s to hundreds of times faster than those being promoted right now? Without knowledge of what can be done, the decision makers go for the most status quo, something that is slightly over their head, because they cannot understand or accept anything else. They don’t have the knowledge or background to make such a decision.
I showed on health insurance industry how expense/cost-modeling can be used to tell when and where the consumer is mostly like to engage in fraudulent rx refill practices–answer the question: ‘who will most likely do it and at what age range?’ To date I have developed mapping techniques for nearly all of the ICDs and ICD classes (thousands), most of the cost metrics, more than ever expected for the bioterrorism related data that is out there (I added some to the national list), and all of the standard sociological health care metrics quantified using Emergency visit and V-codes data. This tells you in which several cities scattered about the country that illegal teen prostitution prevails, where a child is most likely to be underfed due to poverty, where the next unibomber is likely to surface based on spatially run psychological, psychiatric analyses.
This description of the value of national grid mapping is meant to be the way it sounds. I express these accomplishments in this manner because I find companies are sometimes incredibly slow at making much progress with their new data, much less their mouth-watering Big Data that they don’t know what to do with.
There are several lead data mapping industries out there that do have some spatial analysis techniques in place. For the most part, these companies are data displayers not data analysts. I know because I tested their products and tried applying their software to spatial analyses, not just generating spatial displays. In a recent discussion (it is now July 2013) with an international Big Data guru in California (and I mean Big!) I asked him ‘what GIS is actually in place and useful to the business world?’ He has yet to get back to me now 6 months later.
The GIS or pseudo-GIS systems that are out there are not at all innovative. They are a rehash of maps that could be produced in 1996, using different mapping programs. They reconstruct what is already known. They cannot be used to answer the critical questions that need to be answered to demonstrate improvements. They lack the use of new spatial statistical formulas. In essence, they are not at all innovative. I consider such rehashing of old techniques to be a waste of time, a “reinvention of the wheel” so to speak. Not creative, not inventive, not smart.
Now, I have no doubt these Big Data companies will in a few years have decent techniques developed, once they develop their infrastructure and improve upon their knowledge base a little more. But for now, most of these businesses are in some sort of a primitive stage in their analyses, hoping the lesser educated companies that buy into them remain there long enough for them to make the venture worth it, until the next breed of major competitors surpasses them. To me these companies are behind. To them I am just a single example of success that is not much for them to worry about, since most of the businesses out there are unaware that more advanced stages in population analytics work are already possible, and have been now for more than 10 years.
So, if you are or know a company that is right now trying to get some sort of data mapping or GIS working, if you are past your 3rd or 4th month in this project, that means your team working on this project is fishing for answers. It takes only a few days to get a good GIS working and a week or two to be productive. “Fine-tuning” isn;t the reason companies take months to establish a working GIS adequate at least for internal reporting. The fact is, there are two ways to go about GIS. The market promotes to long, tedious textbook way of doing it, with all its tweaks, buttons, impressive dots and squares, but for real use that is impressive, methods already in place by most businesses are not at all time-saving and impressive. They are status quo, and when you are in the backseat there looking at the product that just came out, you are probably wandering ‘Is this worth the money?’
The purpose for implementing GIS should only be on just one thing if you want your company to advance–to demonstrate to you and your staff in more detail where exactly the problems exist regarding cost, sickness, rebellious patient attitudes, drug abuse, prescription fraud, unwillingness of patients to make their appointments on time, high teen smoking rates, high less-than-teen motor vehicle accidents or deaths, the places most likely to demonstrate childhood sexual abuse, waste of money on high cost procedures, elderly neglect, double billing, inadequate records keeping, etc.
The methods of GIS I use to display these features about peoples’ health can be done with or without GIS, and may or may not require tools like SAS, GIS, Tableau, and the like to move the company along in advancing into this part of the health and business field. Chances are, if you deal with a half million or more people, you are falling behind if you can’t already produce your data in GIS, not that you are trying to (meaning you expect final reportable results a years from now), but that you are sufficiently advanced to impress you competitors with your knowledge base about using this method.
To date, no companies are reporting actively, meaning weekly or more, using spatial analysis. Most companies are using a GIS reporting method that is decades old, which internally seems to be quite a success but which in the GIS community means only that they lack knowledge and foresight into this field, and are not the innovative company they want to be. I know a major PBM for example that says it has a GIS in the works, yet the product they produced and demonstrate the results of the world can’t even tell you enough to know a multistate region where to begin your plans to make the nation healthier. Another company has a CDC-NIH re-reporting mapping program in place to demonstrate state health data; I way re-reporting because this method doesn’t report much data that can be used to improve local health or get the attention of the masses enough to make the state healthier.
My tools do exactly what I am so critical about, which is why I can be this critical and know that all of its meaning is true. Currently there are no companies out there fully engaged in any GIS or spatial reporting at the square mile, small hamlet, cultural community, regional topographic level like my methods produce. A recent company tried to locate the sources for fraud in billing in Knoxville Tennessee, but without GIS and only address data got only as far as showing once again that the problem is there, without adequate spatial statistics to define the nidus for this problem. With my system I know where the foreign diseases come in and what routes they are taking, where our guards have to be improved to prevent foreign born disease intrusion, and where the major forms of suicide, abuse and fraud occur in this country, down to the town of hamlet level.
.
.
MARKET ANALYST (recent but not current work). Experienced analyst for businesses and industries with exceptionally large populations (“Big Data”) for insurance agencies and large area medicaid/medicare type programs. To date, have been responsible for evaluating a total of approximately 25% (N=125M) of the US population, holding more than 5 institutional (incl. *.gov) and corporate positions as an analyst since 1997, engaged in institutional, state and federal research, several educational positions, and various biostatistician, quality assurance and management responsibilities at the corporate level. Since 2000, my work has focused on the exploration and use of population pyramid and grid (GIS and non-GIS lat-long) modeling techniques, with personal IP Age-Gender techniques and formulas created between 2003 and 2005 (some presented in 2006 for which I received an award). Analyses range from simple population health statistics to evaluations of stat sig differences between programs and SICs of hiring companies for insurance agency work. I developed one of the few methods out there for evaluating two very unequal groups of populations in order to measure statistically significant differences between the two at 1-year age gender levels. Most recent successes at the business level include reports generated on regional and local chp/medicaid/ medicare programs needs and costs; evaluation of health care demands, diagnoses and related unit/event treatment costs; development of 300+ ICD metrics tool used to measure overall program success. I produced my own set of tools for most of the analytic and mapping processes previously considered unmanageable for Big Data/Big Analysis routines.

National Population Health Statistics: a product of my 3D grid mapping algorithms and program
MOST IMPORTANT PERSONAL ACCOMPLISHMENTS (IPs):
IBIS/TM, by AMRTA. [See http://ouribis.com/%5D It is hard to believe that this database is still alive and active! It recently surpassed the thirty years mark of 2011, thirty years after I first sat down and began writing a toxicological syndromes database in Datastar, calling it TOXIDROM.DTA (8 character names were required back in 1982, with extension allowed to be anything you wanted!). At the time I was freshly enrolled in an MD program and trying to develop a niche for myself with the university hospital and emergency department, places where I had worked for the past 3 or 4 years, along with the pharmacology department, with which I was vying for my second admission separate from the M.D. program into this department’s Ph.D. program. The purpose of my TOXIDROM project was to produce one of the first diagnostic databases on a personal PC with information on plant toxicology. It was to be used for diagnosing patients who ingested an unknown domestic or wild plant, including drug plants, rainforest plants, herbal medicines, exotics, investigative research plants, etc.. Data would be entered related to their signs and symptoms, descriptions of the plant(s), blood results and the like, and a listing of possible toxidrom diagnoses would be produced as output for printing by the Sanyo MBC. This was based on the assumption that had a clearly delineated way to define the toxic syndromes by their sign-symptom combinations in order to more selectively or specifically identify the type of toxin the person ingested, inhaled, injects, absorbed, whatever. These toxins were the evaluated as well by class, based on whatever receptors its most reactive and toxic chemicals were bound to. In the end, this database was made so that it could be migrated from one work environment to the next, one computer to the next. Much later, it was transferred to several new systems I bought, finally ending with the more recent CD versions and now web freeware. All of these products were designed to complement the microfiche version already out there for evaluating the more common forms of industrial, building and domestic intoxication cases. The much larger toxicology database was commonly used by all Poison Control Centers and University Hospitals in the country. Ten years later, I modified this data base substantially for use in a database related to complementary alternative medicine from 1989 to 1990, using the same toxic syndrome logic, software tools, PC and printer I did seven years earlier. This database has, as of January 1st, 2013, been re-released in its nth generation, thanks to its designer, inventor and principal owner Mitch Stargrove. It can be accessed at http://medicineworks.com/ibisdesktop-integrative-bodymind-information-system™. For use or exploration on line go to the freeware at: http://ouribis.com/ . (Thanks Mitch!)
GridEcon Reporting Method. Innovative tool designed for more complete use of standard electronic health information datasets. Makes use of Health Grid reporting techniques defined below, producing standard institutional (HEDIS/NCQA style) internal/external reports via automated processing, for ICD9/10 evaluations.
Most important addition includes reports on underrepresented ethnic or cultural groups and unique populations historically undermonitored by HEDIS and NCQA QA routines. Metrics are cost-claims-events-n-%-prevalence based, med or rx. Focus is on standard population health indicators and several hundred sensitive ICD indicators identified for population health measurements. The most unique algorithms are designed to assess quality of care for specific cultural groups (Af, As, N, etc.), disability groups, Chronic Disease populations, and age-band defined high risk infant, young child, older child, young adults, preventive care populations, etc. Special reporting routines also developed for Psych-Behavioral assessments, Infectious Disease risk assessments, etc.

Examples of metrics related to my ‘national child abuse and neglect’ grid mapping project
Invented National Population Grid – a 3D Mapping technique based on small area grid modeling and analyses. This is a highly innovative national grid mapping technique using variable grid cell size developed and tested over the years in Excel95+, IDRISI and IDRISI32 (1997), ArcView 3.2+ (2004), ArcGIS 8/9+ (2006), SAS 5.5,8,9+ (2010), SAS/GIS, etc.. It can be fully run without a GIS.
Note: A similar methodology with software and applications to economics research was independently produced and posted by Sonoma College in California focused on urban crime patterns and behavior [see Lodha, Suresh K. and Arvind Verma. 1999. “Animations of Crime Maps Using Virtual Reality Modeling Language.” Western Criminology Review 1 (2). [Online]. Available: http://wcr.sonoma.edu/v1n2/lodha.html],
and by Gecon program at Yale University, for which see http://www.flickr.com/photos/arenamontanus/sets/72157594509798466, product of http://gecon.yale.edu/.
On 1/1/2013, one other possible duplicate product in software form was located on the web as well.
As usual, England has taken the lead over the US in geography research with this technology, having implemented a GIS grid mapping technique for mapping its national population statistics using a hex grids approach, with hex cells partitioned to produce a pseudo-TIN spatial data model.
Hexagonal grids are also the focus of computer games (see this search).
(Apparently businesses dependent on spatial data are the last to learn of its benefits.)
(I am looking for a company or university willing to take a risk and utilize these method to evaluate and map national population statistics related to public health, power and petroleum products industries, manufacturing and sales, consumer purchasing power, foodways, travel industry activities, etc.)
JOB TYPE(s):
Population Health–analyzing and predicting population health status and change.
Population Profiling–use of formulas and methodology I developed for analyze consumer type, income, cost, and utilization relationships.
Environmental-Population Health profiling. .
![]()

My 2003 IT Invention (most popular research tool download)
.https://brianaltonenmph.com/6-gis-ecology-and-natural-history/hexagonal-grid-analysis/
.
![]()
PRIMARY JOB HISTORY
- NPO Management,
- Professorships,
- Biostatistician,
- Population Health Statistician,
- Environmental Health and GIS,
- Institutional Administration,
- Grant Writing.
![]()

One way of characterizing what I do is thinking of it as looking at “the pulse of the nation”. When I performed by first demographic study at the large scale, GIS, Census level in winter of 1999/2000, I had the opportunity to work under someone who successfully predicted the population changes for the Pacific Northwest urban setiings. He subsequently had to leave because he refused to reveal his formula to some of his colleagues, after all this was his IP and at the time everyone was sensitive to losing their position in the regional offices due to obsolete skills and useless or out-of-date statistical knowledge. GIS was the way to go.
At the time, there was this formula I developed several years earlier that I realized could be applied to this population pyramid analysis technique, and so, following his departure, I developed my own methods for statistically evaluating population features. This IP I have also refused to share, but have since continued to apply it to larger and larger amounts of population data. This IP is specific to interpreting population pyramids statistically is only used on personal devices. University settings colleagues respect it, corporate settings admire it, but don’t understand it. It is currently in use only at the personal level.
Like the GIS hexagonal grid method that I developed, this IP is kept private in order to determine if it has any corporate or federal programs value. In the latter case it would ultimately become publically-shared IP; in the former, I expect it to be productive for a few years, until other corporate settings develop their own versions of my methodology.
The above method has been applied to nearly 1000 ICDs and/or ICD groups, for all well-known or highly publicised disease and disorder states. In some cases, ICD prevalence-incidence was related to related health care cost.
I refer to this as a study of ‘the pulse of the nation’ due to levels in which it was applied. Like GPS when it was new, this method and its numbers will ultimately become common knowledge in the intellectual world. Whether or not it will be incorporated into the corporate world in the near future waits to be seen. This method is for now a couple of stdev’s ahead.
..

Theoretical N, Prevalence, Significance by Gender, Medicaid CMC 2004, Perot Systems 1-year increments for total population regardless of utilization history and eligibility
![]()

A Time and Place for Innovations
PRIMARY SKILLS
Inventive and Creative. Work best with thinktanks and highly interactive, fast-thinking teams. Inventor of new methods and formulas involving previously untested measures; 2+ SD ahead of the norm.
Most important inventions/creations:
-
- National Population Health Grid mapping technique (tested and validated) and GridEcon Matrix [GEM] analytics and reporting tool (described above).
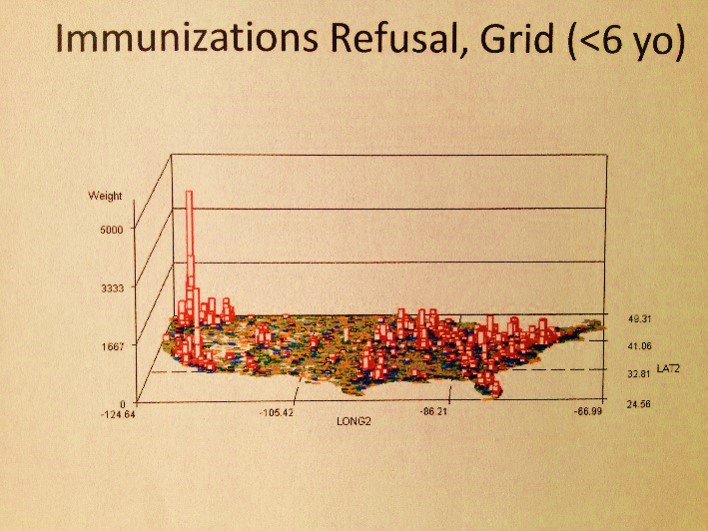
- Example (the first map video produced): 4 min. vide0 map presentation Immunizable Diseases , ‘Healthy People 2020 – Missed Opportunities in Current Childhood Immunization Programs.’ 2007/2008, 2009/2010.
- Developed way to produce instructive videos with these algorithms; example: video map for national statistics for Refusal of Childhood Immunizations (all combined) — http://youtu.be/WZoaIn1ujm0.
- Developed highly sensitive risk analysis formulas for use at national and small area grid levels; i.e. Video Mapping Risk Scores x Percent Late — http://youtu.be/EvPXMHXh6Mw.
- Developed formulas for and revived hexagonal grid mapping techniques first made popular in 1840 [2003]
- Invented formula set or series for statistically comparing age and gender attributes for 2 exceptionally large populations (1M-300M), with unmatched population size and unequal variances, for any age-gender dependent measure (cost, utilization, income, oil/gas utilization rates, advertisement response patterns, travel behaviors, etc.). [2005]
- Developed profiling formulas for evaluating two objects with constantly changing form or topography (facial recognition, land surface DEM evaluations, unique non-predictable, 2D curve plotting analyses) [1997, 2002, 2005]
- Developed corrections formulas for more accurately evaluating heteroscedastic-troubled cost income behaviors involving large populations.
- Developed unique vector-raster ecological study methodology for analyzing west nile, malaria and other mosquito-borne diseases using GIS and Remote Sensing; used successfully to identify positive testing West Nile carrier site [2000-2006, ESRI award received 2006]
- Developed unique profiling methodology for chemical release site analyses using GIS, in relation to specific cancer cases for the state of Oregon [2000-2003]
- Developed unique prediction methodology for assessing phytochemical value and potentials based on standard chemical biosynthesis equations integrated with taxonomic mapping tool for evaluating phytochemotaxonomy [1989-2003].
- Developed unique combination quadratic and cuboid modeling method for assessing surfaces with ongoing baseline changes (assessments of watershed surfaces above closest water body vs. above standard sealevel) [1997]
- National Population Health Grid mapping technique (tested and validated) and GridEcon Matrix [GEM] analytics and reporting tool (described above).

Visits to the primary site on Hexagonal Grids formulas, October 2010 to August 2011
![]()

.

Oregon Chemicals Exposure and Innovative ArcView-Spatial Analyst Applications
.

https://brianaltonenmph.com/west-nile/case-related-surveillance/
.

https://brianaltonenmph.com/west-nile/topography/
(click on)or ‘Healthy
![]()
UNOFFICIAL SURVEY OF BUSINESS-RELATED EMR, HIT AND GIS SKILLS DEVELOPMENT
. . . in other words, my most recent Job Hunting activities.

January to February
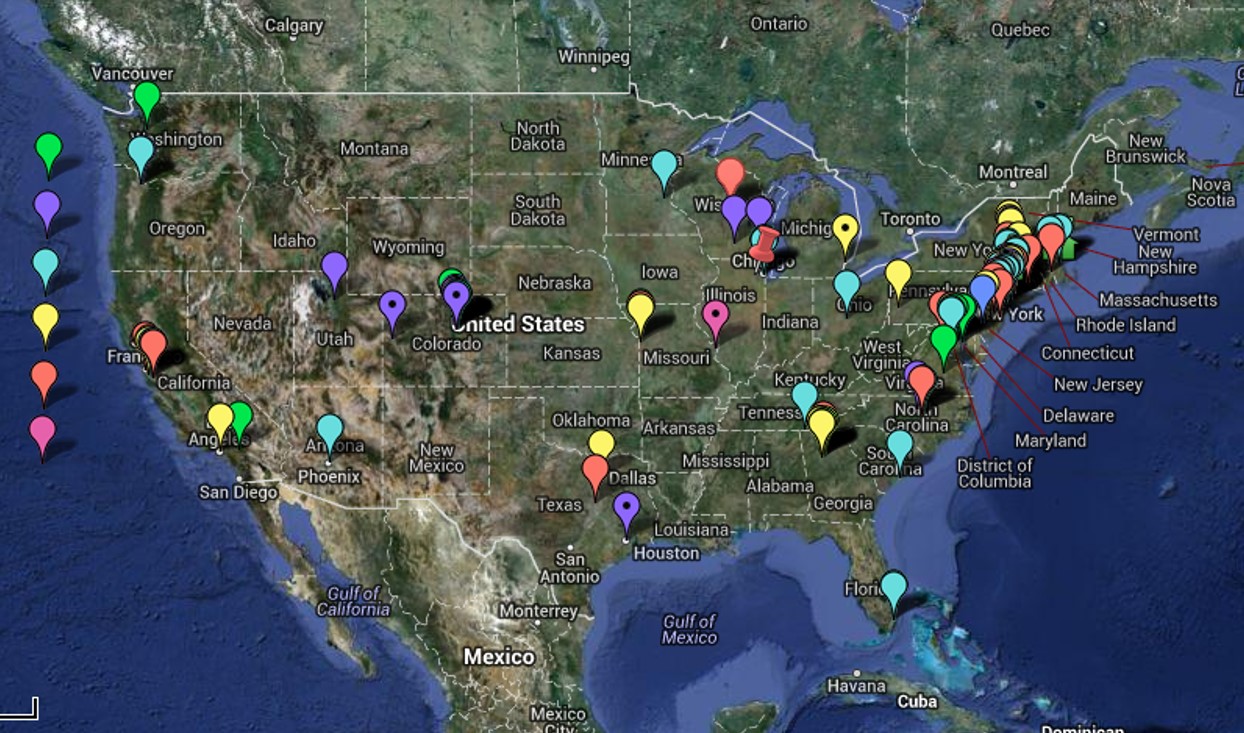
Spatial Distribution of Job Applications (pharma, medical, consumer-economics and other big data and IT/spatial data industries, January-March 2013. Ranking key to left. Google Map Project and Source for the above figure)

January to March
Why do this? . . . “Measuring Results” and Accountability . . . related article.

January to April

January to May
January to June
July
++++++++++++++++++++++++++++++++++++++++++++++++++++++++=
UNDISCLOSED
Evaluation of entre population with the goal of developing a population health monitoring and reporting routine for a client with 6-8M members, enrolled as employees and family. Contract awaiting final signature.
UNDISCLOSED
Specific spatial relationships between diseases and population. Evaluations of age-gender-ethnicity-hispanicity in relation to GINI, SES, SIC, modified CDM score, and specific High Risk ICDs related to psychosocial, behavioral heath, culturally-linked, culturally-born, low SES/poverty, genetic, teratogenic, and rare diagnoses. For development of a program and the support of its grant.
UNDISCLOSED
Any and all possible population health measures and statistical analysis techniques. 78M people rx hx, 17.5M with med rec, nearly all with detailed med hx/health analytics (HEDIS/NCQA and non-HEDIS/NCQA). Perform large scale population modeling tasks and analyses (i.e. detailed age-gender-SIC-demog-regional-state-med-rx history-cost-ICD comparisons, for about 25-30% of US work force, plus insured family members, assuming 137M workforce population size in 2011); perform company/agency adhoc requests on 1,000 to 1.5M patients, per project for clients. Perform total population and total med population reviews for any and all HEDIS/NCQA/special project related queries. Developed a population age-gender comparison-profiling tool that performs statistical comparisons; used to compared “control” populations with research populations, correcting for large differences in N. Created several health/health risk scoring methods based on electronic medical records data; improved upon similar formulas already in place; invented actuarial (prediction modeling) tool/formula.
.
PIM, Inc., a CME COMPANY
MANAGER, BIOSTATISTICS
Responsible for Educational Outcomes Measurements of National and International Continuing Medical Education programs targeting physician, pharmacists and allied health clinicians. Responsibilities include design of survey tools used to document changes in clinical performance and outcomes due to programs and monitor teachers’ performance. Perform periodic nationwide surveys of institutions responsible for planning and implementing these education programs. Engage in temporal, parametric and nonparametric analyses of student, teacher and CME company pre-test/post-test/follow-up performances. Design follow-up tests used to document clinical activity outcomes. Engage in periodic reviews of overall educational programs to determine levels of company/npo performance, and levels of engagement related to the most popular topics of the year. Invented an automated testing and analysis tool for evaluating pre-post-followup educational program outcomes at the clinical level; technique developed makes use of a combination of qualitative-quantitative analysis techniques based on a grounded theory-chi square-Mann Whitney methodology used to test 14 measures; an automated process for data analysis was created in order to review a series of lengthy case reports data/verbage and engage in analyses of the related followup survey text responses.
.
UNDISCLOSED
NPHG project. Non-GIS tool tested for spatial analysis. Minimal rate of performance: 20 reports/day, 500maps/report average, 10,000 repeated sequential testing maps/day, 200k maps/month, 1.2M maps/year. Monthly or weekly report cycle, for 100-300 ICDs/ICD groups per client report–> 1-3 client reports per day generated with non-sequential mapping series. 5-6 final reports for clients per week, if 75%-85% fully automated. Productivity doubles or tripled once full process is automated. Right now, reports require two main sequences of output production; client reports require 3 steps.
.
UNDISCLOSED
Evaluation and development of a mapping program for infectious disease patterns in the United States for grant-funded contractor, subcontracted by major epidemiological company or institution. GIS to be implemented as an epidemiological surveillance tool for an urban/suburban densely populated setting. Requirements were automated analyses sqls/SAS techniques and semi- to fully-automated map generation capability, to be used for live, weekly or monthly reporting based on prior week ID data. For development of a program and the support of its grant.
.
UNDISCLOSED
Evaluation of penetrable foreign disease/biosecurity data for foreign born diseases and potential migration routes. Linkage of site/nationality of origin, pathogen type or class, ICD related diagnoses, probably microorganisms including host-vector ecological relationships, international and transcontinental culturally specific migration routes, virus-human behavior diseases, and vector-host-human relations, each with specific routes of penetration and migration. More than 200 CBS, CLS, CLID, CLNID identified and pathways reviewed and/or identified. Identified high risk border regions for specific disease type penetrations. Some zoonotic disease patterns, including host-vector ecology and diffusion potentials were included. For development of a program and the support of its grant.
.
DENVER HEALTH MANAGED CARE
Biostatistician. Monitored population health for Managed Care program serving 55K Medicaid, 1.2K Medicare, and 8K Employee Health members, 300+ measures. Designed and analyzed success of 16 health education/health monitoring programs required by state and federal agencies as part of the required Performance Improvement Projects and Quality Improvement Activity accreditation programs. Developed a series of automated analytic tools used to document outcomes and analyze results according to HEDIS and NCQA requirements and guidelines. Designed a monitoring tool that automatically pulls data from case manager activity database and measures/analyzes rates for majority of CM activities; purpose was to measure input/output, performance and quality of these activities.
Topics for review included chronic disease management practices (diabetes, asthma, chf, cad), std and cancer screenings, pre-natal/postpartum care, psychiatric visit follow-ups, and several administrative procedures. Other responsibilities included prescription drug use measurements and monitoring to identify high cost/high risk cases, monitoring of case worker activities for high risk chronic disease and pregnancy cases, monitoring of complaint types and follow-up times for the complaint line.
Also developed a program for producing populations pyramids of various programs being monitored, to determine population sizes for all HEDIS/NCQA PIP and QIA measures-defined test groups (PEROT systems). Designed tools used to automate the internal monthly and quarterly reporting of statistics on complaints, prescription drug use (3-7M rxs per measure), and drug-cost related Cost-Effectiveness (overuse/misuse) measures. Developed an age-specific population health monitoring tool use to quantify specific IP/OP activities considered indicators of specific disease-realted activities (300+ ICD measures); data pulled from pre-established internal datasets automatically with opening of tool.
.
UNDISCLOSED
GIS evaluation of ecological and environmental data for state/local project pertaining to community health and health risks linked to chemical release for sites in the Midwest. Credibility of reporting and records keeping kept by this internet company were determined to be very poor and not recommended for use in regional assessment. A run of the mill npo developed overnight was evaluated and questioned concerning credibility of data pulls. Project was ceased. Another similar npo was evaluated for exposure or risk for exposure due to “nuclear silos” in this multistate region. Credibility and reliability were determined and recommendations developed for this program.
.
CLARKE ENVIRONMENTAL
Vector-Host Field Inspector/Technician. Projects continued to present (2009) include: Developed GIS for monitoring West Nile Fever ecology. Methodologies developed and tested include point, area, transect and grid analyses of west nile fever, vector and host ecology. Research area: 60×40 mile county in New York. Spatial features analyzed and mapped on West Nile history include topography, hydrography, vegetation biomes, land use patterns and history, demography, positive case monitoring. Survey tools developed for assessment of all active field sites, with emphasis on local plant species ecology. Dataforms in use include standard shapefiles, personally developed vegetation phytoecology datasets, SRTM, NLCD, NDVI, DEM, and Landsat spatial data and/or imagery. Software utilized: ArcGIS/ArcView, Idrisi, and several LS readers and data exchange extensions or tools. Developed technique for related NDVIs to positive species ecology. Invented technique for measuring influence of vegetation types and canopies on light penetration and vector species spatial behaviors. Invented grid mapping tehcnique used to identify positive testing disease foci and local swarm sources. Developed technique for analyzing aggregates data for host species reports. Invented technique for mapping vector distribution in relation to topography, utilizing a transect-based mountainface change in Z methodology and related DEMs. Invented technique for documenting species competition, biodiversity and human infectability based on floodplain ecology transect techniques. Invented technique for identifying potential sources foci in urban settings and adjacent to equine settings. Successfully used combined host-vector mapping techniques to identify local positive testing vector pool location, and to rule out possible positive locations as sources for specific human cases.
Results of ArcGIS/ArcView/Idrisi work on West Nile Ecology published at http://brianaltonenmph.com.
.
PSU RESEARCH ASSISTANT
GIS, Epidemiology, Environmental Health specialist. Monitored ecology of Lyme’s Disease, West Nile, and waterborne diarrhea-/dysentery-inducing pathogens (vibrio, shigella, vibriotoxic E. coli, entamoeba, staphylococcus, cryptosporidium, giardia). Developed algorithm used to predict waterborne disease spread across a 3-dimensional surface. Mapped mammography activity/breast cancer prevalence/mortality in relation to population density and socioeconomics census block data. Databased, analyzed and mapped environmental chemistry for 3400 local release sites; defined 22 exceptionally toxic sites in the state aside from superfund and superfund applicants; developed hexagonal grid/isopleth (contour) maps depicting distribution of specific cancer cases in relation to known toxic release, industry/chemical type, and EPA/CERCLA/NIH/AMA toxicity/carcinogenicity information. GIS-related Outcomes for grant funded Chemical Release Sites study of the state of Oregon are reported at http://brianaltonenmph.com.
.
A GIS EVALUATION OF TILLAMOOK BURN HISTORY – THE PHYSIOGRAPHIC, CLIMATIC & PHYTOECOLOGIC REQUIREMENTS OF MASSIVE BURN REGIONS
Compared Oregon’s coastal wildfire history with similar histories about the Pacific Rim and in Europe. China and Finland in particular had ecological similarities and matching wildfire history and risks. Topography and mixed conifer-deciduous pre-old growth to old growth settings were determined to be major risk. NLCD data and meteorological data were determined to be valuable in assessing and defining areas of high risk for costly fires. SLAR and Satellite Surveillance data on terpene release by NDVI cells [AVHRR data] were possible information sources in need of further development, but the satellites responsible for this surveillance were inaccessible at the time.
.
PSU RESEARCHER/LECTURER
Plant chemotaxonomist/analyst. Lab work: BIQ alkaloids, coumarins, neolignans, TLC-screening of OTCs. Instructor for 3 and 4 credit courses on ethnopharmacology, natural products chemistry, phytotaxonomy, history of pharmacy/medicine, environmental chemistry, NW natural products. Produced evolutionary tree (division to species) depicting chemical complexity in relation to classification of plants. Specialized in development of novel pharmaceutical products using local rainforest natural products (initiated local taxol industry 2/1986). Responsible for the initiation of a permit-program designed to prevent overharvesting of natural products on public lands (1989). Tested OTC and chinese medicines, nutritional supplements, wildcrafted medical and cosmetic products for safety or consumer complaint-related features (1988 – 1996). Authored course texts: “PLANTAE: The Evolution of Plant Chemicals” (1990 – 1993); “PLANTAE: The Evolution of Natural Products” (1993 – 2000).
.
GIS EVALUATION OF A LOCAL POPULAR CULTURE MOVEMENT
Assessment of “Bigfoot credibility and reliability” on behalf of a University supported research program was recommended. GIS was the recommended tool for assessment of reports made and recorded over the past several decades. This project was requested by the social group/NPO involved with this popular culture movement. This NPO at first had an interest in engaging in this process, but less than 6 months later refused to continue its role in the development of this local research project. University sponsorship of this study was retracted in winter of 1998/1999 after one tourist season of outdoor activities and discussions.
.
GIS EVALUATION OF THE PHYTOECOLOGY OF LOCAL VISITOR’S SITES ON MOUNT HOOD WITH HIGH EXPOSURE
Mount Hood evaluated for vegetation regions and a database was developed and tested for implementation as part of a land use study. Standard vegetation regions data published decades prior were the focus of this project, along with unpublished east face-west face mountain topography/ecology/vegetation domain data developed by local research groups over the years. An early use of ArcInfo/ArcView GIS was developed in order to test the applicability of GIS to assessing ecological data using alternative data sources for evaluation and display, such as DEM, Aerial Photographs, standard state agricultural and land use data, regional soils data, seismograph, volcanic and geological data, state-generated population data, TIGER files, etc. etc.
.
PLANTAE CHEMOTAXONOMIC-ETHNOBOTANY MAPPING
GIS used to produce a tool for mapping and assessing 3D spatial relationships between DCSOFGS taxonomic and chemical synthesis domains, by major chemical classes, for Plantae. Successfully developed methods for assessing stages of chemical development, later published as an essay/book on primary, secondary, tertiary and quaternary metabolites or chemical pathways and potential anthropic applications for these end products. (Used to teach classes on the same; portions of these findings are published on this blog site.)
.
POST-NATURAL DISASTER RECOVERY PROJECT
Mount St. Helens Ecological/Phytoecological Recovery: ten year study. 1986 – 1995, ongoing
.
THE BIOENGINEERING OF PLANT-DERIVED NATURAL PRODUCTS
Consultant for Hubbard group responsible for researching any industries involved with Plant Tissue Culturing end products (Calgene, Cygnus, etc.). Products evaluated included the now famous HEAR/LEAR Oil (Canola/TM) market, and a variety of Plant Tissue Culturing markets developed for synthesizing products of economic potential to food and drug industries (Stevia, etc, anti-cancer drugs, specific antibiotics). Served as spokesperson for research group, appeared on local television [KATU’s Town Hall, with host Jack Faust] for a short while in Winters 1986/7; assisted in development of patent for grass-blade paper manufacturing technique using a low cost, genetically modified and gramina species and patented culturing method. Created PTCing portable lab using PVC tubing and clear plastic sheets, with instruments, HEPA and nutrichemical requirements described for project and published as a booklet. Assisted in development of local Orchid cloning projects at the University greenhouse lab station for protection of local endangered species.
.
DATABASE DEVELOPER
Re-released in 2013! Links: http://medicineworks.com/ and http://medicineworks.com/ibisdesktop-integrative-bodymind-information-system™. Developed ‘TOXIDROM’ database for use in diagnosing cases of plant related intoxication. Originally developed 1982-7 in Datastar and operated on Sanyo MBC (2×5.25″ DD, 80kb disks, 4kb HD); DB integrated into IBIS program developed by AMRTA and sold/circulated worldwide 1991 to 1997, to present. The term “Toxidrome” I used to classify and differentiate plant toxicity, developed based on Howard Mofenson’s teachings at NCMC in 1980, was rewritten based in pharmacological activity and a receptor-based classification system developed for the time, defining about 45 major phytochemical toxidrome classes for more that 300 herbal medication species, genera and groups found in OTC nutritional supplements (taxonomy and classes have since expanded). The term toxidrome was popularized and became a standard in the field by 1993 due to this innovation. It was integrated into course materials and book for a university course titled ‘Plantae: the Evolution of Plant Chemicals’, 1993, and is a term now common to phytotoxicology web pages. The IBIS was re-released by its original 1992 patent/copyright holders on January 1, 2013.
.

November 14, 2011 at 6:34 pm
Hi Brian – enjoying your blog for several reasons, especially your focus on the history of medicine and also your forays into silhouettes and the physiognomy/physionotraces. I look forward into moving through your resources on the physionotrace. May I link to your website (or specific blog pages) if I write a blog post?
can’t find an email on this blog to send this comment, so I apologize that I am am posting this comment on a public page.
Thanks, Lauren… hoping that someone makes a physiognomy bust one day 😉
November 16, 2011 at 1:30 am
A link to my website is more than welcome–I think I have been to your site as well.