.
Biography
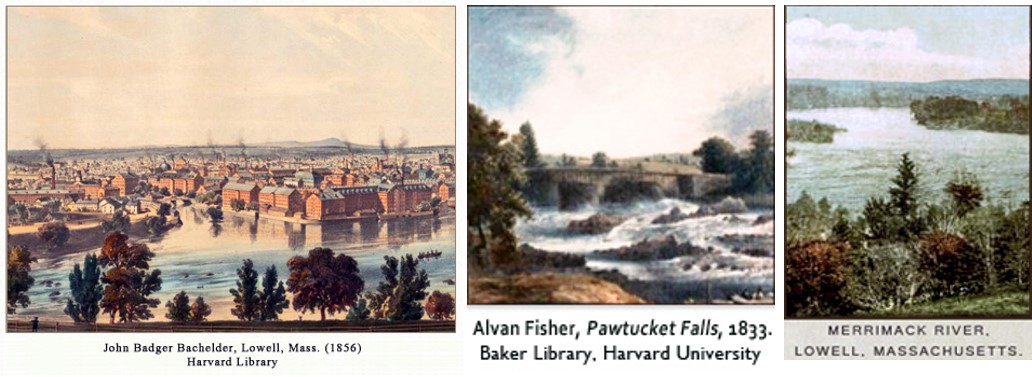
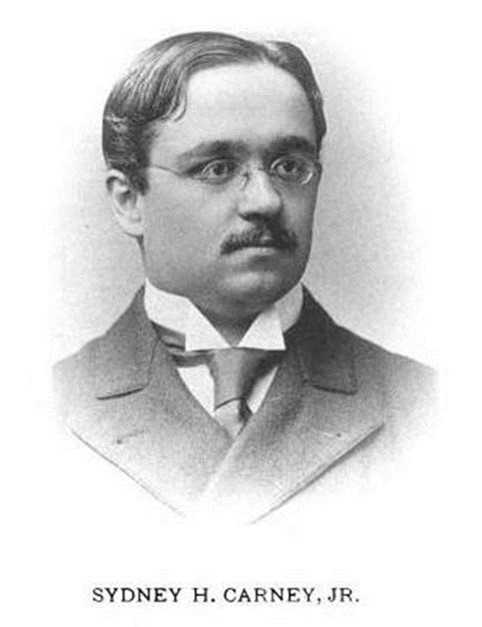
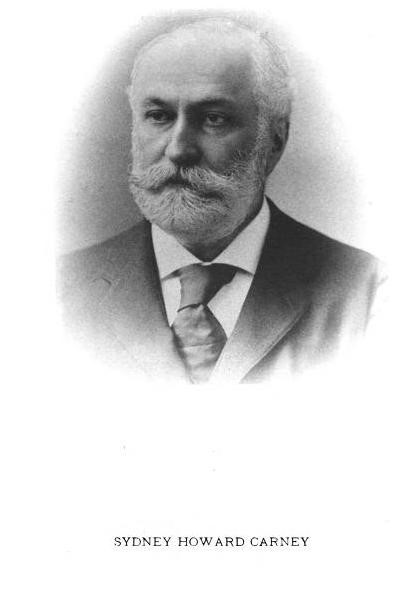
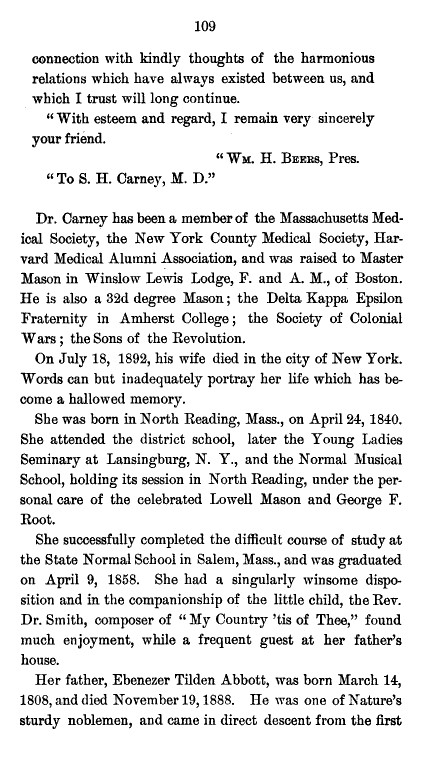
Born in Lowell, Massachusetts on August 24, 1837, Sydney Howard Carney grew up in a fishing town near the Merrimack River. He attended the local North Grammer school and then to Lowell High School. He entered Amherst College in 1854 where he attended classes for a standard bachelors program. During his senior year he attended the “Tremont Medical School” program offered at Harvard Medical School as a summer program, and within a year became fully involved with this program. By 1860, the age of 23, he was attending the actual medical school at Harvard, where he served as a “house pupil” at Massachusetts General Hospital. About a year later received an MD degree from this program.
In 1861, Dr. Carney began work as a resident physician at the alms-house in Bridgewater for about one year. Working alongside him was Dr. Henry I. Bowditch, a famous medical topographer and disease mapper who focused on climate and topography for much of this work. His most famous work and important contribution to this field came a few years later when he wrote a detailed paper on consumption and its relationship to specific soil types in Massachusetts.
In 1862, Dr. Carney opened an office and married very soon after Hortense Tilden. With the Civil War brewing down south, there was a call for volunteer surgeons. Receiving news of this both he and several other associates in his field complied and began their services as military surgeons. After making their way down to Washington, D.C., Carney’s service ended up being quite short due to the unwillingness of both sides to fight where he was to serve. But during his time down there, however, he had the chance to visited the hospitals and attended to the needs of some of the Massachusetts soldiers housed in these facilities.
A period of inactivity then ensued, during which time he returned to Boston, Massachusetts. He was there only briefly, however, for soonafter his services were again requested by Washington. This time he was to serve at the Battle of Antietam, where soldiers were treated in hospitals built from barns.
After the war, Carney returned to Boston and became Sanitary Inspector for the city. He worked as well in the Boston Dispensary during this time. By 1867, he was appointed surgeon general for the Travelers’ Insurance Company of Hartford, Connecticut, working out of Boston office for the next three years.
In 1870, Dr. Carney moved to New York City to initiate work with the New York Life Insurance Company. From 1870 to 1894 he served as Superintendent of the Agency Medical Department and Associate Medical Director for this company. His primary responsibilities during this time pertained mostly to heading the teams developed for investigating fraud and unusual medical claims. As part of this position he analyzed the death records and medical files for large populations, and after a few months was able to produced his first maps of the endemic diseases throughout the United States. Following this activity, he remained active as an investigator and served in several legal trials of fraud accusation, one of which was published in detail. His final years with the insurance company ended with some legal actions by him against his company due to a financial disagreement.
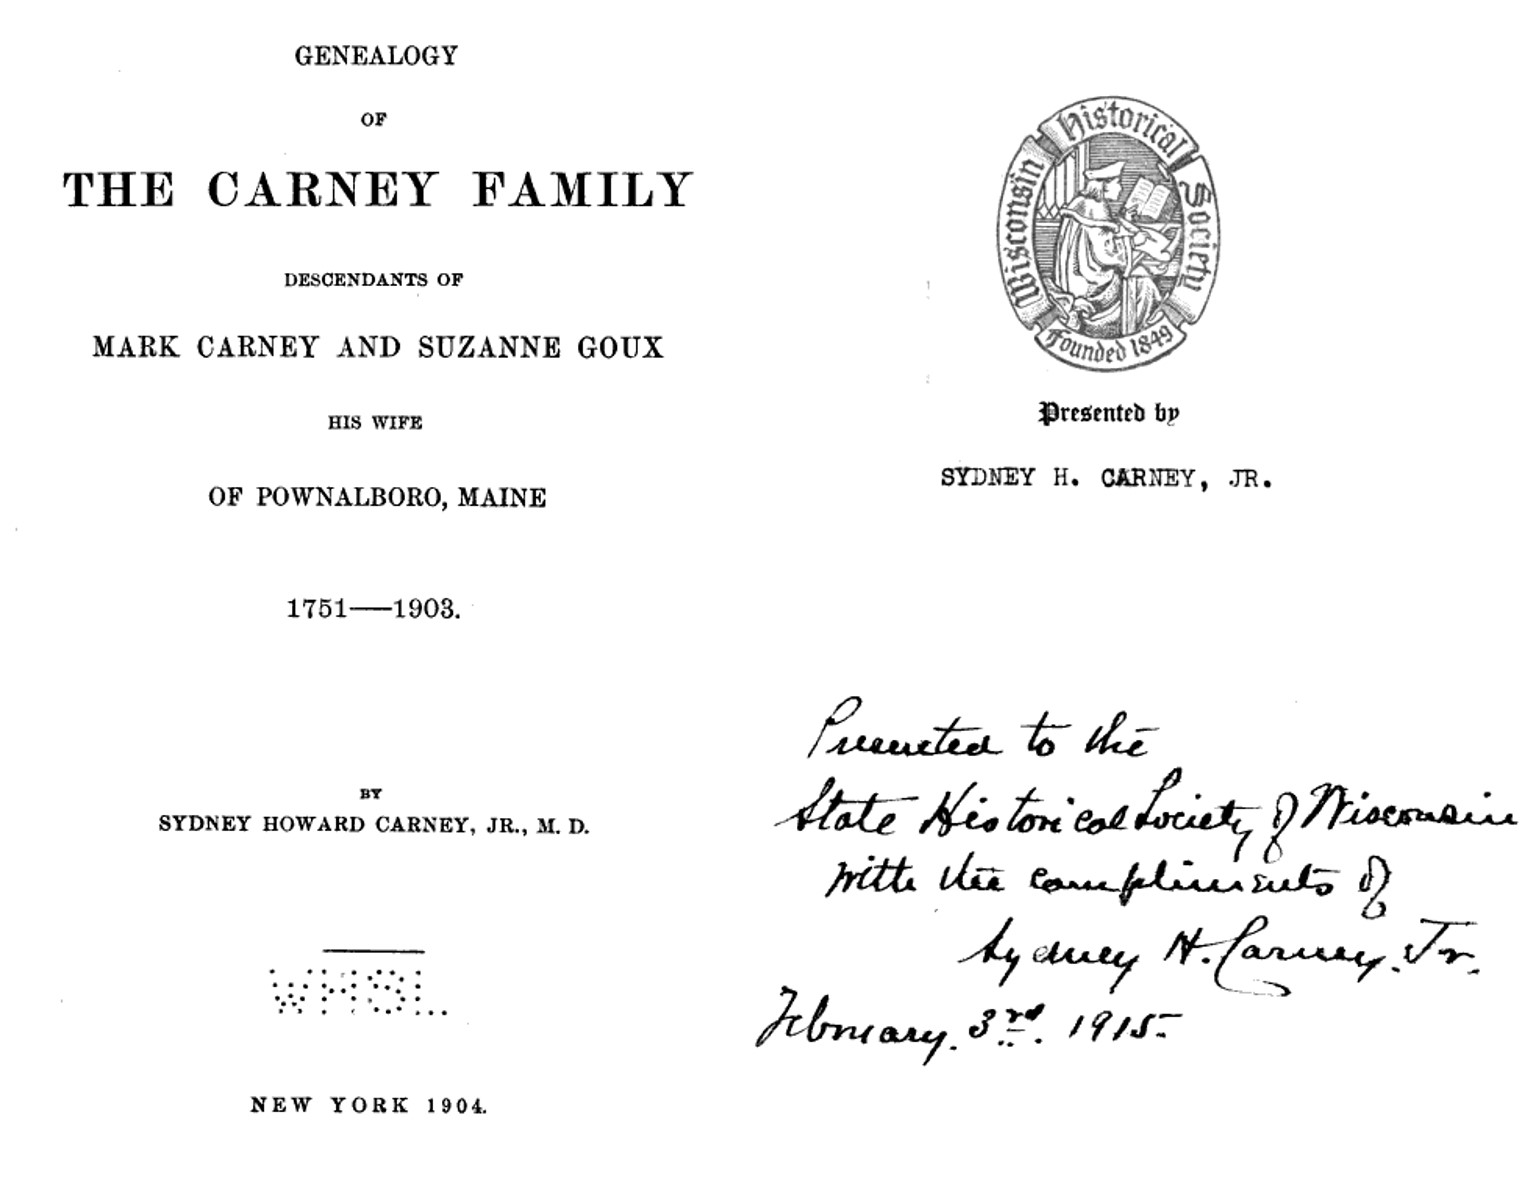
Dr. Carney’s son, by the same name, attended Harvard Medical School like his father, and became an important contributor to the New York Historical Society as a medical historian. His other activities included his devotion to patriotic colonial and post-colonial movements of the region. In a study of the family genealogy he later carried out, he documented this history in the form of a family genealogy book published in 1915. (See Appendix for his and his father’s biography.)
.
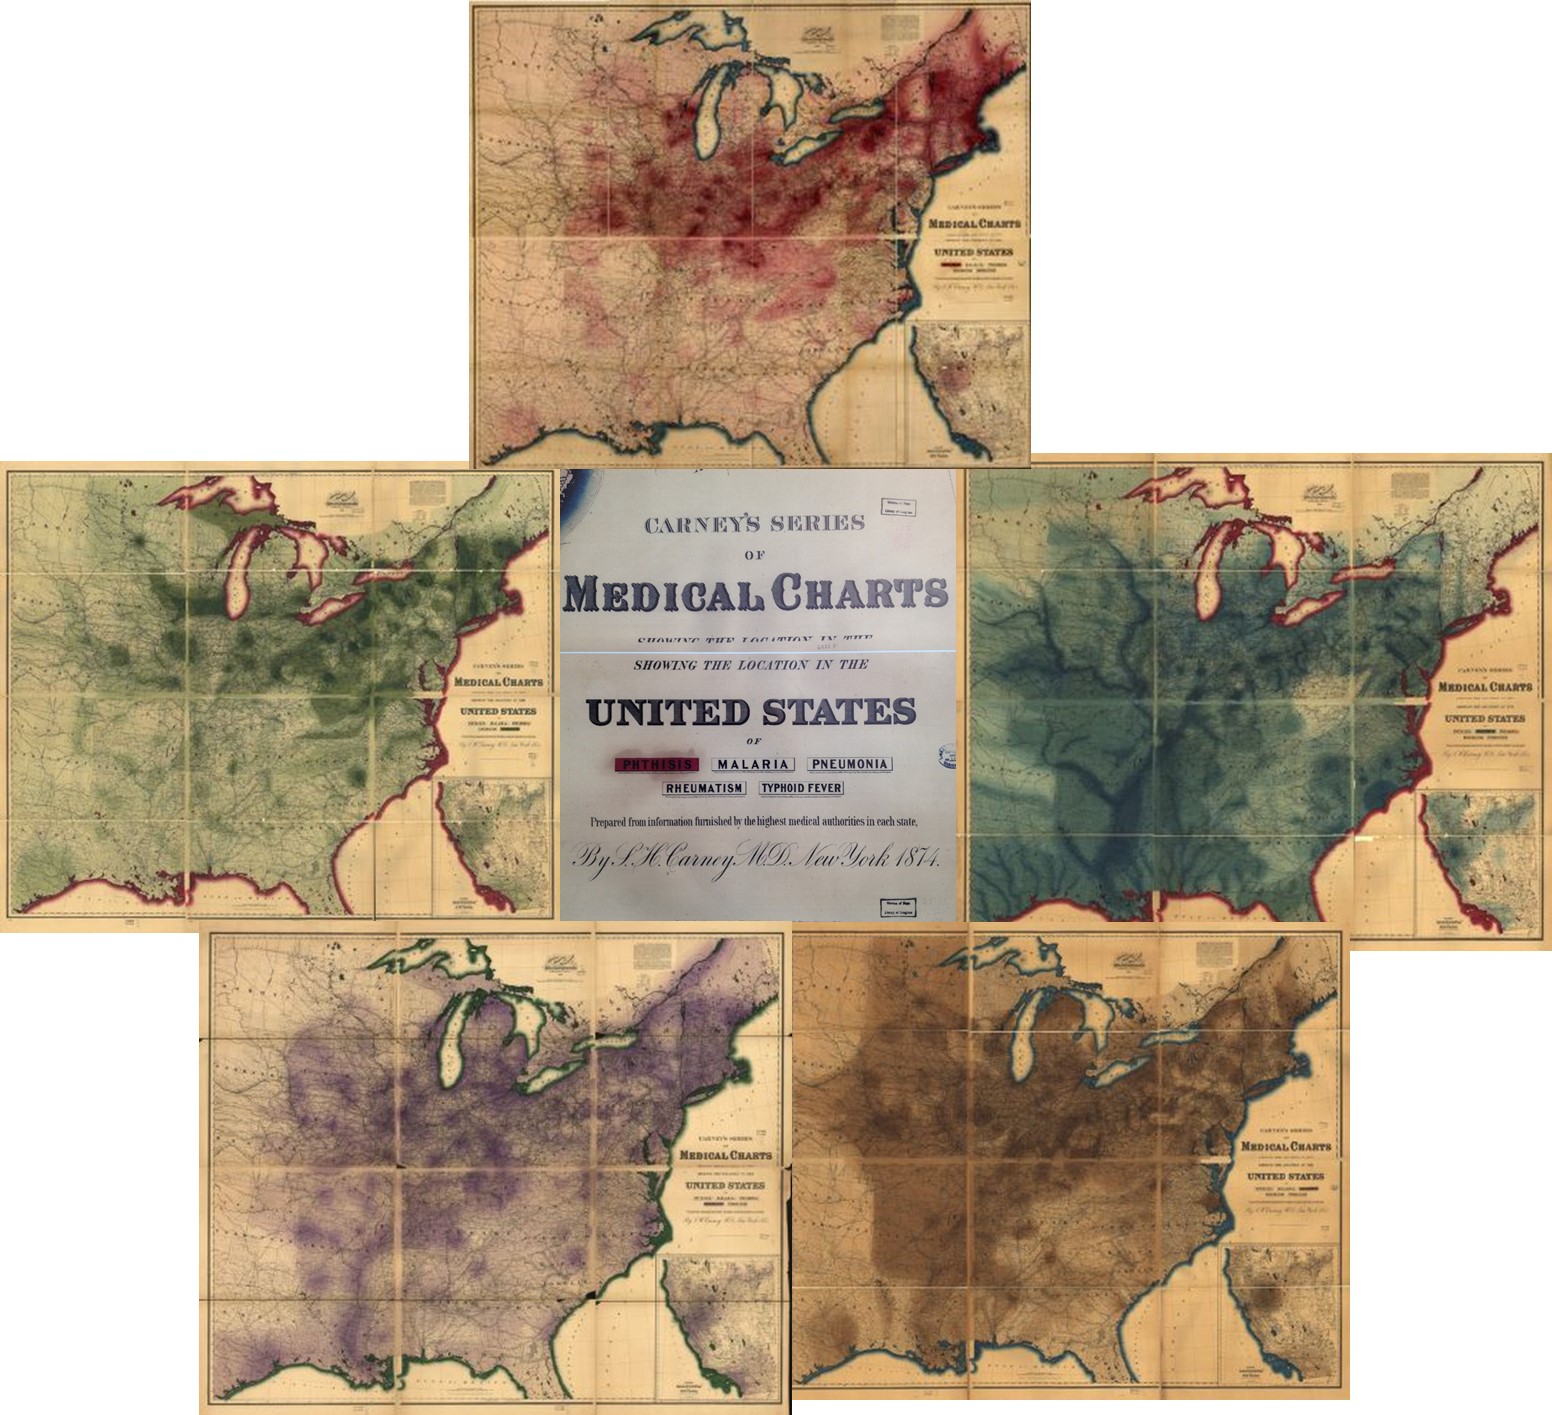
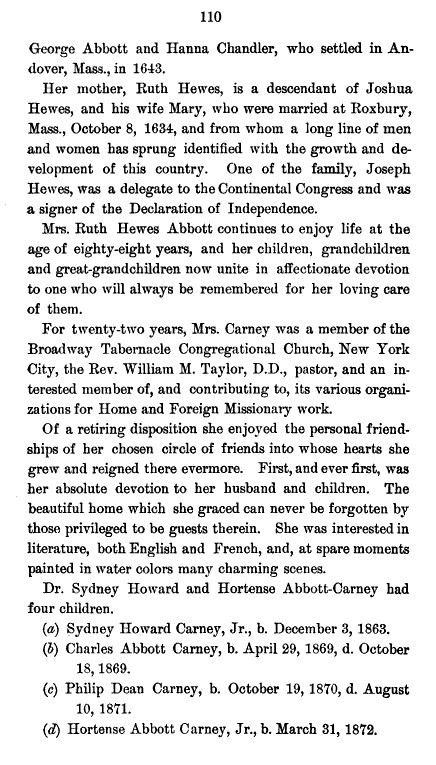
Clockwise starting from the top: Phthisis, Malaria, Pneumonia, Rheumatism, Typhoid Fever
The Medical Charts
Dr. Carney learned medicine during the late 1850s. During this time, William Farr published his works on the geography of cholera in related to land surface elevation, the effects of population counts and density on disease patterns, and a new nosology or means for classifying diseases that focused much more on its manner of spread, the results of numerous studies on disease climatology and topography, and the results of vaccination programs underway.
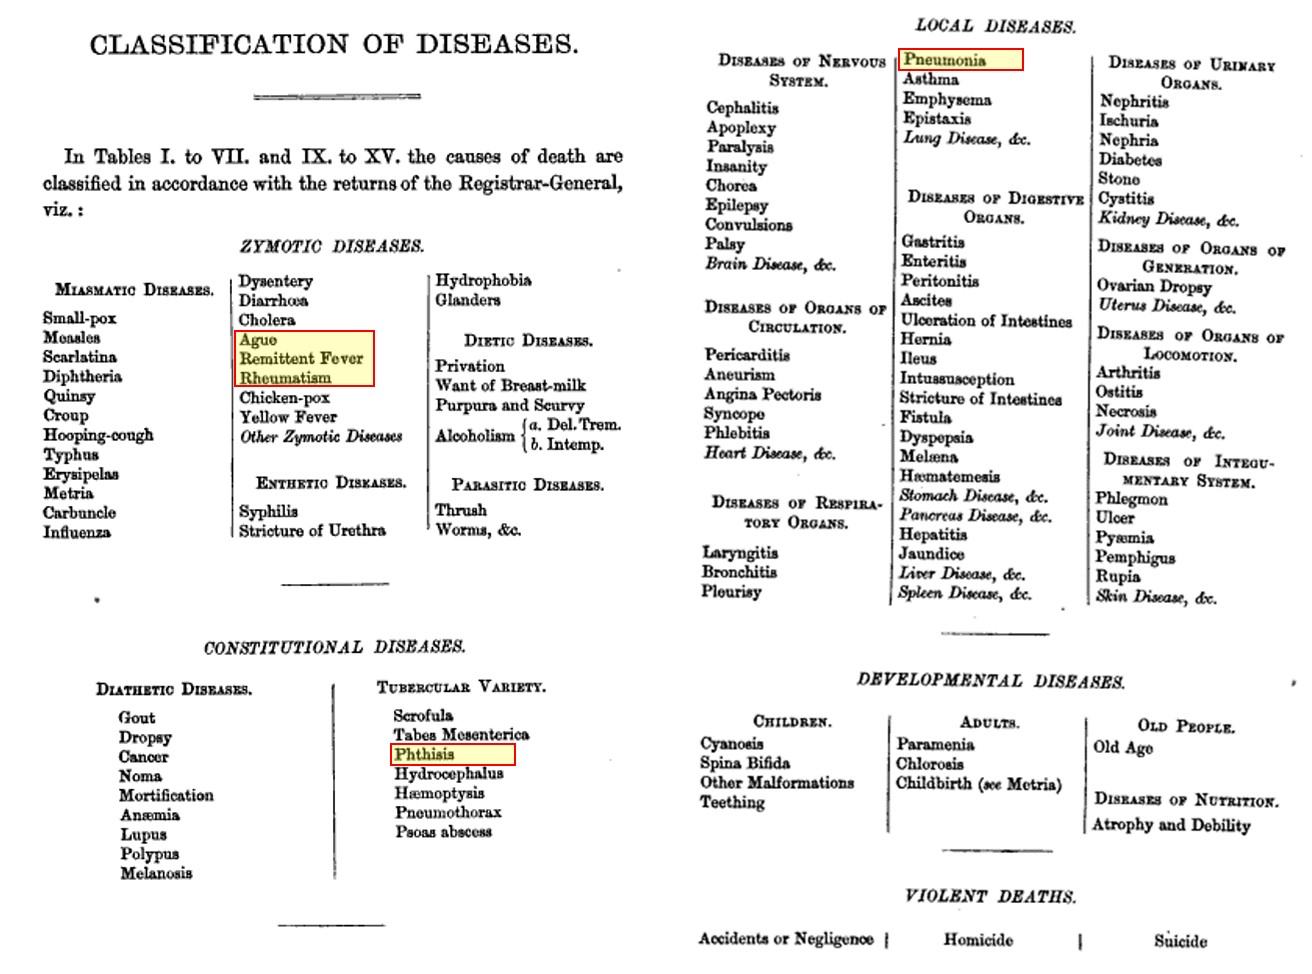
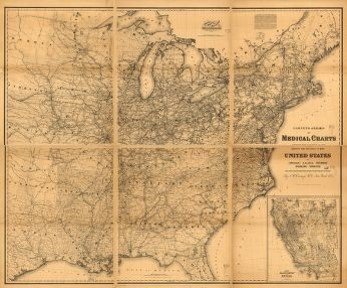
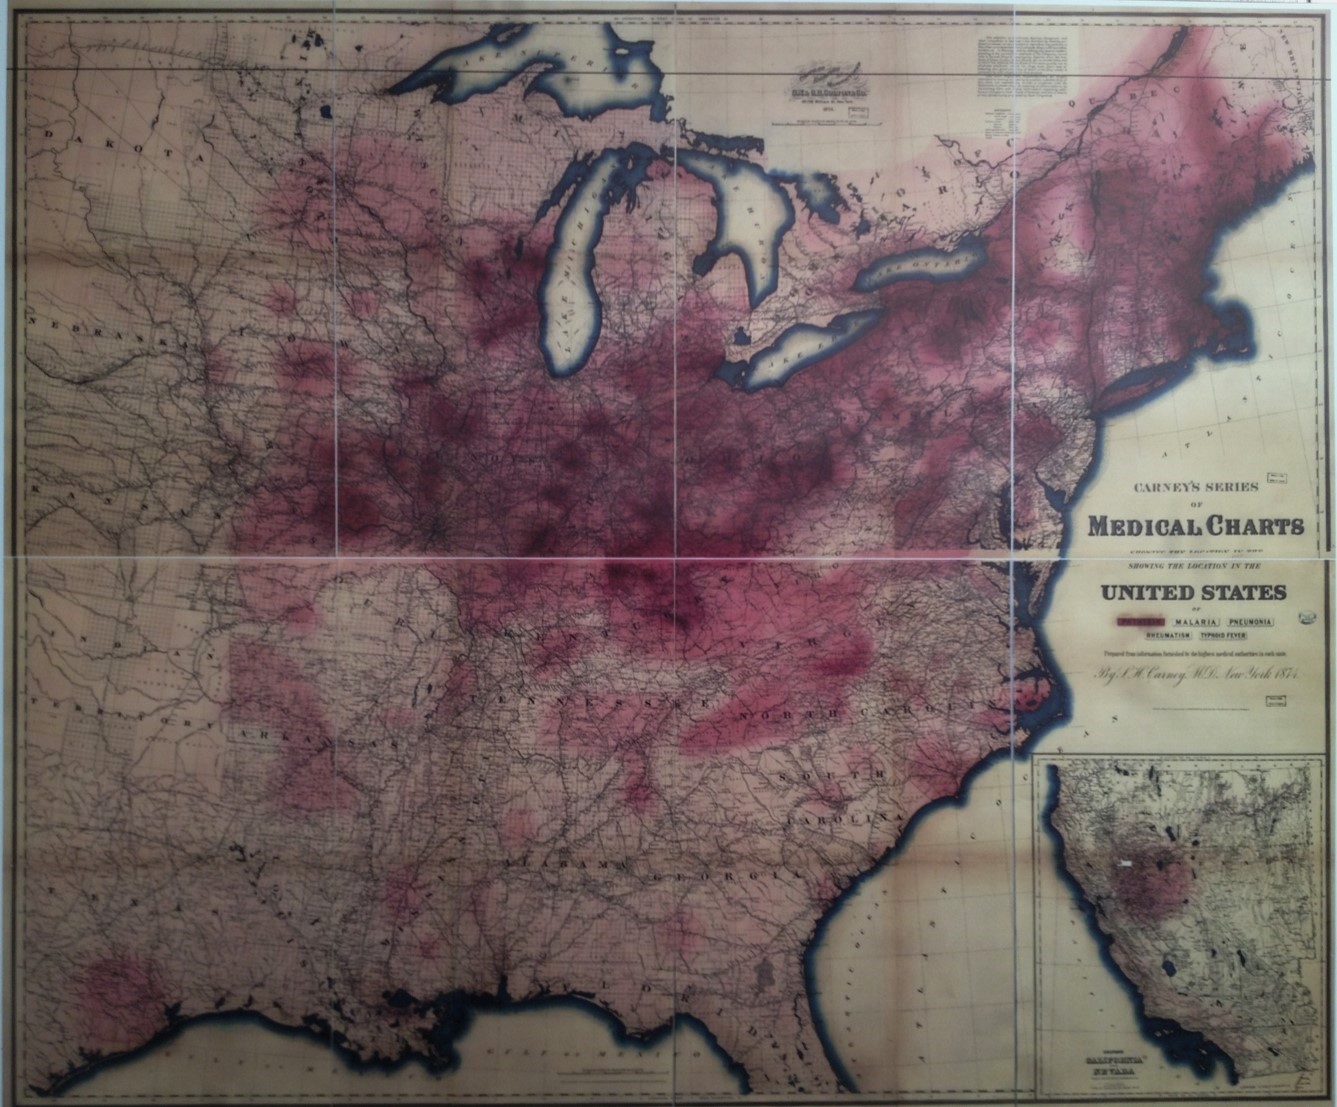
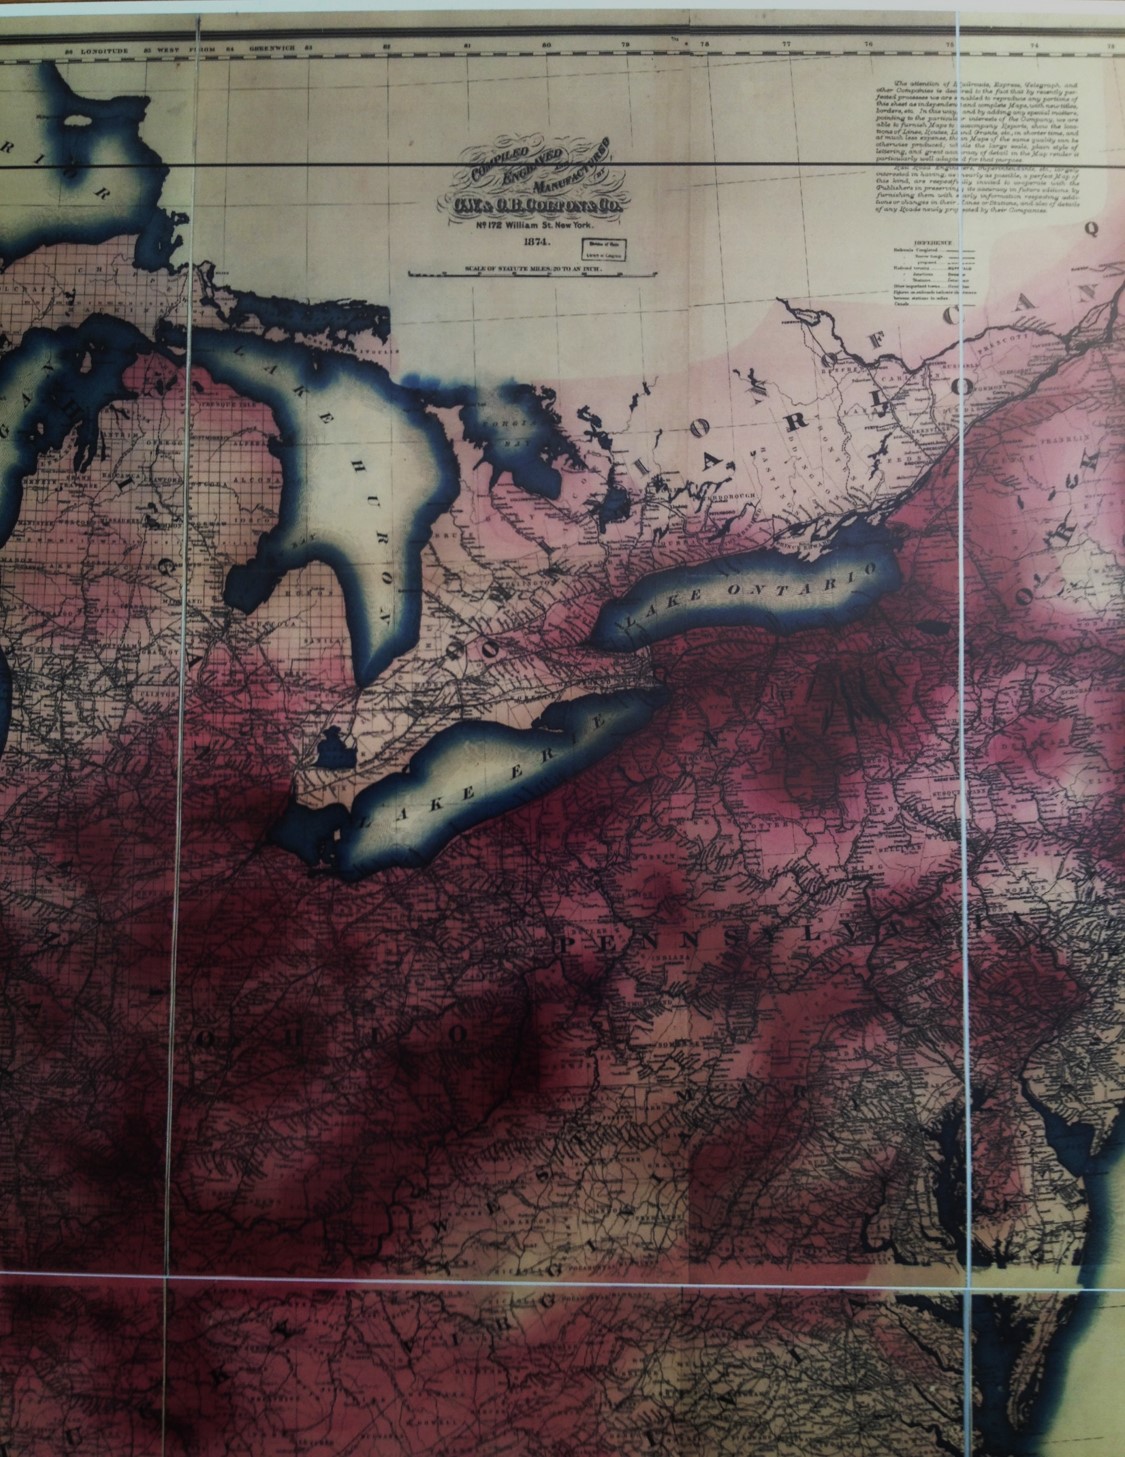
Five medical charts were produced by Dr. Sidney Howard Carney, Sr. of New York in 1874. These charts were on Phthisis or Consumption (later called Tuberculosis), Malaria, Pneumonia, Rheumatism and Typhoid Fever. In terms of their relationship to each other and their nosology, he mapped those diseases highlighted in the list from Aitken’s first edition of Handbook of the Science and Practice of Medicine (1863, vol. 1, p. 176).
.
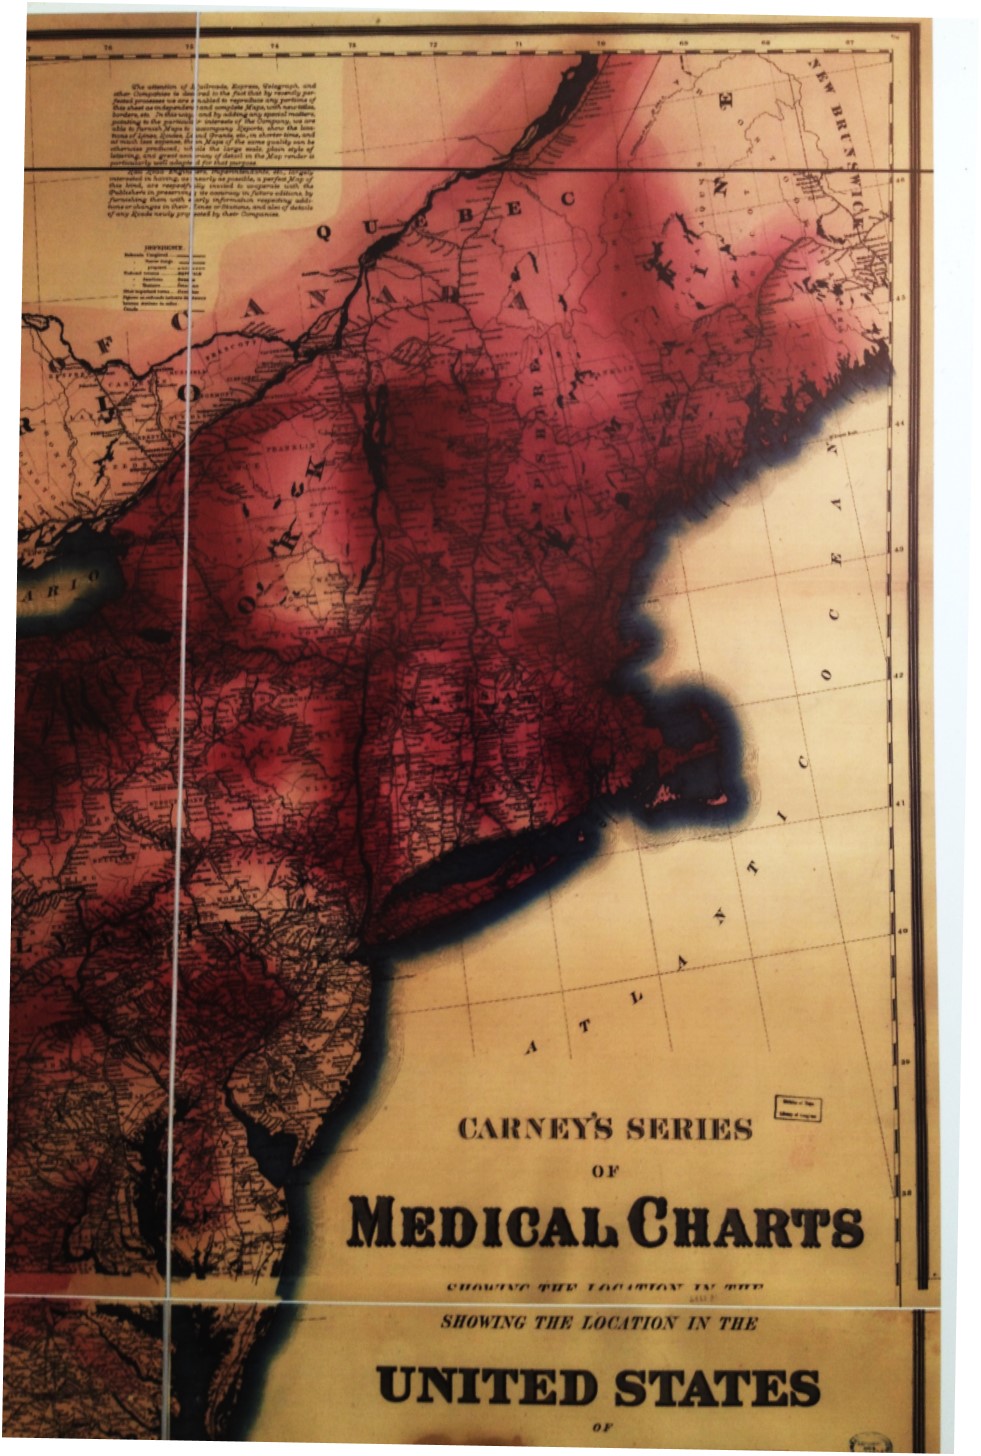
In the note contained on Carney’s map, he suggests some intentions for these maps–the target–the wishes and needs of the railroad companies, which Insurance companies tended to invest heavily in.
All of this in retrospect suggests a reason for these maps, and a good reason for the following statement he included on each of these maps.

Carney was a physician working for the life insurance industry. The maps he produced were for the purposes of this industry, not public health in general or some basic epidemiological purpose. These maps were intended to serve the insurance industry and their clients–the railroad industries.
So how did the production of these maps come about?
Diseases like phthisis (tuberculosis) and pneumonia had strong association with the topography and weather, Work for this industry exposed employees to the extremes of weather in these settings, especially regarding solar heat and light, temperatures and humidity. Fevers like ague (malaria) and remittent (which includes typhoid) were well correlated with certain environmental settings at certain times of the year; thus they were of importance to railroad companies in terms of where the greatest risks might exist along the railway routes being laid. Rheumatism was a consequence of fevers, but more importantly a major cause of reduced productivity on behalf of workers.
There were possibly other diseases as well of concern to the railroad workers, but yellow fever was pretty much concentrated around the highly populated east coast states, and cholera in densely populated settings in association with the other forms of diarrhea it was classified with for the time, a disease that strikes people of all ages.
The main disease group missing from his analysis of railroad workers was heart disease and the related dropsy (edema due to heart failure). We might also expect asthma and angina to be of concern, the first again more of an eastern United States disease pattern.
The above five maps, therefore, seem to depict five of the most wide spread public health diseases. All were organism derived, even though at the time the knowledge of these organisms was minimal at best. Malaria was the most recognizable animalcule disease during this time, but its relationship to mosquitoes couldn’t be uncovered for another decade and a half. Tuberculosis or Phthisis was also potentially deducible, or able to be suspected as being of fungal origins, but the understanding of fungi at the time was the limiting factor in this discovery. Typhoid fever was the next disease with the potential for a discovery as to its cause, being generated by a specific form of Salmonella bacteria, it too required the knowledge of bacteriology to be more fully developed before it could be shown to be bacteria generated around 1904. This leaves us with rheumatism, a medical condition associated with a childhood bacterial disease, a causality that would not be revealed for years to come. Pneumonia was differentiated from the other diseases once linked together as different forms of catarrh about a decade or two earlier. Because it had multiple causes, bacterial and viral in nature for the most part, it would be decades before its exact oncology would become understood and an effective vaccine working against it developed.
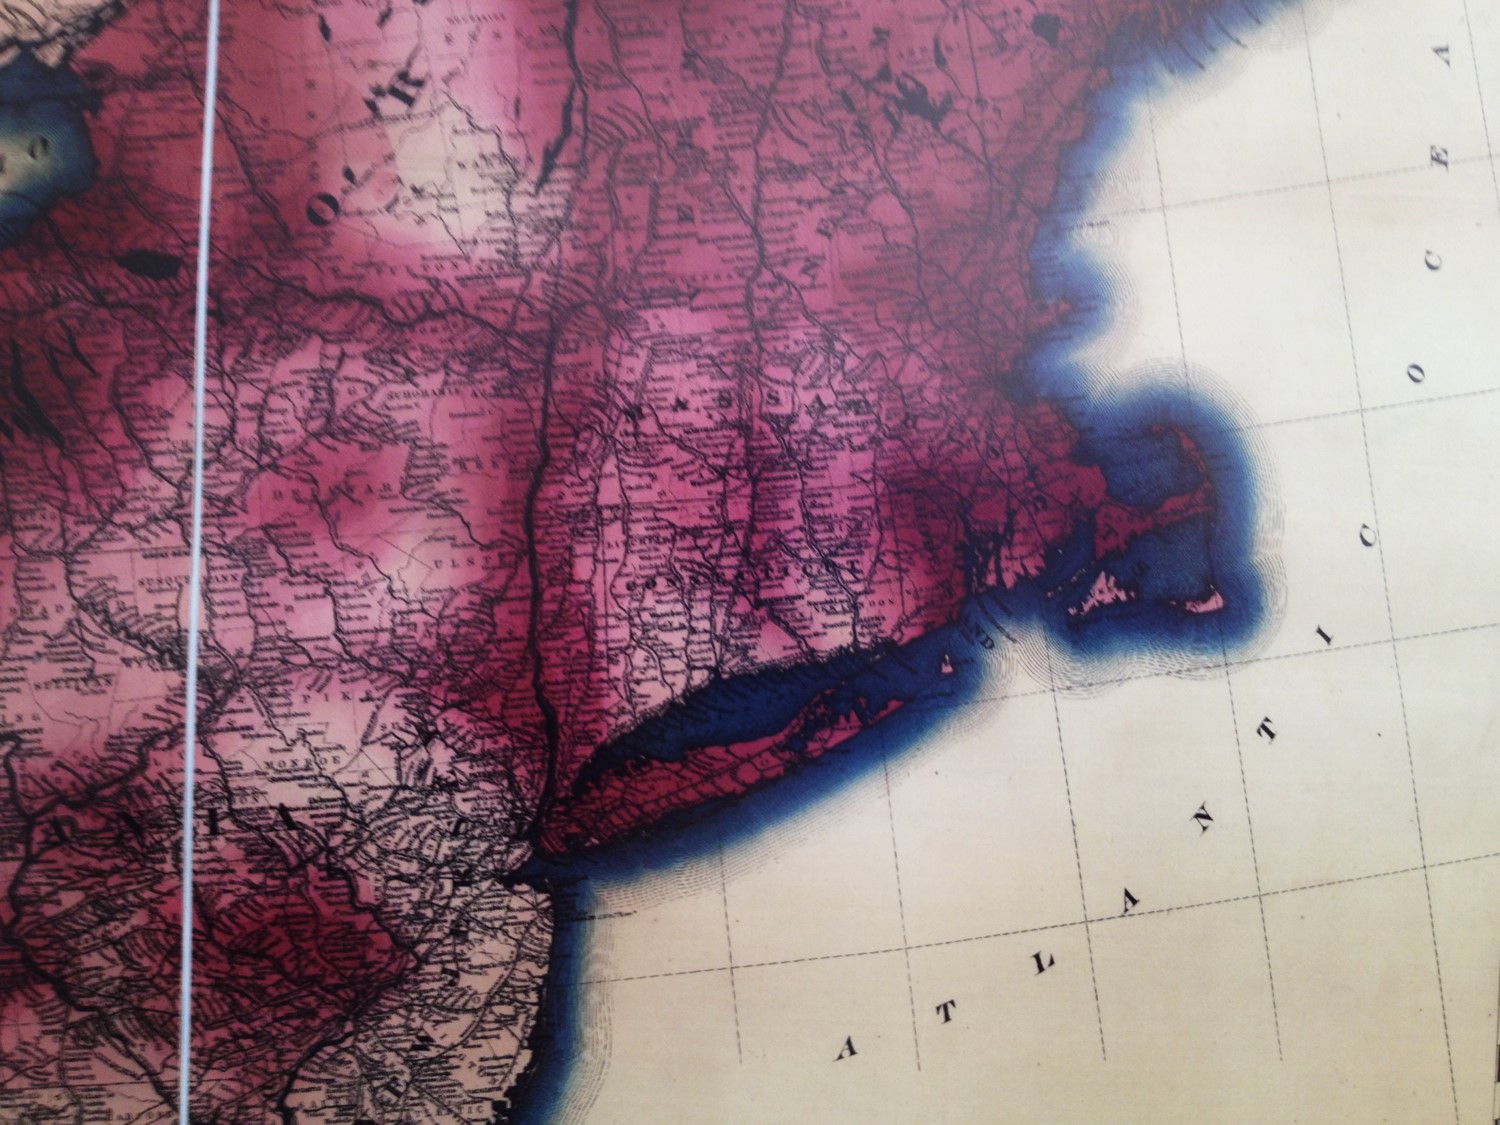
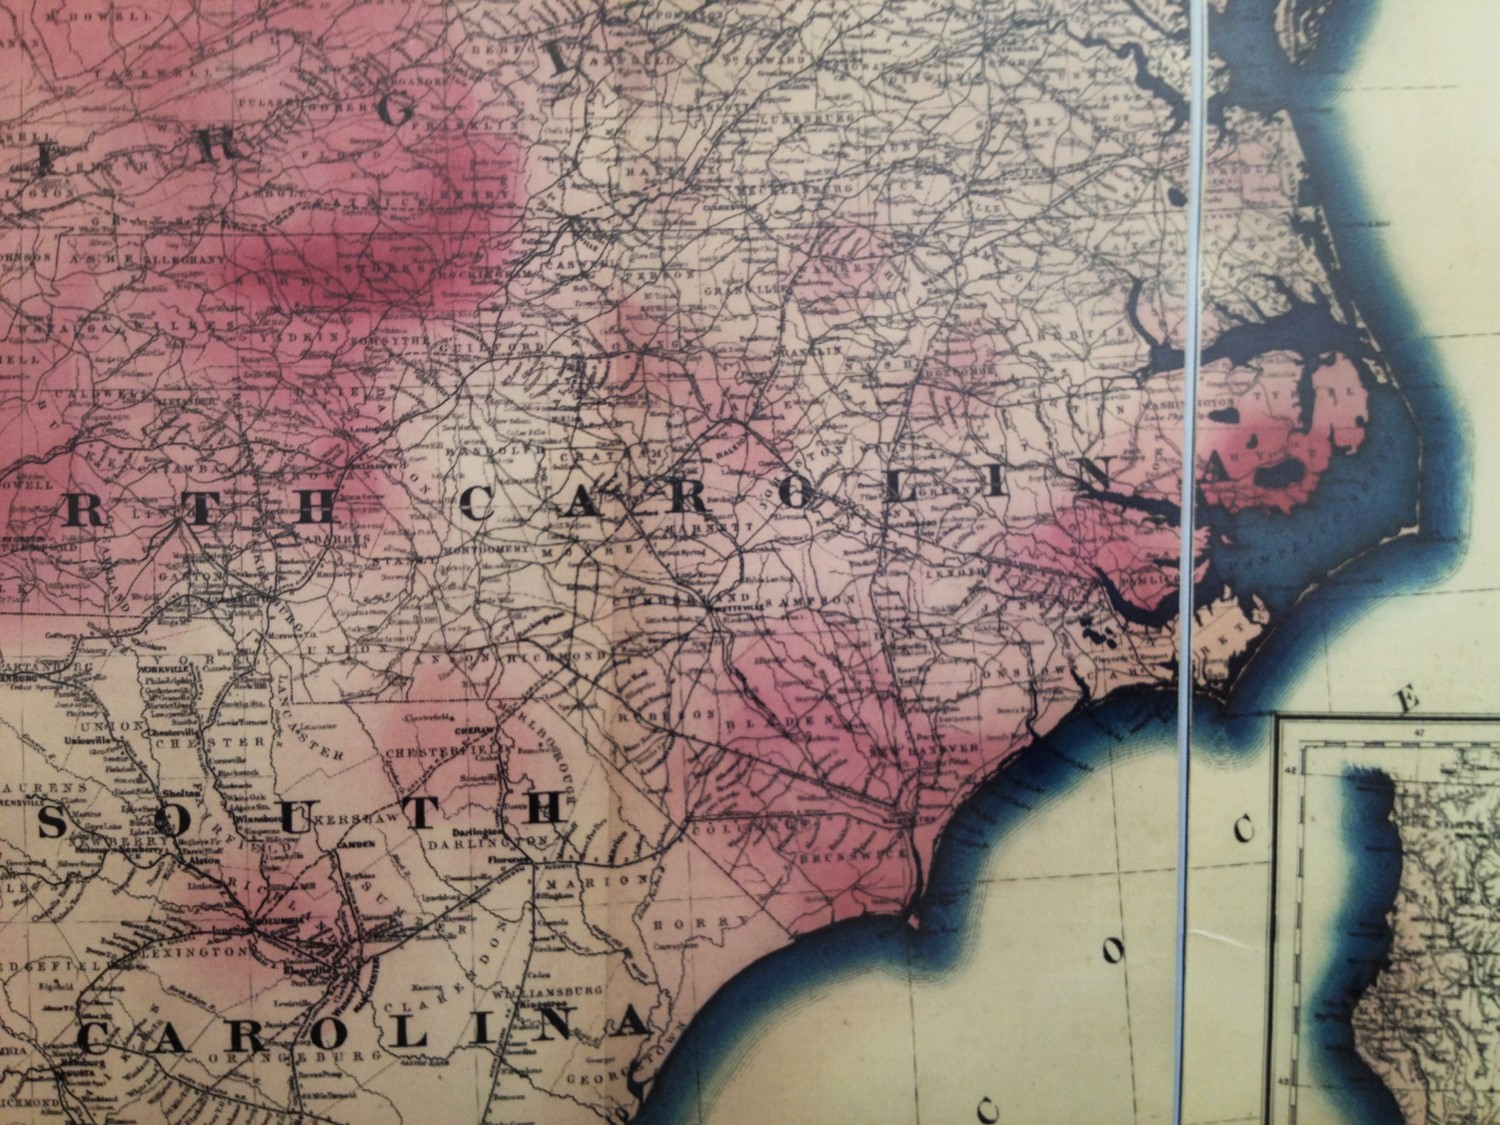
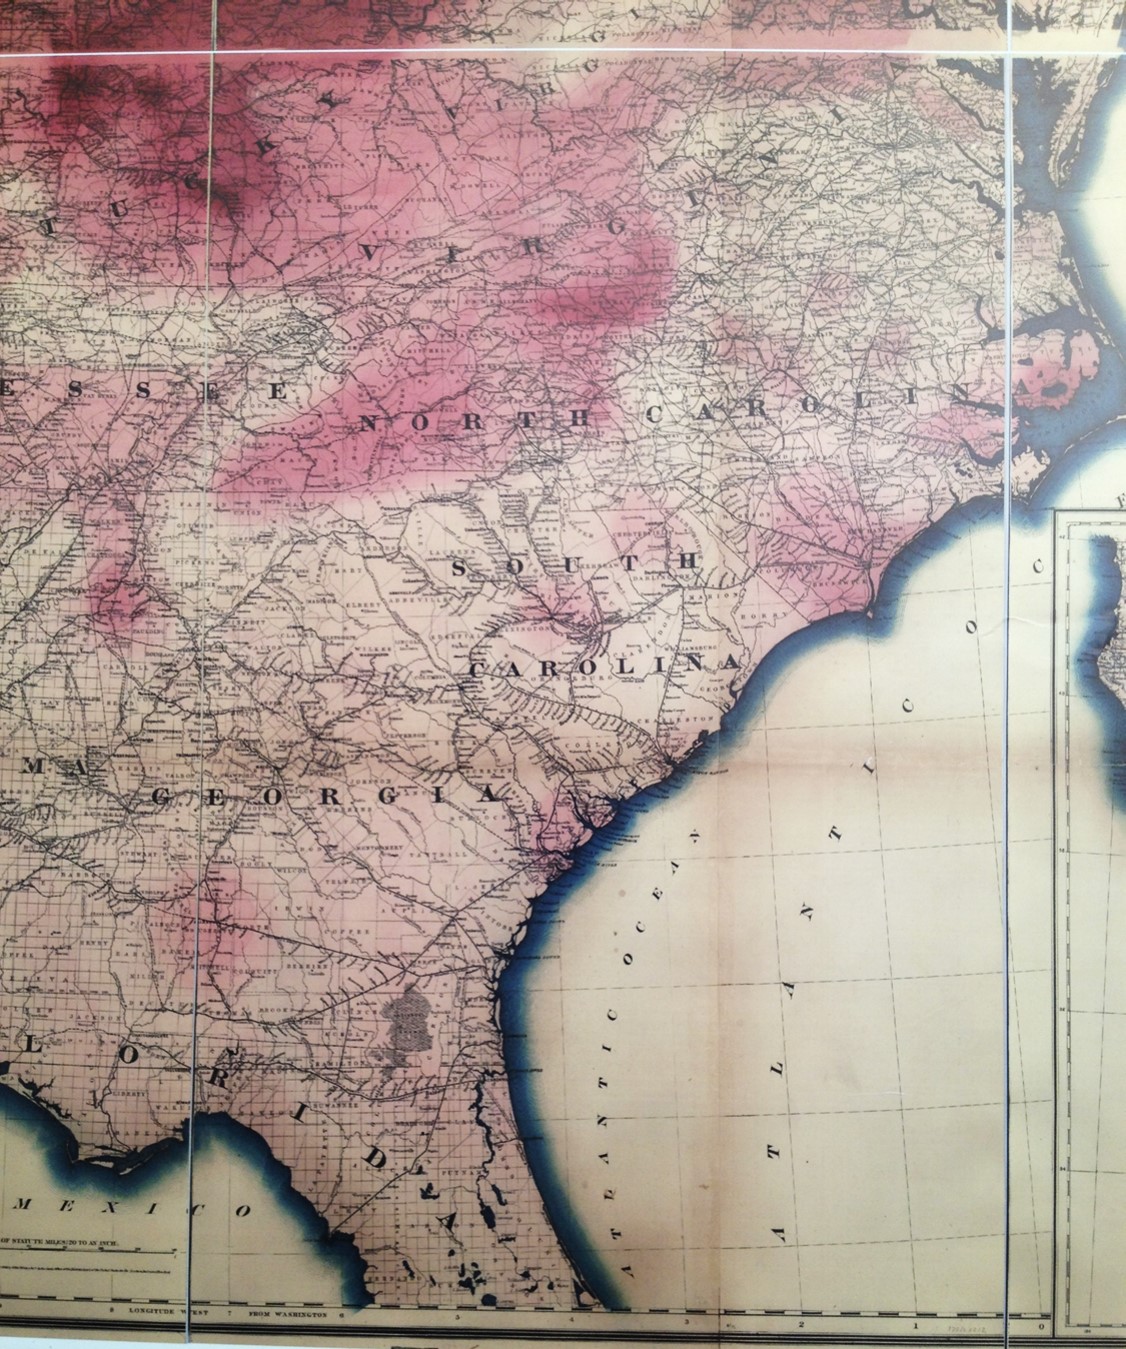
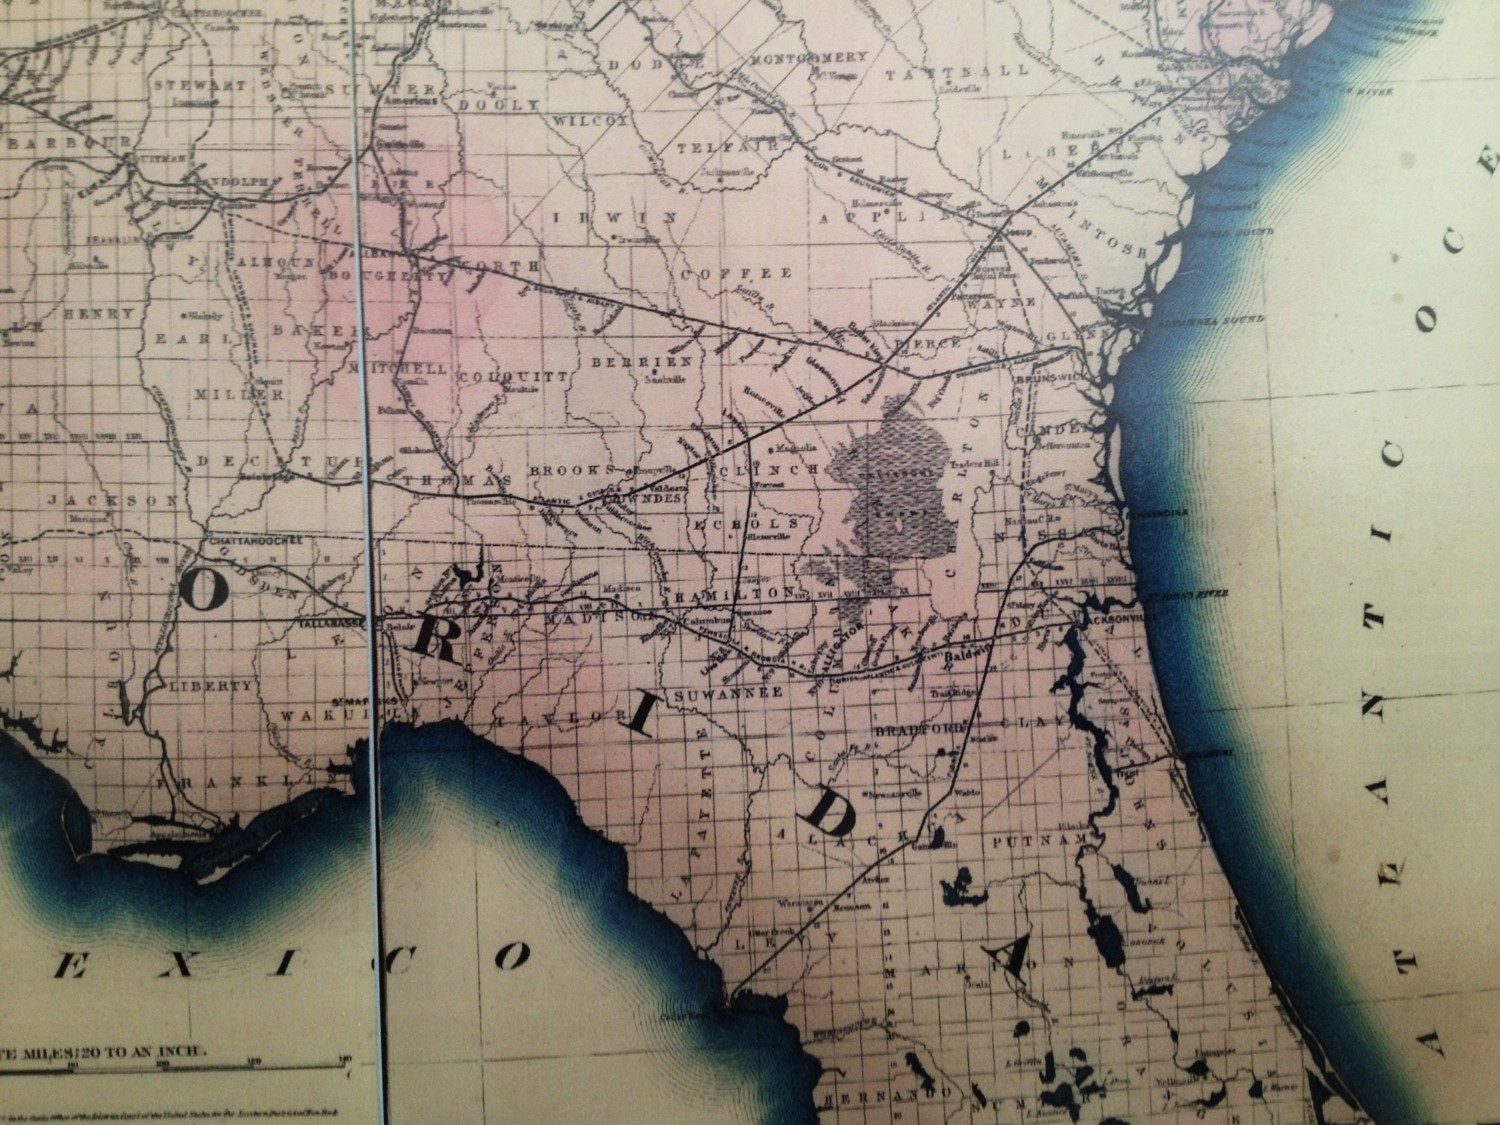
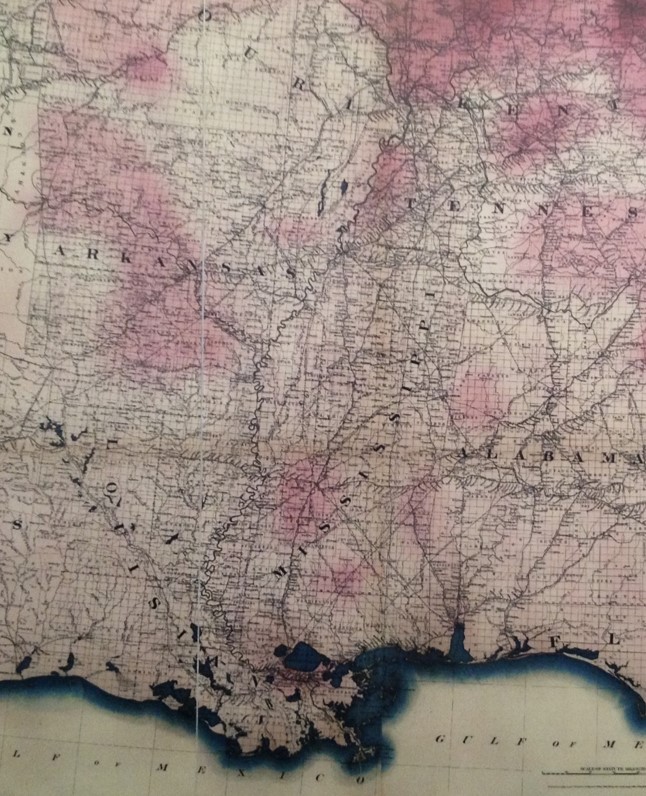
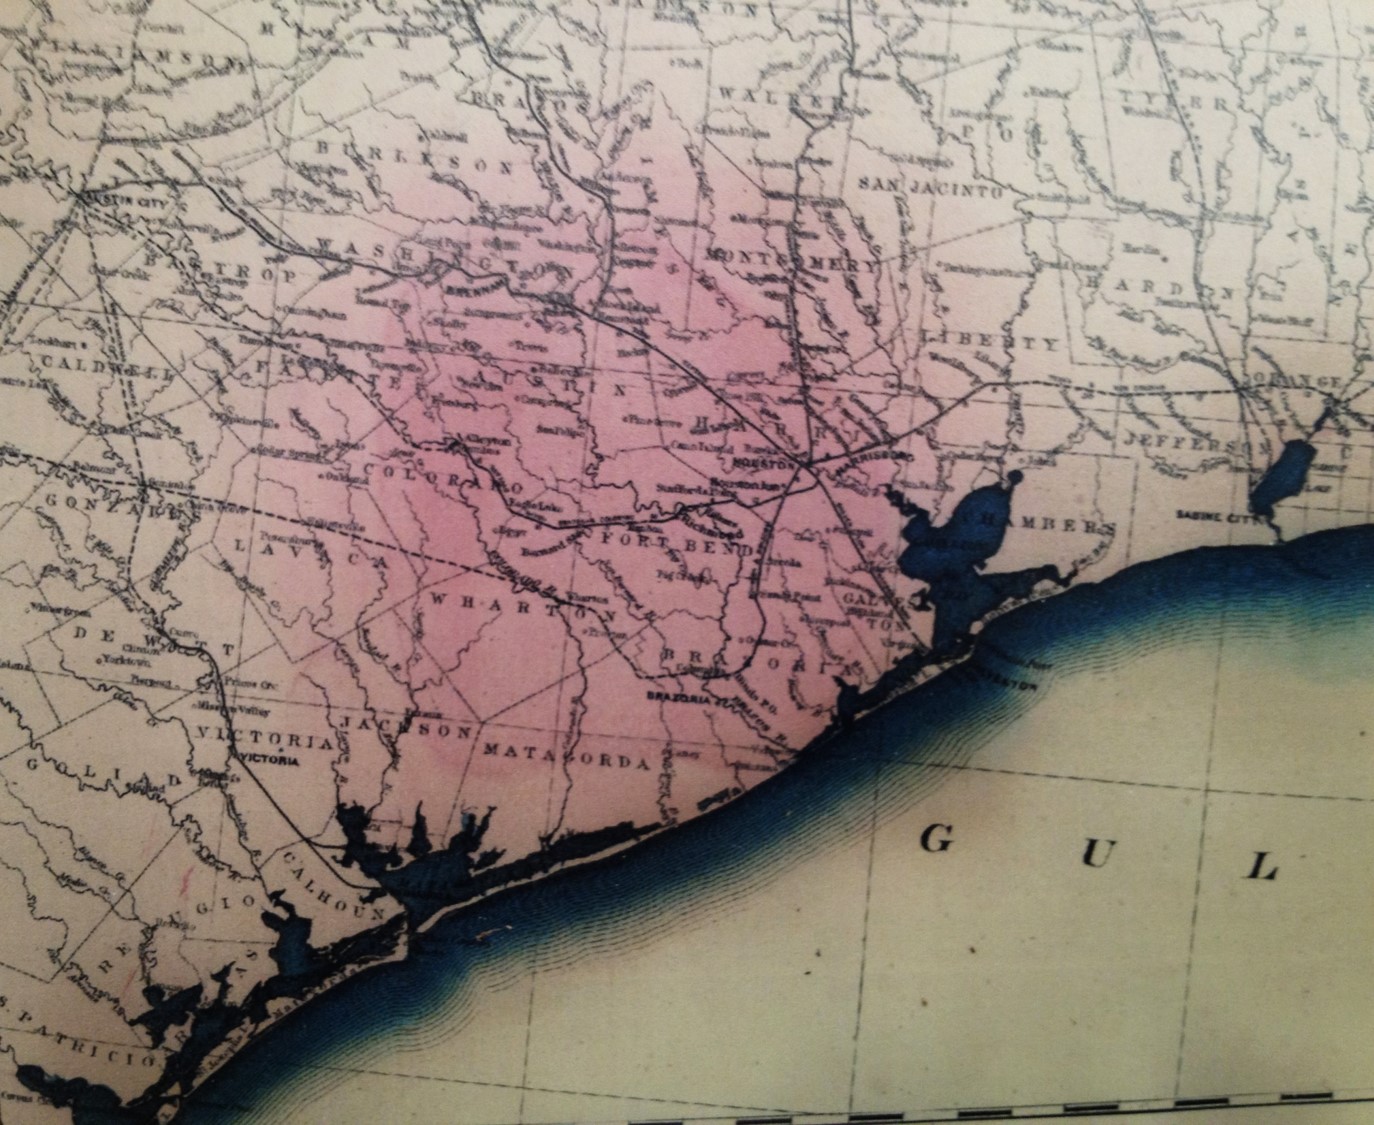
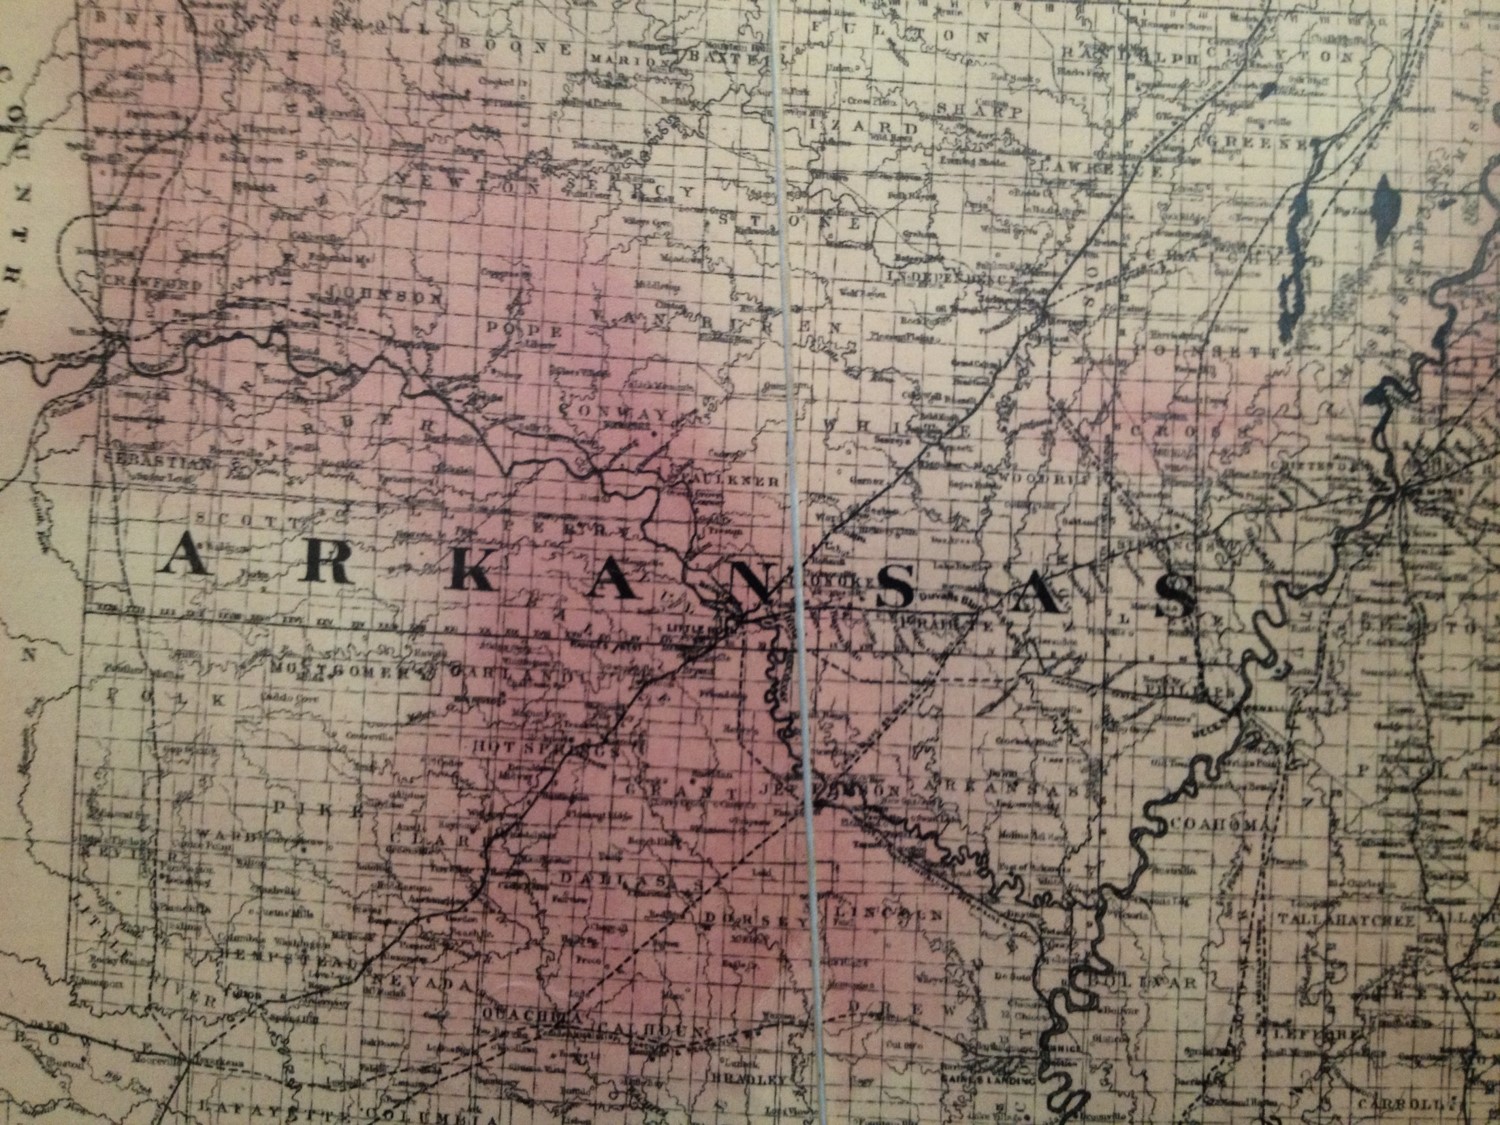
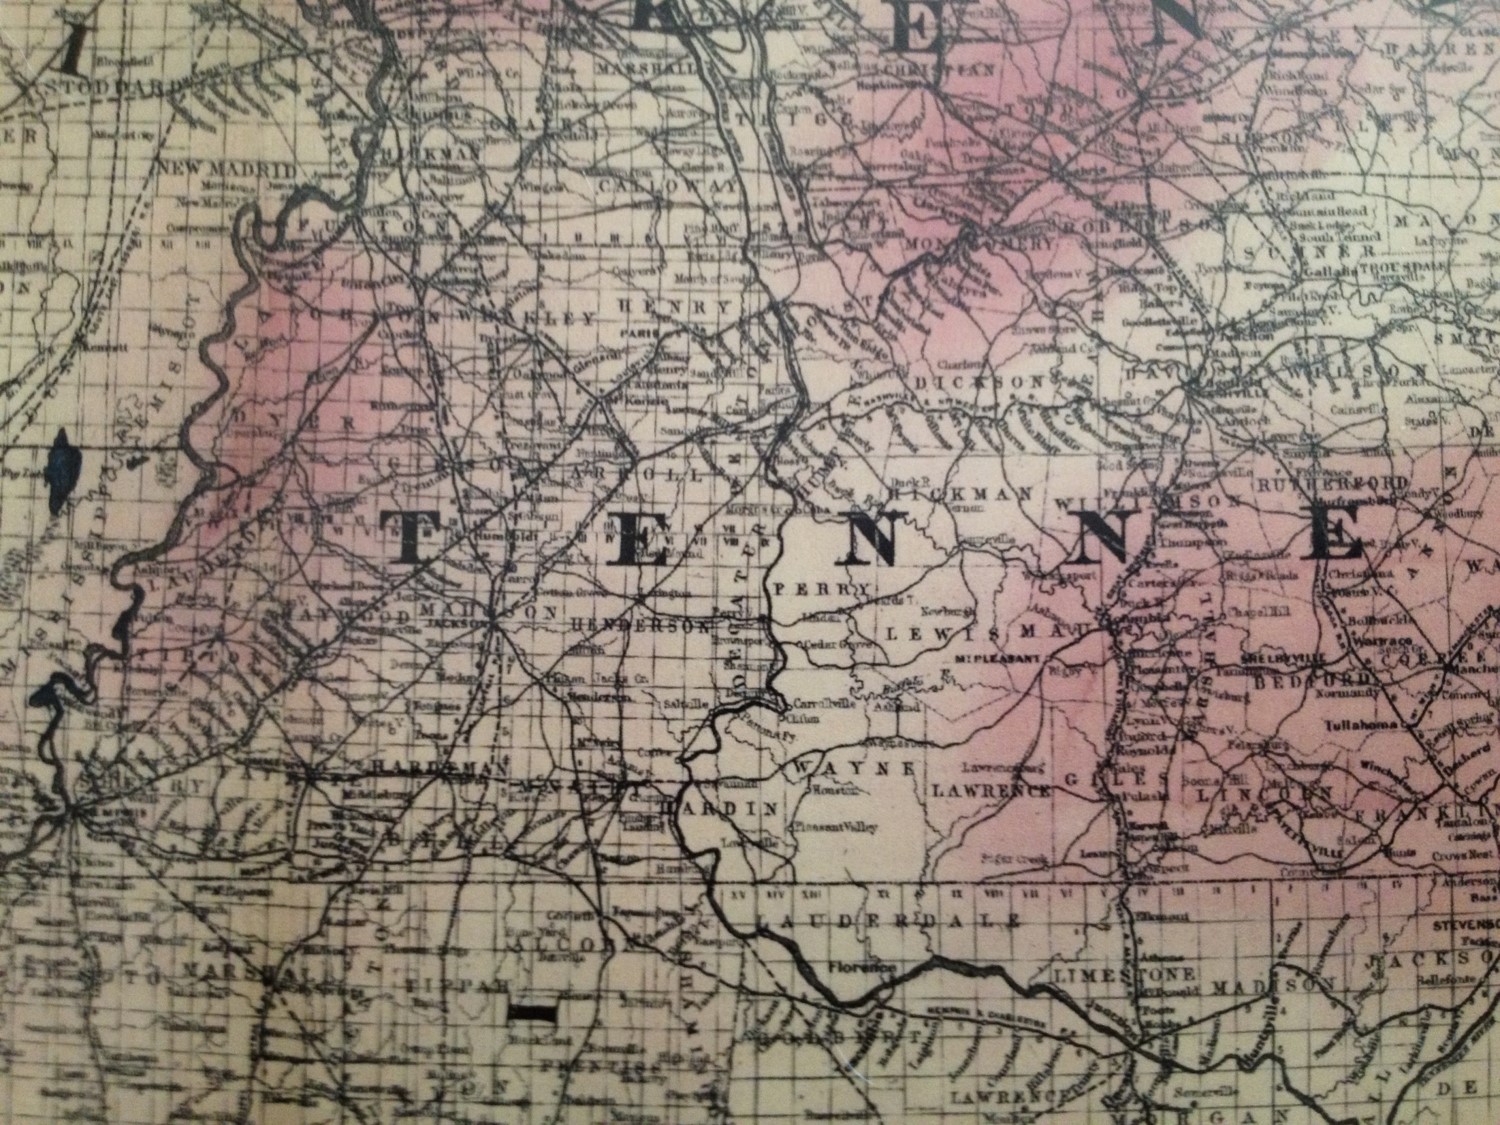
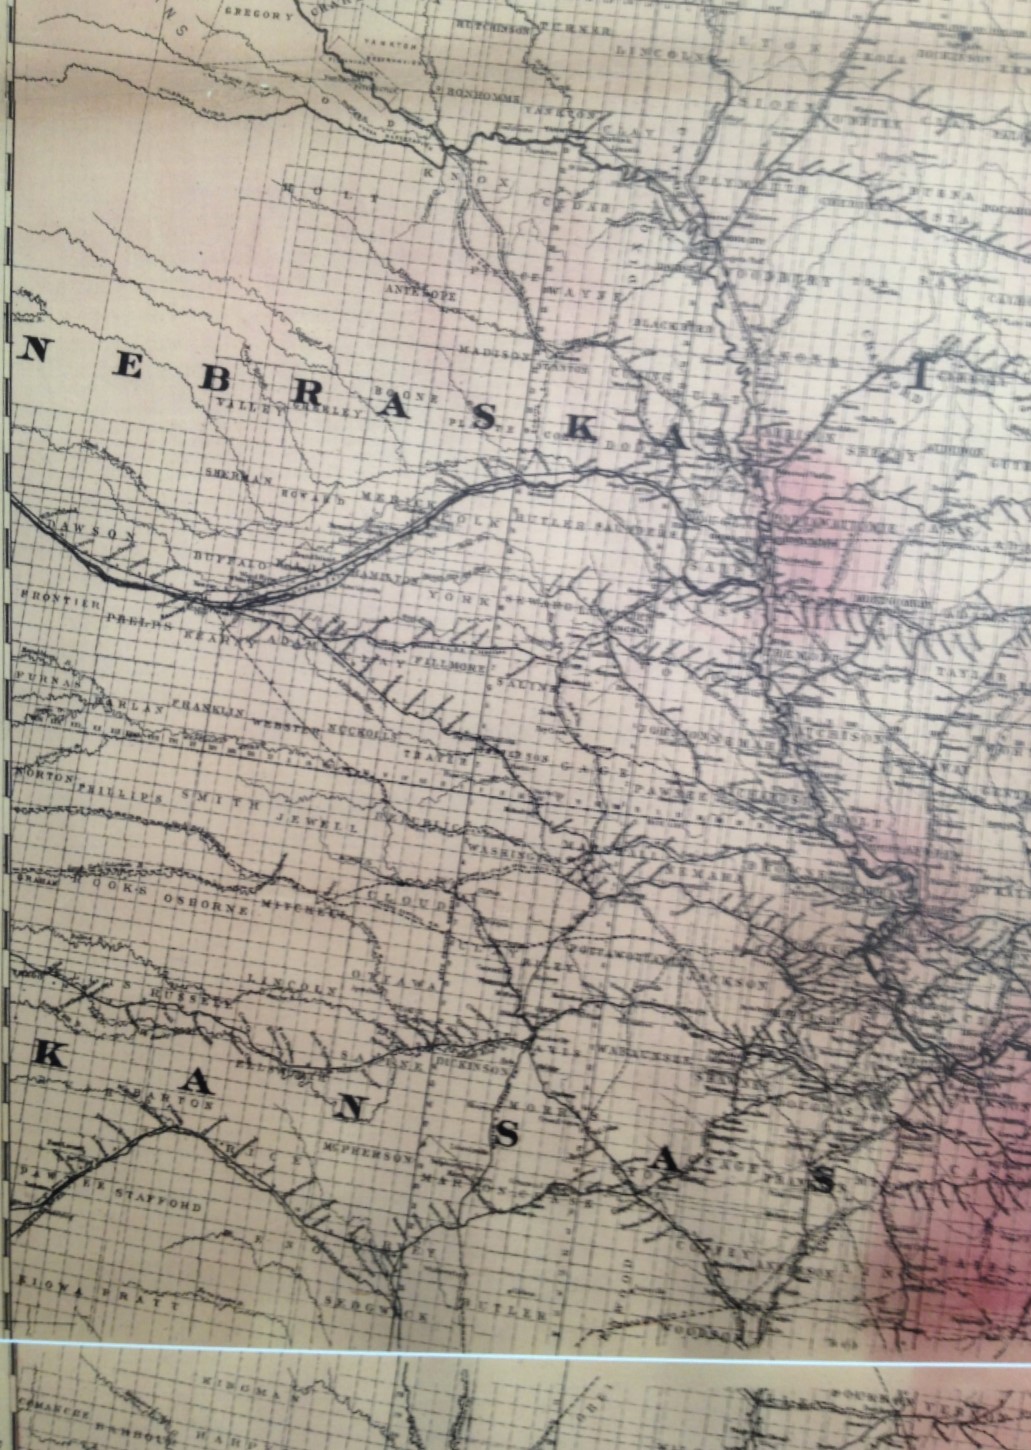
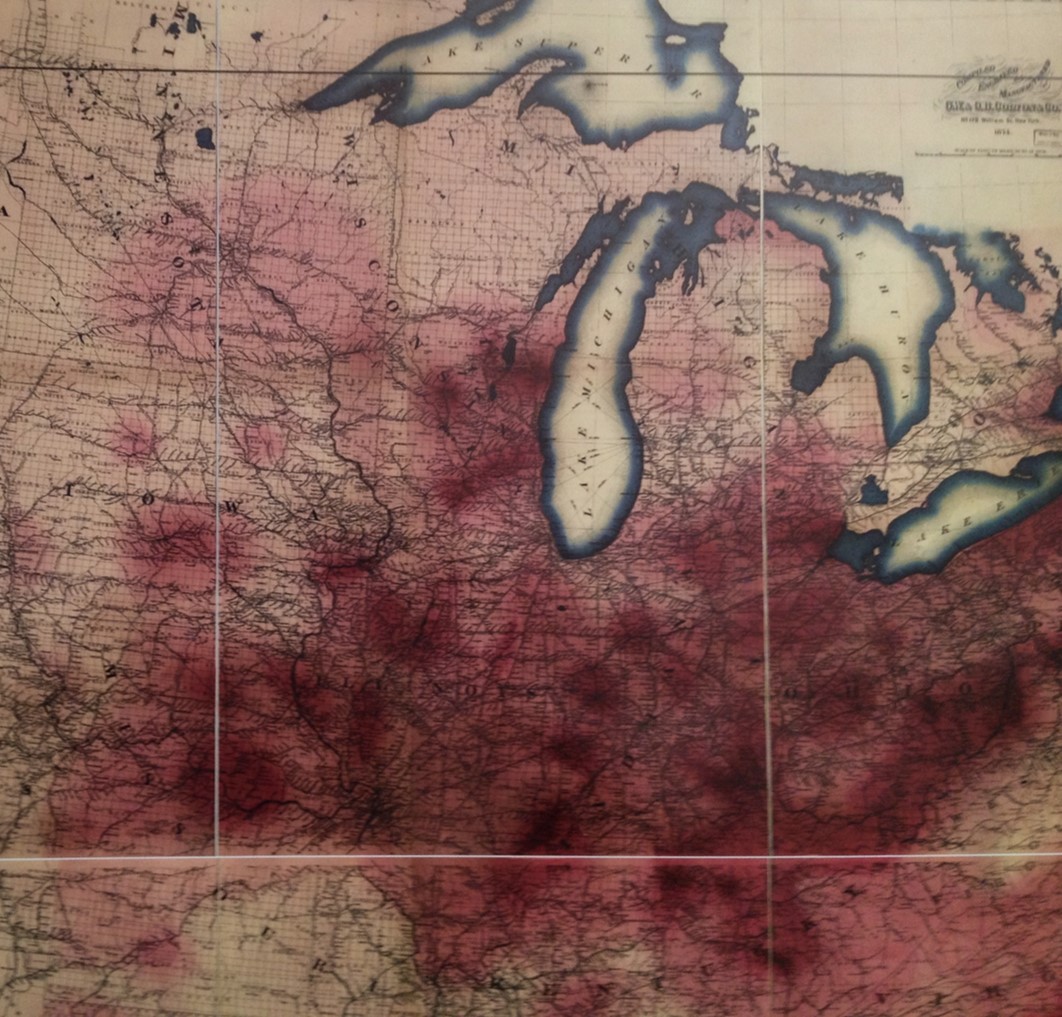
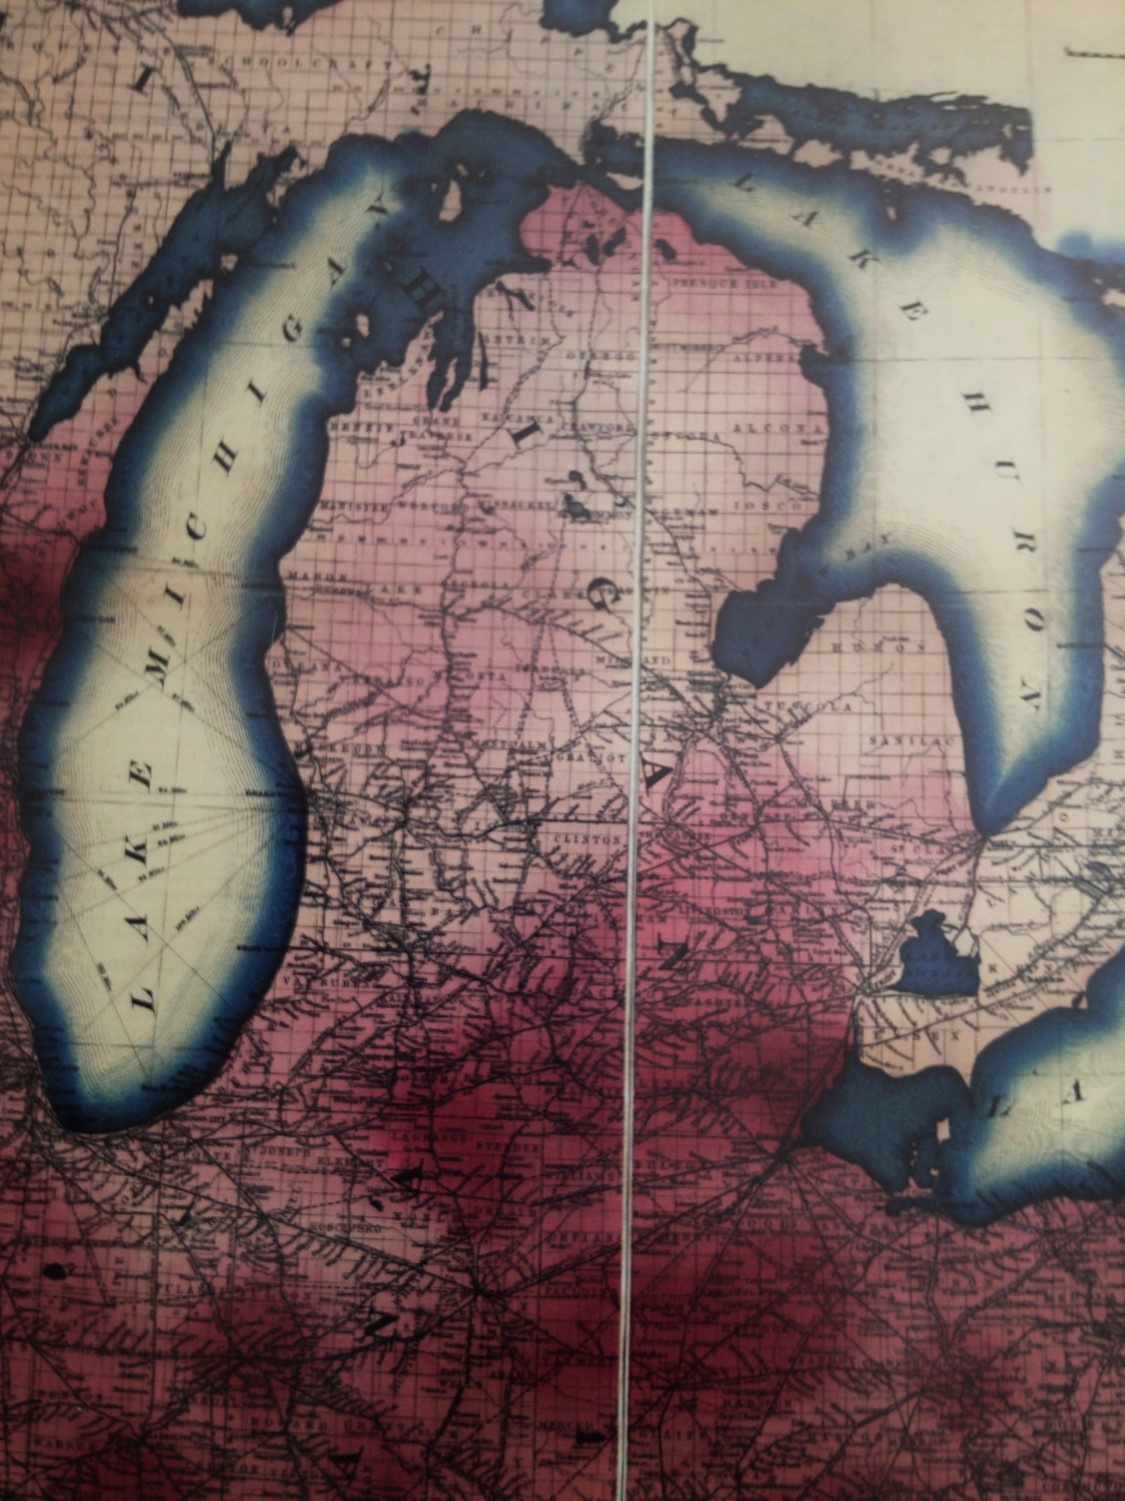
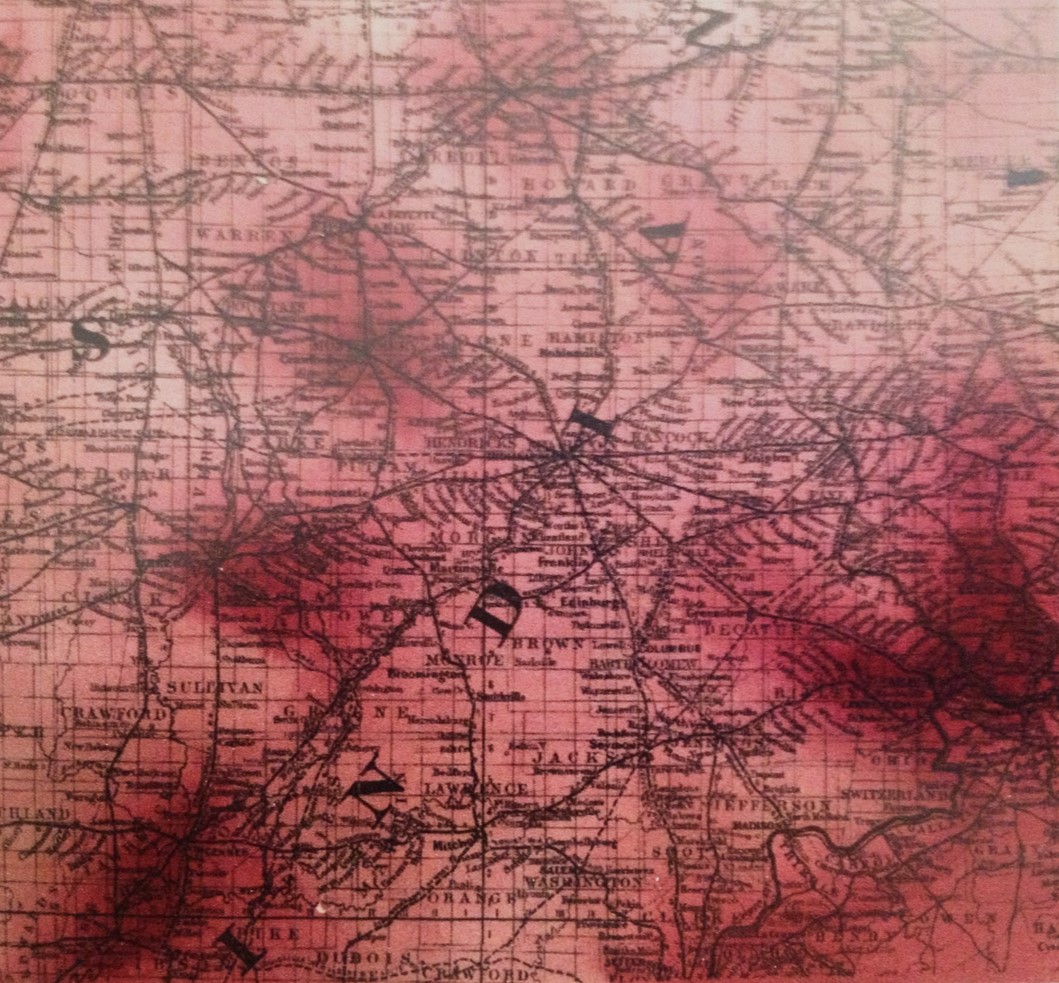
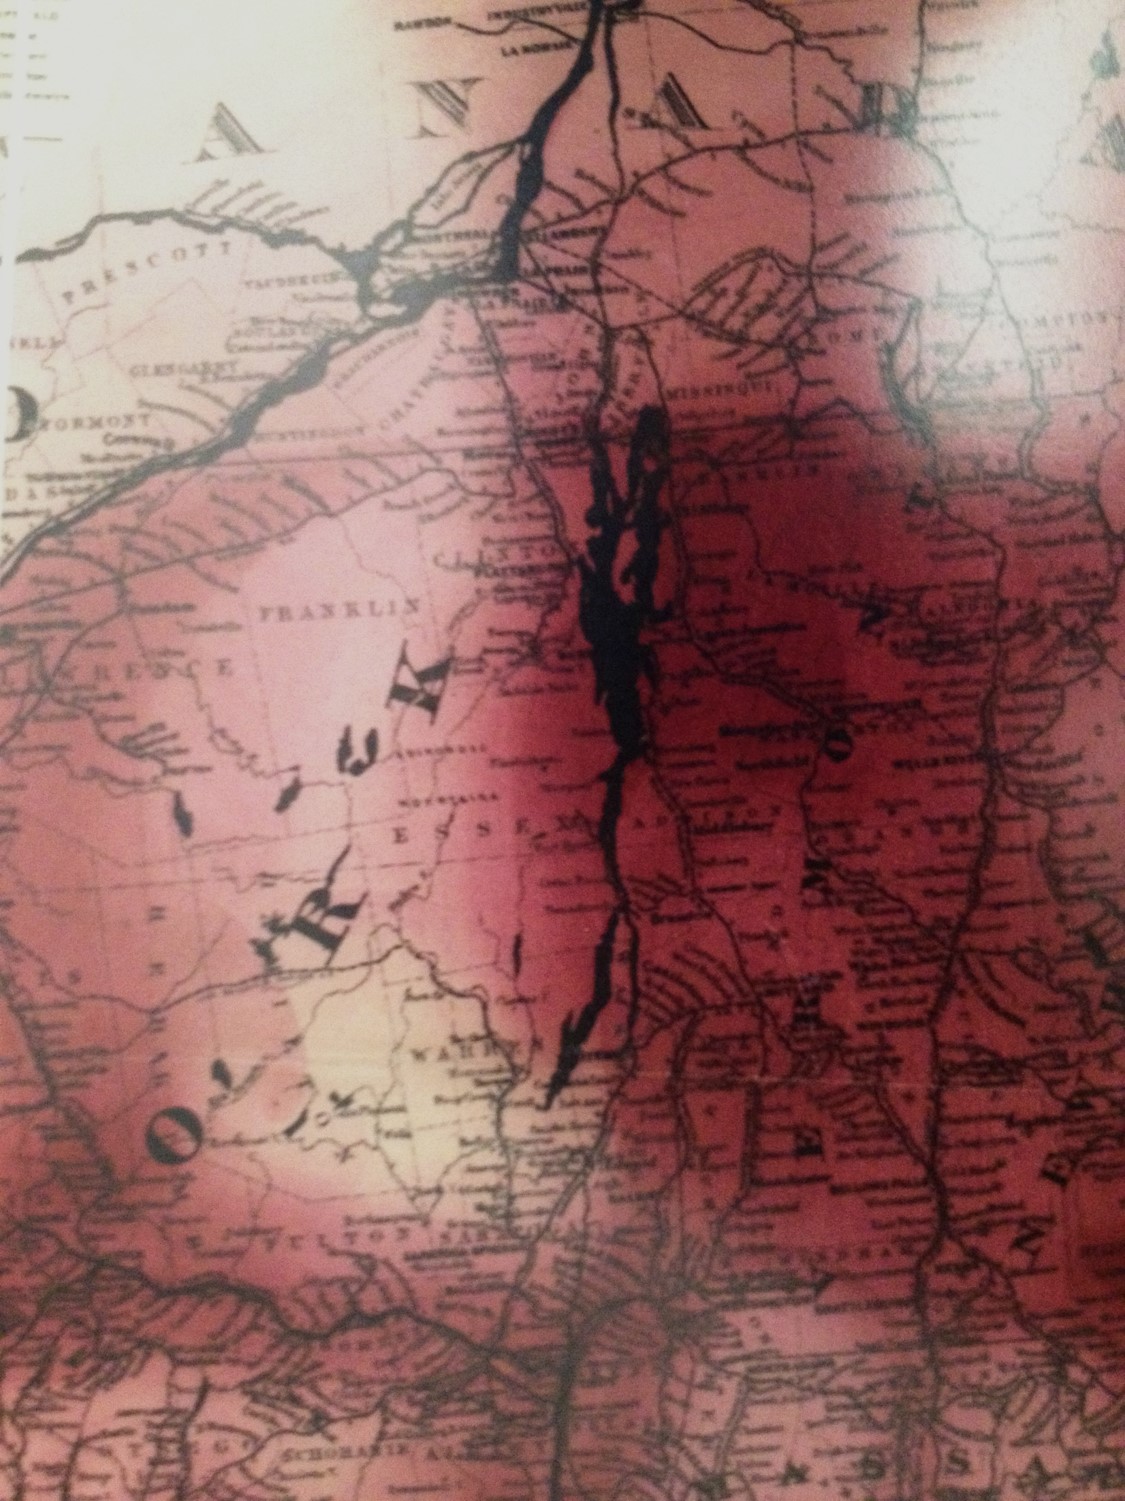
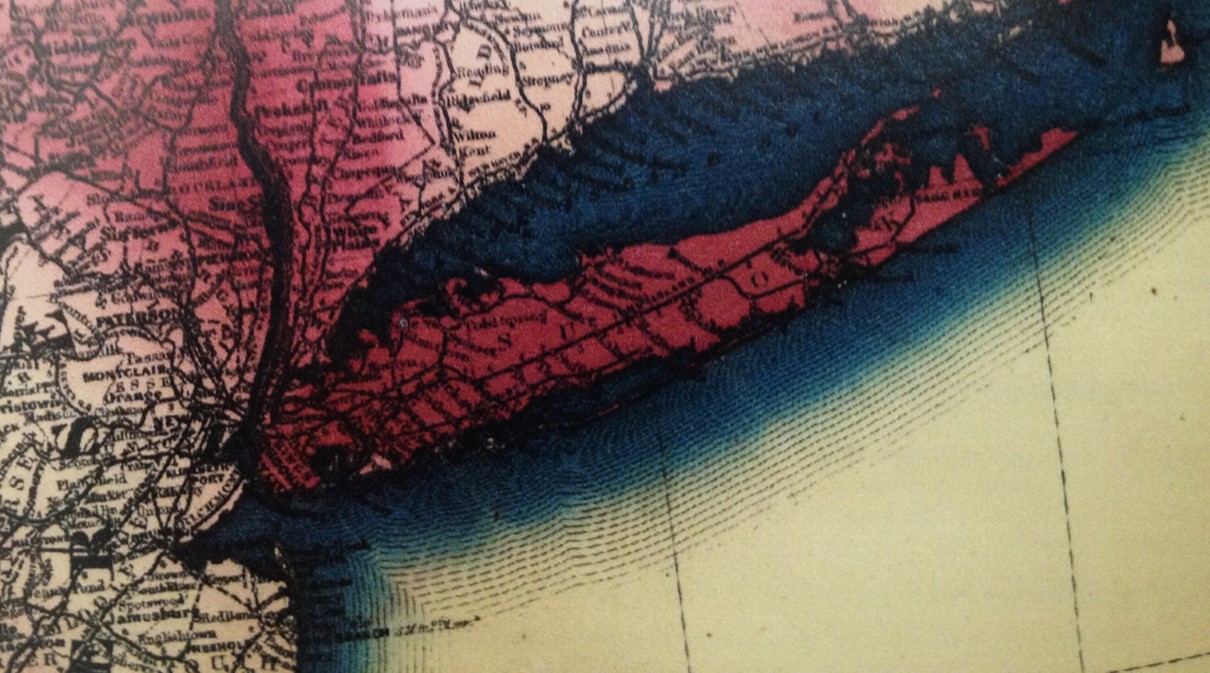
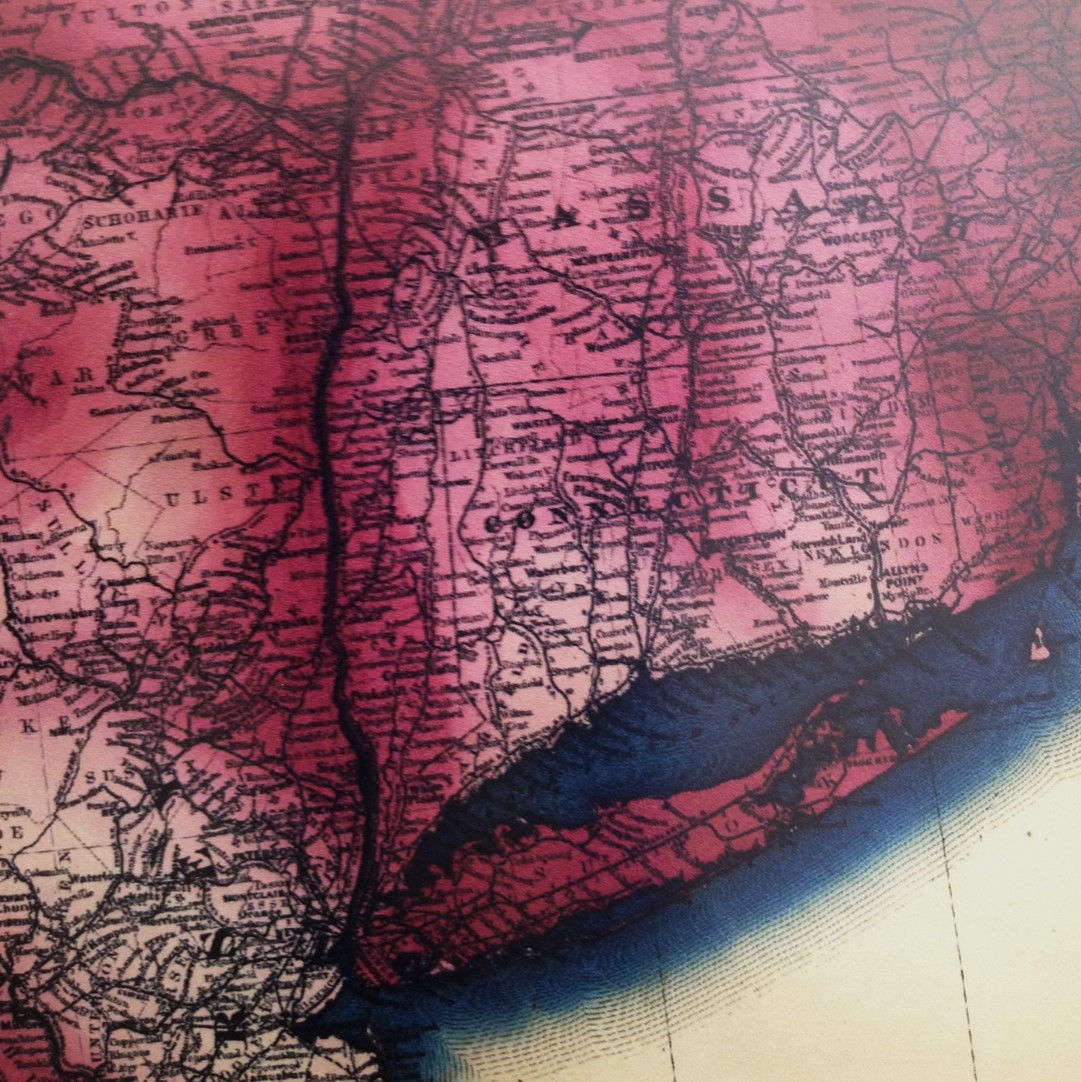
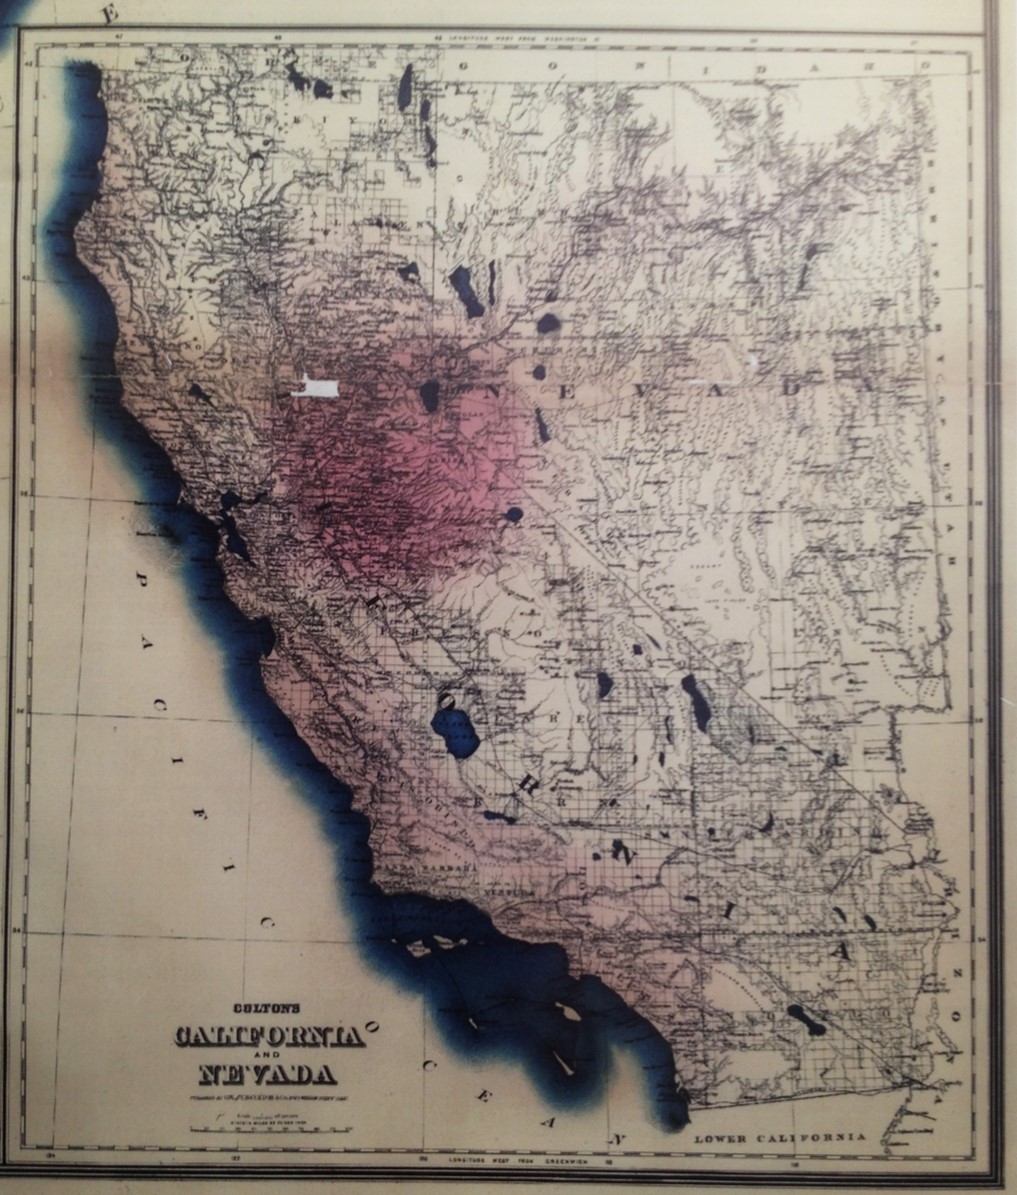
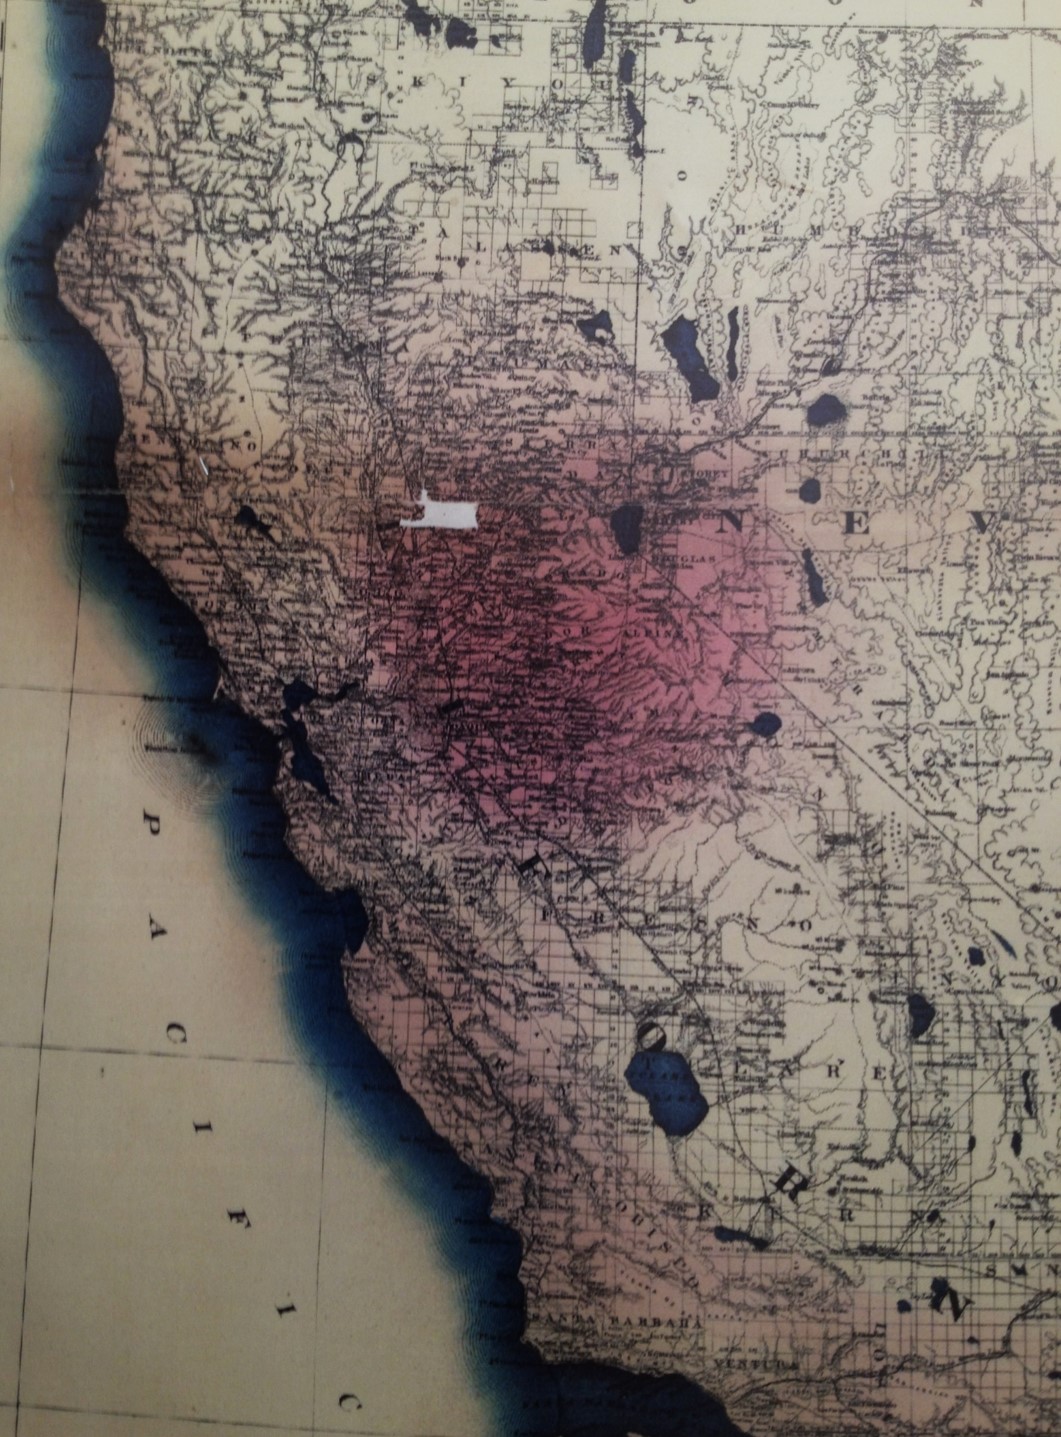
This review is of the phthisis or consumption map, with close-up and detailed pictures taken of the map at hand.
The Basemap and 5 Disease Charts
.
Base Map
.

Phthisis
.

Malaria
.

Pneumonia
.

Rheumatism
.

Typhoid
.
Point Density Observations
The year these maps were printed was 1874, Carney’s fourth year working with the New York Life Insurance Company.
This suggest that the primary reason for these maps was probably not epidemiological. Carney produced them to educate major payors of insurance about the health of their industry, the prospects for its workers and its risks. The cost to both parties for such a plan was linked to the amount and types of claims filed, which in turn were defined based on the health and disease state of the population. Such was the implication of Farr’s methodologies that were published relating diseases to lifespan and the chance for death.
A very helpful website for the history of the insurance industry is Sharon Ann Murphy’s Life Insurance in the United States through World War I at EconomicHistory.net, from which the following figure was pulled depicting the growth in popularity of insurance programs when Carney produced his maps.
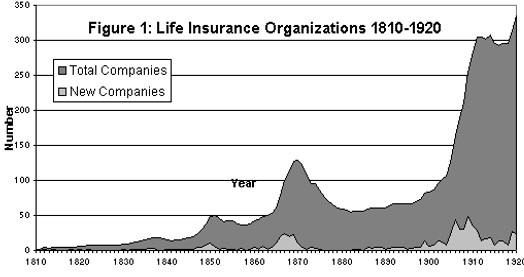
The first years after the Civil War were a peak time in the insurance industry. Many companies went under as numerous claims were probably leading to financial failure. Carney’s maps detailed where the majority of health related catastrophes probably existed.
New York Insurance Reports, Volume 2
Because these maps are based on a point density like interpretation, they are unique and historically important.
This method was later applied to maps produced after the cholera epidemic struck the commercially important settings like London in 1832. The suspected cause for these deaths was a miasmatic or airborne form of disease with undefined borders and undefineable material content. Due to the unknown nature of this miasma, its behavior was hard to predict, and the miasma portrayed on this map is very subjective in nature and undefineable as to how any related conclusions were developed.
During the early 1880s, Robert Felkin produced a similar looking map for scorbutus or scurvy, which still had the diffusely scattered influences of miasma theory portrayed on it, versus the well defined polygons depicting its related land scurvy. Carney’s maps were published just as the sanitation theory came to prevail as a possible cause, along with topography and local weather. Unlike the Eastern states, many of the places where railways were being laid, land use was mostly focused on natural resources, farming and agriculture.

Due to his background and education, we have to assume that these maps that were produce were somewhat limited in terms of its subjectivity. Certain parts Carney’s disease patterns repeated between maps, such as the high density urban area shapes, and the ways in which travel routes are followed, such as railways and riverbeds. He rightfully defines Malaria as a disease linked strongly to the riverways, with a more diffuse pattern involving every riverbed found more to the south. The tendency for phthisis to be primarily a northern disease is retained. The same is seen for typhoid, a disease arising from poor sanitation in highly developed settings. Rheumatism follows the Mississippi River inland and cuts across from New York westward to Illinois.
Therefore, the exact logic Carney used to produce these maps remains uncertain.
.

Phthisis
The following are close up photos of a version of the map I have. The lighting was diffuse that day. (May need to retake these photos.)
the point is to display to “point” data, which is essentially based upon major concepts derived by the map, such as urban centers, major railway/roadway hubs or intersection, etc..
.
.
.

.

.

.
.

.
.
.

.
.
.

.
.
.
.

.
.
.
.
.

.

.
.

.

.
.
.
.

.
.
.

.
.

APPENDIX
.

.

.

.

.

.

.
.
.

.

.
