Comparing Hamill’s work to that of previous disease geographers, Hamill learned medicine at the Cincinnati Medical College in 1838. This school was a regular medical school and only open for about 4 years by the time he attended. The courses he took lasted about 6 weeks, and were his primary schooling with which he obtained his license to practice. In 1861, he received an honorary MD degree. By then he was fully trained in his profession.
Prior to the 1861 epidemic, there were the yellow fever, cholera and typhoid/typhus epidemics. There was also a malaria form of disease, but not much like the malaria we think about today by this name. The term malaria meant bad air, associated with fevers, and was a more generic term and category of disease type than an actual disease event like we think about today.
Hamill would have seen the yellow fever heave as it did, the cholera migrate into this country as asiatic cholera, the other forms of cholera extant as more endemic disease patterns, the typhoid/typhus as numerous periodic events throughout the year, loosely associated with travel and shipping, in particular whenever they were late fall to late winter in their periods of outbreaks.
.
Outline of Article
The following is a brief outline of Hamill’s article.
- Introduction (p. 155), with table of “Monthly Averages of Temperature, Rain and Snow, . . . for Eight Years” (1854-1864), followed by a population table for Illinois and 5 other states for comparison: ME, NH, MA, TN and LA. Table III is on “Ratio of Deaths . . . ” for the same regions, followed by a summary table with total deaths and deaths per 10,000 people.
- Consumption (p. 166), with “Meteorological Differences”, “Social Differences”, “The Domiciliary” and “Dietetic Differences” subsections. Four tables focused on death rates and age distributions follow
- Diphtheria (p. 173), with just a table on monthly deaths for 6 of the years between 1853 and 1866.
- Erysipelas (p. 176)
- Scarlatina (p. 179)
- Topography of the City of Chicago, Illinois (p. 181), with 23 temperature-climate, population, mortality, disease, and disease calendar tables.
.
.
Medical Geography in 1865
By this period in American medical geography history, the kinds of maps produced can be defined in several ways. Their purpose is always important to this exploration of medical mapping, but the purposes are as follows:
- to prove/disprove a natural or human ecological reason for diseases; to identify or uncover the source for the cases at hand
- to demonstrate a clustering behavior of the condition, in order to help rule out infectiousness or not
- to better understand diseases felt to be induced by iatro- (human produced) versus koino- (environmentally-produced) miasma cause.
- to illustrate the size of the area impacted by the disease
- to document the numbers of those afflicted by a disease more for demographic statistical purposes
- to document neighborhood or village, town features and their relationships to the disease, especially with respect to people’s places, crowding, land use behaviors, unsanitary conditions
- to document the natural elements and their relationship to particular disease patterns, either directly and symbolically and philosophically, as expressed by the map (Denison) or indirectly by the details provided in the accompanying text about the map, such as the theoretical relationships between health and natural elements, such as topography and climate
- to illustrate the relationship between disease and space over time
- to illustrate large area features of given disease types, providing support for the latitude and longitude theories for diseases that prevailed at the time the map was produced.

Hats Off to the Cloudy, Humid, Windy Setting of Chicago!
When reviewing a historical disease map, it helps to engage in the following tasks and pay attention to the following features:
- Look up the area on a true satellite image (Google maps or equivalent)
- Find historical maps of the area on the web or in an atlas, being as close to the year(s) discussed as possible; a before and after series of maps helps quite a bit with this review
- review the history of the author or clinicians/writers involved in this epidemiological work, to obtain more insights about their view of the causes for disease
- determine and differentiate the street layouts for then versus now
- determine changes in land use patterns and major hydrogeographic features, such as ponds, lakes, streams, the nature of the building along the water edge, at mountain or hill bases, adjacent to swamps and marshes, etc.
- determine the environmental status of the places involved with the disease (review text for this)
- see how the cases relate to all of the above; is the map an areal map, a point map, an isoline map, a choropleth or other less specific form of mapping sickness prone regions?
- Ask yourself the following research questions: How quantitative (numeric) and qualitative are their report and accompanying map(s)? Do they provide mostly summary tables or are the standard for the time regarding frequency equations being put to use?
.
.
Details
Introduction. In his Introduction, the geological notes Hamill provides us with offer insights into how medical geologists like himself interpret a place relative to its disease patterns. If we accept 1797 to be the birth year for a published and well documented natural history of disease based upon something more than just climatic or temperature-humidity features, Samuel Mitchell’s note about the tendency for some diseases to avoid area with alkaline substratum such as limestone to be the starting point for this philosophy in North American and United States traditions. The theory at the time was that the limestone substrata produced a setting less susceptible to a fairly infrequently mentioned disease for the time Asiatic Cholera. In just a few years this philosophy would be converted, reversed in its philosophy in fact, blaming diseases on the alkalinity of a region and the ability for miasma to form due to that alkalinity. Such a philosophy would carry through for at least the next two or three generations of physicians, from the 1800s into the 1850s when it was revived by an article published by John Lea, a gardener not a physician, of Cincinnati, Ohio.
John Lea’s proposal that cholera was impacted by soil, rock and water alkalinity was not supported by the medical profession. This was mostly because John Lea was not a physician, and his recognition of the relationship between alkaline regions and cholera wasn’t fully understood or accepted much by the medical profession.
Between John Lea’s publication of his theory and Hamill’s reviews of Illinois geology and disease, more than ten years have passed. He removed to Chicago, Illinois in 1852, two years after John Lea published his pamphlet on the limestone or geologic theory for cholera when it came to Ohio. Chances are Hamill was not at all ignorant of this professional argument that took place between 1850 and 1853, the year the annual review of the state’s medical society published it commentary on Lea’s philosophy and out of touch, 18th century beliefs and behaviors. Upon close review of Lea’s arguments for the cases, even those that were exceptions to the pure limestone theory and thereby forcing him to come up with some alternative confounders for the disease development, Lea’s writings were not that far off from any other medical geographer for the time. From 1853 to 1857, Lea continued to argue his claims, but his arguments lost their credibility and value as they began to sound more and more like the unguided wisdom coming out of the mouth of someone who was now a man approaching his final years in life.
This attitude about Lea that probably became strongly attached to his name did not influence the newcomer to the Midwest, Robert C. Hamill. Dr. Hamill removed to this region to be a physician and to draw his own conclusions regarding disease patterns and the local environment and populations. When he commenced his work in this area, he did as any newcomer to an area might do–study and investigate the local natural history and its relationship to disease patterns.
The cholera epidemic that arrived in 1849 still had a few more years to influence this country, but for the most part 1853 was its final year of severe deaths due to epidemic disease patterns. The diseases and epidemic that ensued in the Midwest between 1854 and 1857 were little more than the norms for the region. The cholera events for those years occurred mostly in the rural and hinterlands, places here any remaining small densely populated setting had not been hit as of yet by the Asiatic cholera. By 1857, the Asiatic cholera died off, and so too did Dr. Hamill’s focus and attention to it, be it he had very little of this to recall and rely upon once he removed to the region. Between 1858 and 1860 in fact, there were very few events that took place which were somehow not normal to this setting. The typical infectious diseases that vaccinations were in stages of development for took place, as did the traditional diseases for the time related to urban settings, occupations engaged in, and lifestyle.
The Civil War began in 1861, but had a limited impact on Illinois at first, and so Hamill was not impacted too much by the state’s government decisions based upon this new war. Chicago even continued to grow during these first war years. Illinois was too far north to be concerned with philosophies and ideologies that only the inhabitants of the hot southern climates could fully understand. So Hamill became more of an anti-slavery person during his years in Illinois.
According to some historians, Robert Hamill also had some of the charisma and looks that then President Abraham Lincoln, also from Illinois, had been influencing the American population with. Dr. Hamill was a very tall spokesperson, political leader, physician, and neighbor. He stood above most of his neighbors in terms of height, and occupational status. This helped him further any cause he might have pertaining to public health. It made him stand out amongst most of the politicians of the region. It also facilitated the arguments any time he tried to make his point about the possible local causes for disease.
In 1863, an epidemic of Erysipelas had stricken the city of Chicago. This was an event very different from previous epidemics common to the region. Physicians had already learned that with time disease patterns might change or progress. ‘Could this be the next stage in the development of a new disease pattern for the Chicago are?’ was probably the question that Hamill was often reflecting back to. Erysipelas had its important moments in world and American history. But the erysipelas associated with many of the past epidemics and tragedies wasn’t always the same as this form of erysipelas.
Older, more traditional forms of erysipelas were more often that not associated with contaminated grains and the like. In fact, grain poisoning was the most common cause in previous centuries of human history. The erysipelas that struck Chicago, however. was very different. It represented more a new form of erysipelas than the traditional St. Anthony’s Fire version associated with St. Anthony himself, documented during the middle ages. The erysipelas manifested itself in the skin quite differently, and did not share the same long term drawn out, often tragedy-ridden history that the other form often generated. This form of epidemic followed the people, not primarily their habits like occupation and cooking and eating patterns. Like the small pox, erysipelas seemingly was passed from one household or person to the next.
The most unique aspect of Hamill’s opportunity in the Chicago, Illinois, was the opportunity he had to watch as this disease progressed into some epidemic form, and then travel from one household and neighborhood to the next. If he paid close attention to these cases, he had the opportunity to measure the distance and time between adjacent cases, and work out a hierarchy to this new disease pattern. Such an event was not easily accomplished with Asiatic cholera or yellow fever, since Asiatic cholera was often fatal and yellow fever, complicated by the potential foreign born nature of this disease due to the history of the ships docked in nearby harbors. Since Chicago was too far north perhaps for sufficient observations to be made about the disease migration habits, in relation to temperature, erysipelas offered Hamill an opportunity to map a disease that demonstrated less of a relationship to local ecology, and more to local population features and sanitation-focused lifestyles.
Like any epidemiologist for the time, Hamill did not just blame people for epidemics. Like most he was focused mostly on the local medical geology and climate. Unlike many prior medical geographers, he was focused more on geology and its impacts on disease patterns. He retained that respect for weather and climate that all physicians bore when trying to better understand disease, but like anyone else exposed to new information, new findings and new beliefs, he was focused on the details of a new version of the medical geology theory for disease. In very short time, medical geology became the first natural science profession to have medical attached to the tradition of a subfield. Some of the first books every written on medical natural sciences were those devoted to medical geology.
As a result of the wide appeal medical geology had developed as a profession, Hamill begins his work with a general description of state, its geology and “four axes of disturbance along the western and northern border of the State.” Unlike a similar essay from 25 to 30 years earlier, Hamill this time could be specific about these rockforms, and not just focus on the alkalinity theory and local limestone beds. For disease provoking geologic sites, he mentions the presence of a coal bed (Stephenson County), a limestone rich region (Cap au Gres), “the Grand Chain of Alexander”, and blue clay or hardpan along the western edge. Hamill also notes the late bluffs of a loess near Quincy, a much more detailed of the topography and its underlying strata than previously reviewed. He would also note the common prairie lands found throughout the state, and most importantly, he described the slope of the entire state and its general direction still had those people who reviewed this feature into how the miasma leaving the substratum as telluric cause for disease might flow across the state’s surface. This also defined the direction that water would flow, from its point of contact with the earth as a disease free form of rainwater, pouring across the land’s surface, adn then into its gulches and gullies, followed by rivulets, creeks, streams and finally rivers, and with each stage becoming unhealthier in content and in nature.
Consumption. Consumption is a northern temperate zone disease feature. Now twenty years into this teaching, Hamill notes the behavior of this disease within its urban setting. Due to mycobacterium, this behavior of the disease may in some way mimic another disease–Chicago Illness, or Leptosporidium–a fungal disease that still resides in the Chicago urban setting today, due to the same lakeshore, lake effect climatic and meteorological features. The primary spatial features supporting the persistence of consumption cases in this vicinity are crowded living conditions, given victims of this disease plenty of opportunities to pass it onto new potential victims.
Diphtheria. Diphtheria, the worst and most deadly of “sore throats” to ever be suffered by a child, was a problem again due to population density.
Erysipelas. (Reviewed separately on this page)
Scarlatina. Scarlet fever had much the same population geography behaviors and features as diphtheria. Its impact was most deadly to children. Those it did not kill were left immune for a while.
.
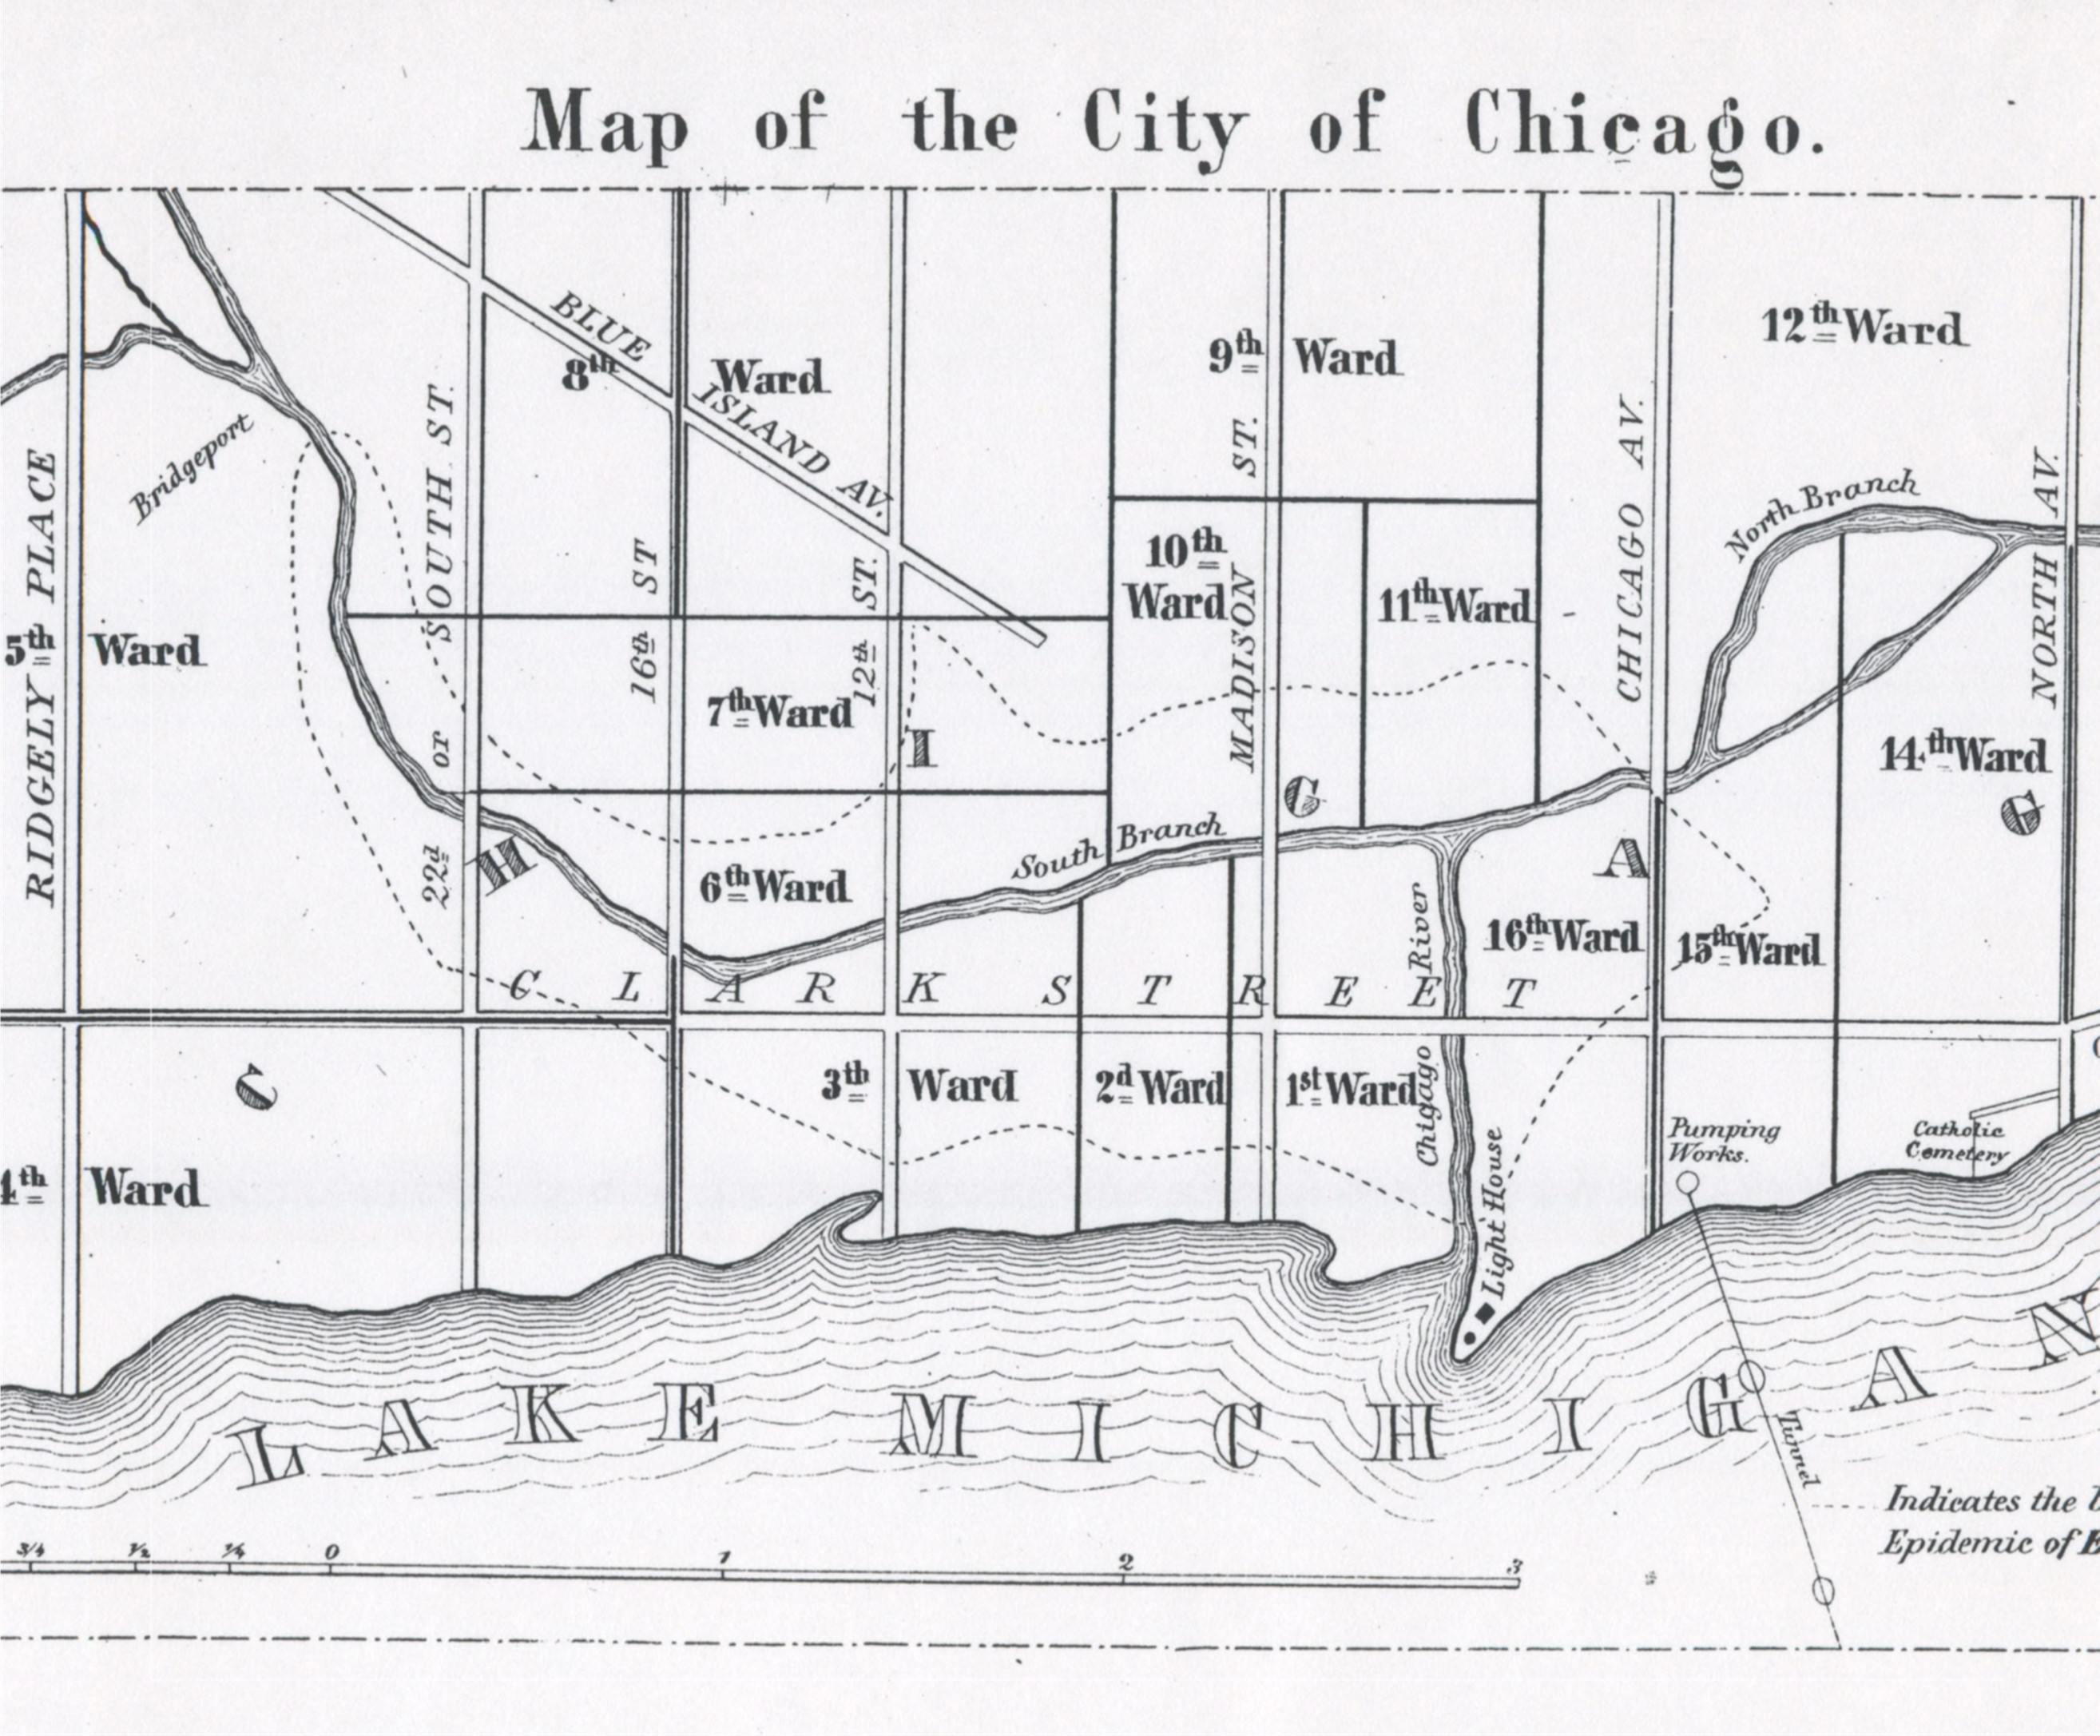
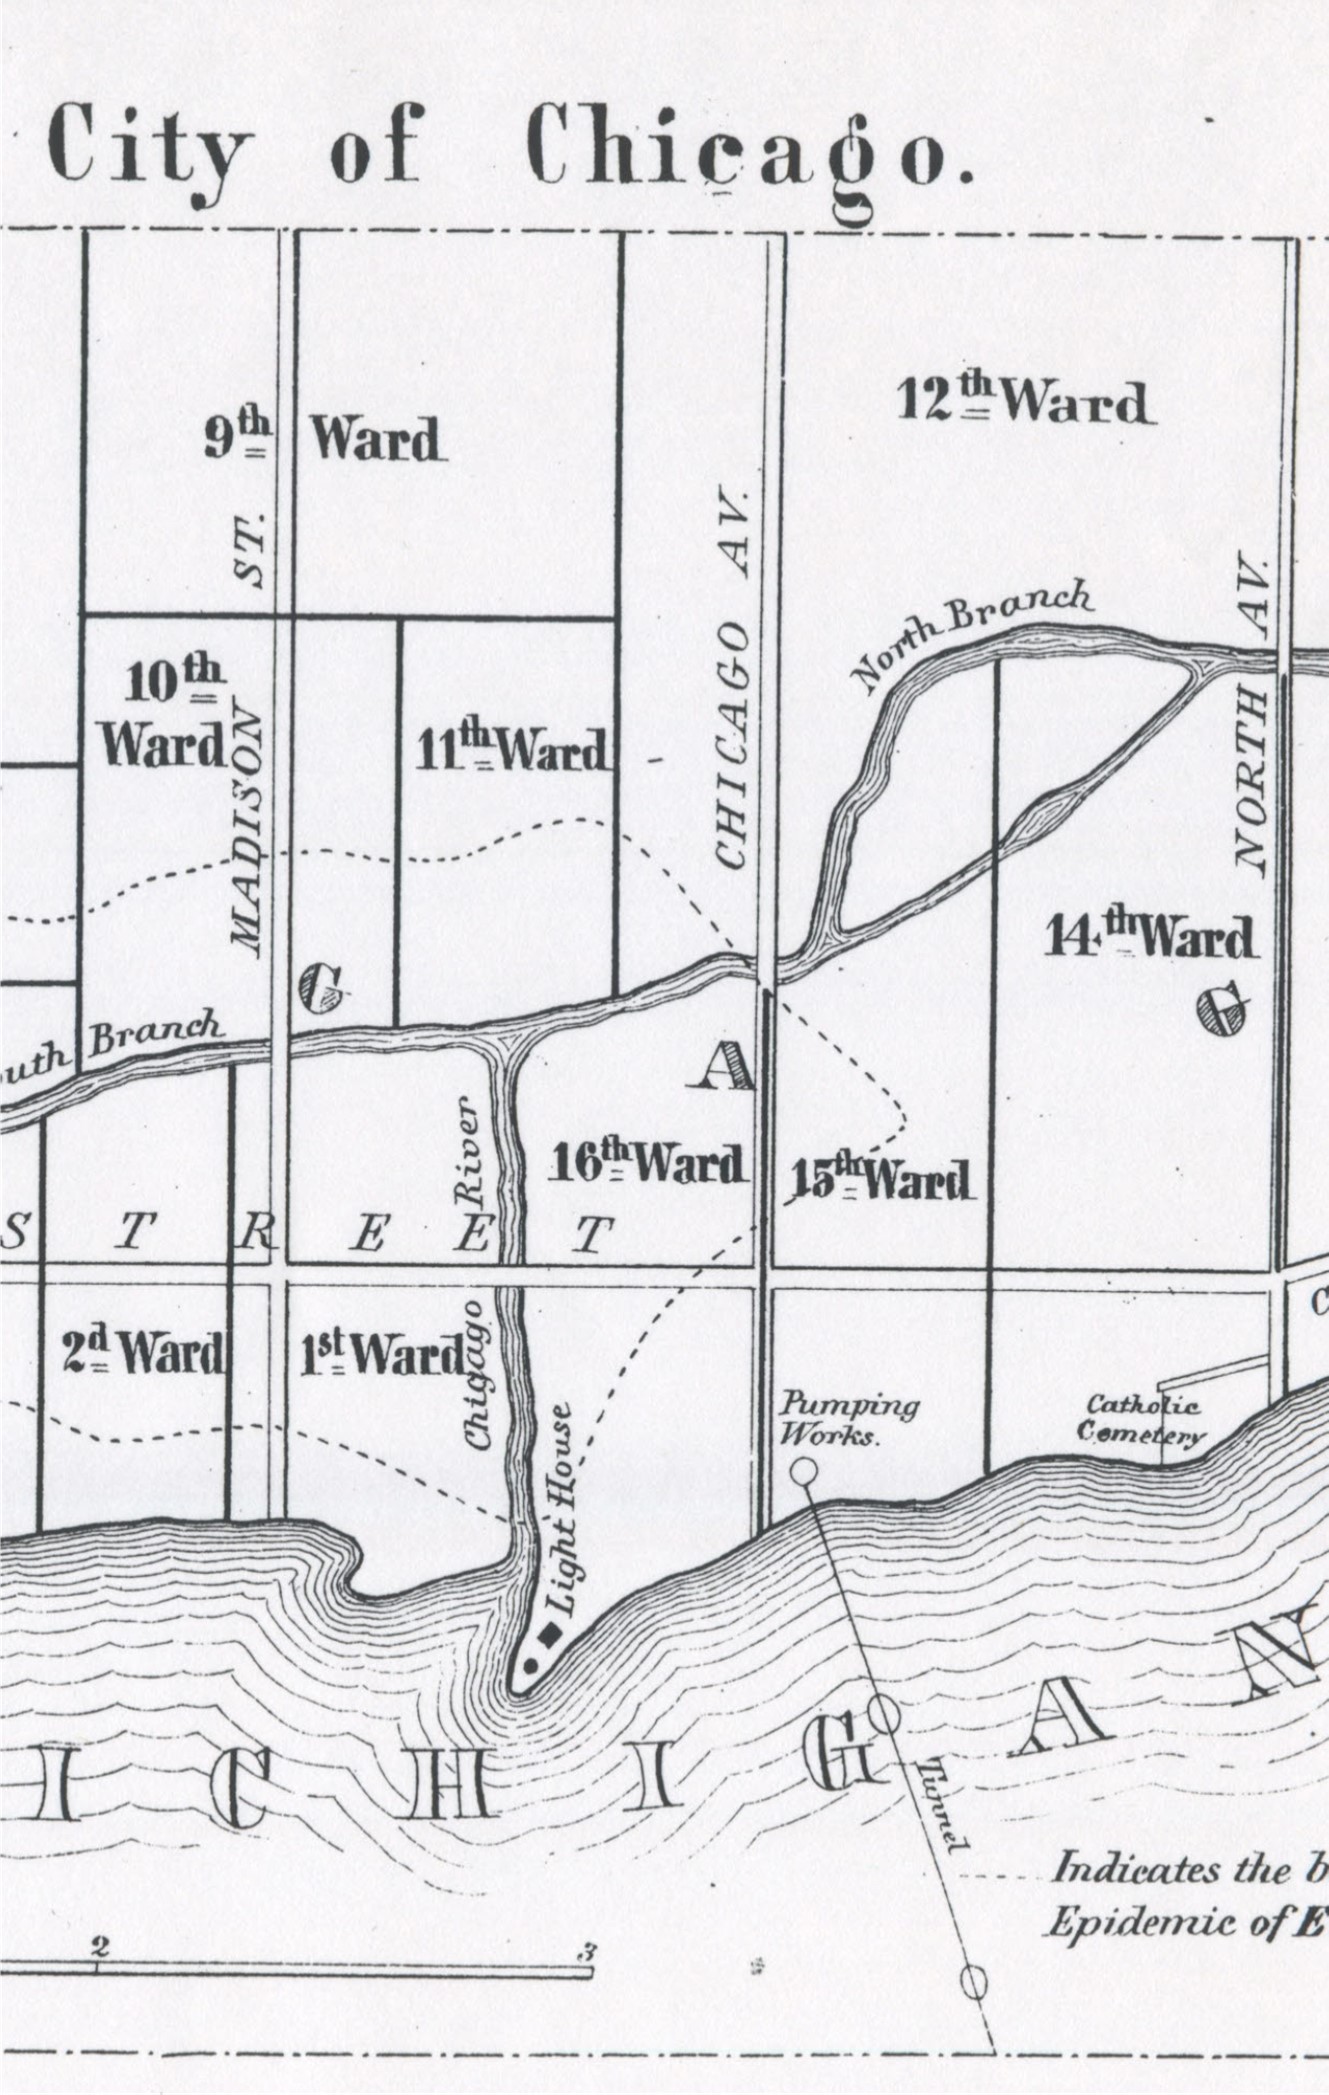
Chicago Topography
The terrain in and around Chicago lacks considerable elevation changes. Small changes in height above local water surfaces do impact the flow of wind across the earth’s surface, perhaps enough in some places to make medical topographers suspect some areas to be more susceptible to wind-blown miasm. However, relatively speaking, such high risk areas barely compare with the examples illustrated by other medical topographers specialized in terrain related medical geography. This explains why Hamill covered this topic the way he did. His focus was on population density, temperature and wind direction.
Throughout his article, Hamill makes mention of the traditional miasm concept of disease, and so for the bulk of this review, it serves as a review of deductions about this disease based on this theory. One can also assume that Hamill never goes through the details of earlier miasmists who tried separating this effluvium into two types–iatro-miasma and koino-miasm. Hamill does distinguish between the different sorts of miasm based on its sources that are cited, but not on any reductionist philosophy posed forty to fifty years earlier by leaders in the medical topography field.
Hamill makes mention of winds and dry weather at some point in his review, and dry weather seems to be a common problem faced by settlers in this region during the 1860s.
It is possible the lack of moisture further supports the notion that rotting and decay are not so much a cause for disease as the quality of the air passing through the region became a primary cause or confounder. Lake effects in combination with direction of seasonal winds and storms patterns further support Hamill’s argument for the miasm-related cause. Animalcules that are surface- or water-borne are for the most part rules out since they would most certainly be limited to the physical substratum for diffusion. The fact that this disease does follow the waterways does infer possible animalcule and detritus based causes found within the unclean river waters. But Hamill still stays clear of stating this is the case. It is possible that the very high rates or reporting of hospitalized or otherwise bedbound people made it clear to Hamill and others that the cause for the disease had to be related to how people within a building came in contact with the effluvium or miasm responsible for this disease. An old adage that the airbound cause could be animalcules was possible still present at this time (Samuel Hahnemann, founder of homeopathy, believed they could be so small they were essentially invisible), and so insects and organisms much smaller and barely observable may have been considered a possible cause as well. floating outside the building. That was the major question Hamill had to answer when he proposed his theory.
.
.
Cholera
Cholera Notes
Asiatic Cholera, yellow fever and then “typhoid” (not yet differentiated into the animal-born flea-related typhus and the bacterial typhoid) were the most commonly mapped diseases of this century. Plague was covered on occasion, but typically not mapped due to its traditional urban patterns. Two natural environmental patterns–topographic and climate–depicted many population independent diseases. Those more diffuse and less population dependent like small pox, diphtheria and the like, were already established in a dichotomy that medical topographers had to work with when developing their theories.
In the years just before Erysipelas struck Chicago and was subsequently mapped, the 1850s cholera epidemic had made its way through the United States on several occasions. Each of these were mapped, at the local level for the most part, and then compared with its overall global diffusion process. This spatial analysis continued over the next few years, up until the year Erysipelas came to Chicago.
With these prior maps, epidemiologists were able to demonstrate evidence for environmental and population density impacts, in assocaition with human migration or travel. Whereas the cholera epidemics of 1816-1817 and 1832-1835 did not impact the city of Chicago very much, but did make its way deep into the country west of Chicago due to Fort based travel and communications, suggested to some that this was a cosnequence of travel and the environment, with less of an influence generated by people or their density. But as another medical geographer noted in 1832 when cholera first struck the United States by way of the transportation routes along St. Lawrence River, through Quebec and then into upper New York, there was evidence for an orderly way in which the disease made its way in. In 1832, Lewis Beck rightly noted the hierarchical diffusion process this disease took when it struck the upstate portion of New York. In terms of global geographic features, this diffusion path differences considerable from that of the yellow fever so many researchers had been putting on maps in the decades prior. Whereas yellow fever regions were very much topographically defined in terms of where they were predicted to hit–along water shore edges frequently traveled by international commercial ships, and mostly in port cities–the cholera regions were more linear in nature, dependent upon travel routes and sizes of cities to take their toll and make their way into the interior of the country.
During the first quarter of the 18th century, yellow fever had of course made its way inland as well in North America, but the philosophy for the time prevented medical geographers from fully accepting this paradigm on how this fever behaved. As a result we see the first observations of this link of fever events taking place inland that resembled yellow fever to the place, not the shared symptoms noted for other places. The first such inland yellow fever epidemic was in Genessee Country in mid-western New York and known as Genesee Fever by French writers around 1800. This led to the popularization of the ‘Lake Fever’ epidemic hypothesis proposed and published by land owners and developers staking claim in these newly settled parts of New York by the Great Lakes. Politics and money made it necessary to define local fever epidemics linked to places to be settled because as part of the settlement plan, the goa was to eliminate the topographical causes for these endemic disease patterns. The distant inland febrile diseases were a brief part fo those region’s histories, unlike the recurring yellow fever that every now and then went rampant along the ocean shorelines.
The 1837 epidemic that reached cholera was the end stage of a global disease issue now in its fifth year. Over time, these diseases managed to slowly move inward into the country, so those that struck the outskirts of this country, far away from the central port cities, represented the last stages of the previous epidemic. If we review the consequences of the 1830-1832 epidemic period and activities, we find minimal understanding of the great differences that existed between common cholera cases and the recent Asiatic cholera.
Over the next few years, the influx of Asiatic cholera changed everything that was decided upon about how new introduced diseases initiate and then travel within the United States. It was the skills and applications of disease mapping, nearly perfected by the yellow and non-yellow local fever incidents that became perfect due to this change in epidemic disease types and patterns. Yellow fever was one of numerous fevers that struck, based on time of the year, latitude based and climate based temperature and weather patterns, and finally place. The yellow fever was one of numerous types of fevers that existed, nearly all considered the same disease pattern, expressing differently due to different temperaments of the people, different places and means for onset, and difference geographically and seasonally defined causes.
Likewise cholera at the time when it began to take on this vicious and deadly form in the form of “malignant cholera”, but also “Asiatic cholera”, was only thought of as different forms of diarrhea in its worst form. The following variations of these diseases may be seen as existing in the medical literature for the time:
- cholera (simple cholera) –biliary in cause and nature versus non-choleric (non-biliary) diarrhea
- infant cholera — mostly age linked, perhaps related mostly to the child’s heredity, “temperament” and “constitution”
- cholera morbus — a lengthy cholera spell in weakened, older adults, often fatal, but taking days to weeks to kill
- choleric due to black bile imbalances (usually cholera morbus, but also precedent to the next stage)
- choleraic–any form of ‘cholera’ worsening into a deadly form, and later, a case of Asiatic cholera that was non-fatal
- malignant cholera, usually related to Asiatic cholera
- Asiatic cholera–that form which we know to be such today
During the first four to five years of the 1840s, cholera was once again the non fatal types, causing death in children and elders for the most part, and weeks of suffering from dysentery for those who were in their much healthier young adult years. With the return of cholera in Europe in 1846, the United States had to remain alert to the return of the much more severe and fatal Asiatic cholera. Some of the old 1830s philosophy resurfaced, and the geological theory became popular briefly, along with other theories involving nearly every natural resource known to be important to the local natural history. Dead animals, decaying carcasses adjacent to slaughterhouses and butchers’ places were commonly linked to the severe forms of “cholera”, many of which were more than likely simply cases of opportunistic infection, non-amoebic induced dysentery. By the time the Gold Rush began, and the more severe form of cholera was able to reach the United States, Asiatic cholera had already effectively made its way into the United States in February of 1849. A few months would pass before it began to emerge as the United States Asiatic Cholera epidemic.
Since cholera could be shown to follow well established shipping routes, its means for transport to the U.S. must have appeared obvious to some.
But there were still many people adhering to the miasma theory for disease and its distant relatives that together helped form
The 1847 nosology of disease written by Dr. Carl Friedrich Canstatt was a book that focused on the nosology or classification of diseases patterns according to theories heavily i and around what are today the German parts of Europe. Canstatt’s work included the following definition for “Malaria seuchon” or Malaria disease–a disease process generated by a specific telluric atmospheric miasma.
In 1847, a number of epidemic disease patterns with a specific geography to their behaviors had been witnessed. The first of these was the yellow fever, a disease with endemic patterns natural to tropic settings and with epidemic patterns impacting every now and then the more temperate zones of the earth. The second disease pattern to be reviewed extensively due to its endemic and epidemic behaviors was cholera, or to be more specific Asiatic cholera. The yellow fever and Asiatic cholera shared the fact that each was unique to its predecessors. Yellow fever was a unique form of fever considered worse than traditional fevers associated with seasonal climate changes, the traditional ague for the time (the true malaria of today), and the typhoid fever, which at the time was a mixture of typhus and typhoid disease patterns and behaviors.) Asiatic cholera, often called cholera ___________, was different from the other much more common forms of cholera such as cholera morbus, cholera infantus, and the like. Unlike the other forms of cholera, Asiatic cholera could kill in a very short time, even more rapidly than yellow fever.
What this demonstrates to us about the history of disease mapping is the nature in which the idea of mapping came about. The skill of disease mapping first became popular to epidemiologists because it could answer important questions about the disease. It was first used in order to define the source and behaviors of New York’s second major series of yellow fever epidemics in 1797. Valentine Seaman used it to map out cases with the goal of determining if the disease was imported from afar or locally born.
As noted on my page reviewing Canstatt’s work, cholera in general was considered a result of the following [translated from the German] :
“Malaria disease (disease processes generated by specific telluric atmospheric miasma); alternative: Malaria seuchon (morbid processes generated by specifische telluric atmospheric miasma).”
The skill of mapping cholera was now very important to epidemiologists. It became one of the primary methods used to prove the causes for a disease of unknown origin in a given territory or region, akin to the use of the petri dish in order to identify many of the pathogens responsible for today’s diseases. In theory, someone familiar with all of the diseases need only look at a map and know which class of diseases an illness could be placed in, in order to define how best to treat the problem at hand. If a disease was of external, non-human related miasma origins, a map was essential to better understanding its causes and potential future effects. If and when we found the disease to be primarily of human or population origin, a map told us where the disease possible began its venture through the local communities, and possible how to halt its further diffusion throughout the region. By presenting the places of various people with the disease on a map, like Valentine Seaman did decades earlier with yellow fever, we could determine if the disease was diffusing in a linear fashion, following the most important transportation routes, favoring attacks upon areas rich in unhealthy water sources or low income regions, and/or behaving according to what is now called a hierarchical diffusion process. As the 1832 cholera epidemic had taught us, population centers were important to the introduction of some diseases and their manner of spread to new places. This would be the end result of what maps demonstrated to us once the 1846-1853/7 global epidemic or pandemic of cholera was completed. To epidemiologists in the 1850s, the ability to map anything and everything related to medicine and health had become an essential skill, giving rise ultimately to the more popular use of thematic mapping to help illustrate any points being made about cause and effect. Due to asiatic cholera, the skill of disease mapping as a part of the medical and epidemiology professions was here to stay.
We used disease mapping to document disease behavior over time and space. But we also used these maps to better define the cause and effect relationship between diseases, people and space. For this reason, the most important geographic features mapped were first and foremost climates and disease, with large areal features felt to be a primary contributor and even initiator for many of the illnesses that occured due to the influence of major measurements such as latitude and longitude on disease patterns. Transportation routes were also very large areal and linear features that were important to understanding disease diffusion, and once diseases were shown to be almost completely linear in their ability to be transferred from one place to the next, and the geography of transportation became an important factor in defining where to best set up quarantine facilities in order to prevent disease spread. Population size, density and types were also important due to the problems large numbers of people caused related to crowding, poor housing facilities, poor hygienic practices and poor indoor and outdoor sanitation practices. Calculating percent fatalities directly and indirectly was also now a common skill for epidemiologists, enabling them to better define hotspots for certain diseases. Those most in touch with the local demography and socioeconomic features were able to link such things as health in general, age, culture, place of residency, environmental features, and ethnic or genetic background to certain diseases like Asiatic cholera. Those not well trained in population density based reasoning still had their way of reading and approving or disapproving the numerous theories out there for such epidemics, everything ranging from solar activities including flares, sunspots, and rain patterns to basic theories drawn from the magnetic theories of cloud cover and lightning-thunderstorms. Even meteors became a common cause linked to this cholera in some observers’ minds. But once you produce a fairly detailed map of this disease’s history, and see how very well defined it is sometimes spread, you can tell that such spatially dispersed things as showers, meteors, comets, solar energy, and many other pieces of the environment, cannot possibly be linked to a disease with such a well defined linear route for travel and population based diffusion pattern.
By the end of the cholera period of the 1850s, you could see how population plays an important role in the way diseases are transmitted. These observations and conclusion came just in time for the next form of disease to be mapped, as Chicago experienced its 1863 infectious bacterial disease epidemic known as erysipelas.
With urbanization so important to the development of Chicago, and the increase in problems induced by poor sanitation and crowded living conditions common to rapidly developed cities, we find that once Erysipelas struck Chicago, it was time for epidemiologists and physicians to review the health of people in relation to their manners of living, and then local topography, climate and natural features. For decades it was known that certain urban settings set the stage for miasma development. The latrines, the various bays and dumps where butchered animal parts were left to rot, the places where we set up our local dumps were all suspects whenever an endemic or epidemic erupted. This was the case for yellow fever, for dysentery, for cholera, and for typhoid, and was soon to be suspected when erysipelas made its appearance. Due to the relationship drawn between cholera and sanitation practices in recent years, the cause for erysipelas immediately turn to people first followed by the weather and the environment.
The way in which diseases were being mapped also directed some of these these new manners of disease diffusion to focus upon. A general theme for disease mapping by now included the use of several methods to depict small area patterns. Point or case mapping was a standard since the mapping of yellow fever in the late 1790s, a main problem with which was that point mapping left it up to the reader to connect the dots, like an assemblage of stars waiting for an alternative interpretation. Another interpretation of cases paid heed to the point-line migration patterns that temporal reviews provided us with. Still, neither of these compared with the increasingly popular areal/choropleth mapping technique and the case-specific circular radius/infectious disease maps considered an example of the first buffer map. Some of these more important forms of disease mapping were developed and used successfully in the 1850s were by German geographer Augustus Petermann, then residing and working in England. His early maps, based on his 1837-1845 experiences back in Germany, included a point density map of the population of Great Britain based on its 1851 census, and a map he drew up for the London cholera epidemic of 1832, in which areal based statistics were demonstrate rather than point data, using a choropleth display of data presented with a varying color and line pattern.
Petermann’s work was added to a year or two later by Dr. Henry Wentworth Acland, the results of which were published in 1856. Acland produced a contour map depicting deaths in relation to the contours depicting 5 foot elevation changes above the river in Oxford. Two forms of cholera were mapped and distinguished on this map–“Choleriac diarrhea” and “Cholera.” The former was centered in the city setting, the latter produced clusters of points most often closer to the river. A similar map was produced depicting the cases for the 1832 cholera epidemic, leading to the depiction of cases that demonstrated a tendency to aggregate or appear in clusters about the region, and to demonstrate an affinity for occurring in places close to the river. Using areal mapping, Acland used this to demonstrate a relationship between location and clustering habits to the place where these cases ensued relative to the “undrained districts” of the perimeters of Oxford. These maps differed significantly from the other most famous map series on cholera for this time–the urban-centered review of cholera in relation to a contaminated water well.
Global maps of disease were also becoming a standard now, initiated by Berghaus’s map, the replacement for Schnurrer’s map (1927/1931) on which text was used to note differences instead of symbols, Berghaus’s work was Adolph Muhry and Alexander Keith Johnston’s maps, both of which were about to be succeeded by William Aitken’s 1866 global disease map. The major limit to these maps was their use of diffuse regions to define disease prone areas, which allowed the map-reader’s imagination to take over and see the spatial relations that would have never emerged possibly, had it not been for the production of a map. This is exactly where we stand with Hamill’s map. Hamill left up to the curious reader to read his interpretation of erysipelas, compare this with what he/she and draw the final conclusions as to whether Hamill’s interpretation was right or not. The focus of the 1860s map was still mostly on the symptoms for defining disease types or classes. This made the cause and effect, environment-people relationship still open to the imagination and knowledge base of the observer. The more we knew, the more it became for us to come up with a conclusion about the disease’s cause, and why it behaved so differently and uniquely from the rest.
.
.
