The 1890 Census Disease Maps
.
This is primarily a review of the color, and black and white, disease maps.
There are four sections:
1. National Maps in Color
2. Regional Maps of Diphtheria
3. National Maps in Black and White (poor quality)
4. Appalachia – Evaluation and Comparison
.
A few notes are added.
A number of other maps from this time are interspersed for comparison.
At the end of this page, I focus on impoverished Appalachia, in search of any regionalism within these medical statistics that might have existed back then.
Other “regions” that pop out are the northern latitudes European group with its older age population relationships, a scattering of the farming community related disease patterns like the enteric fever regions, and some very rural community health problems.
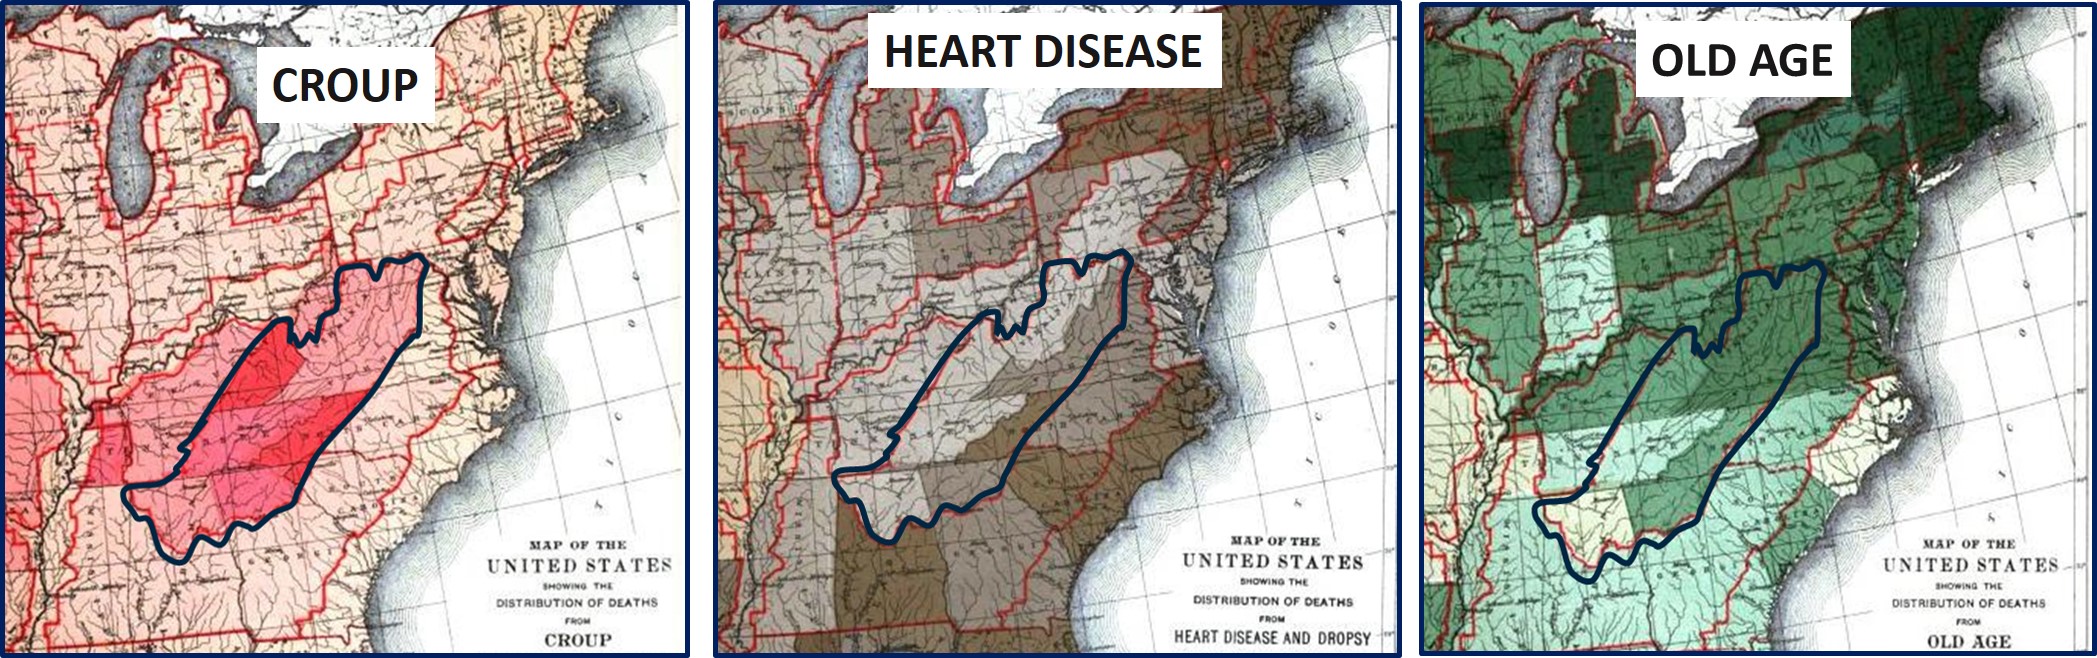
In terms of human ecology and medical topography, my most interesting finding pertained to croup, reviewed as part of the final section.
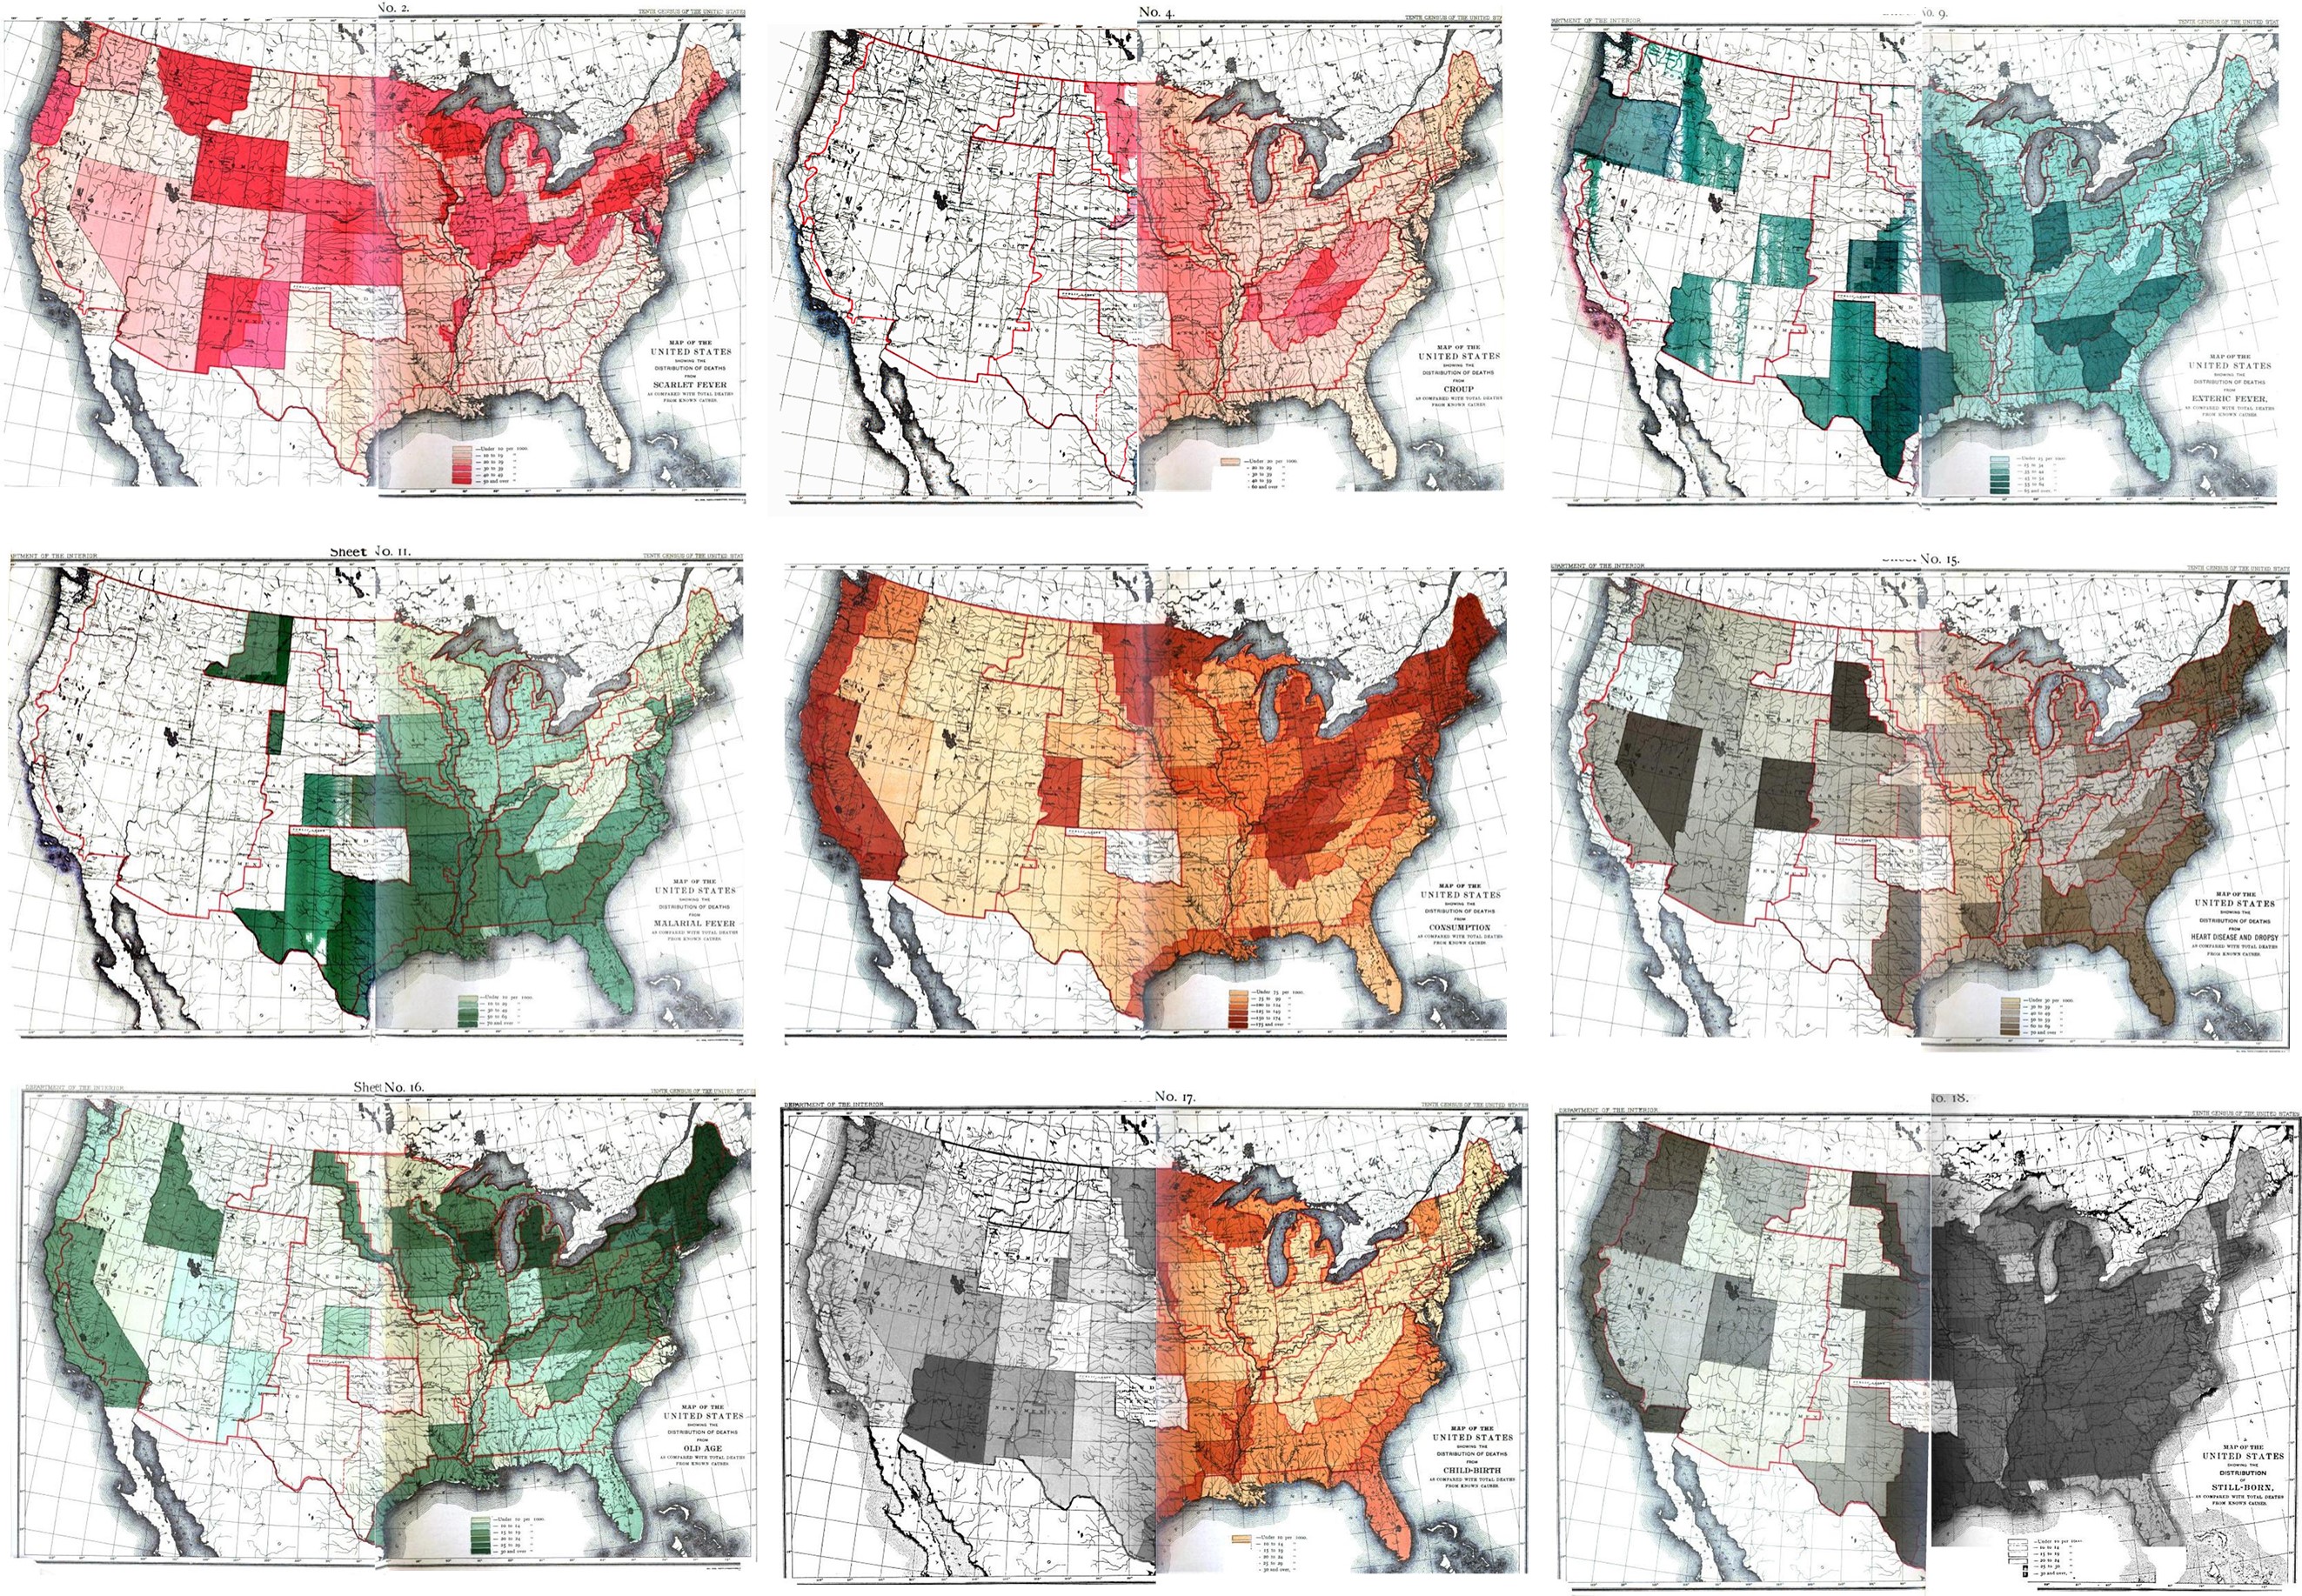
Scarlet Croup Enteric Fever
Malaria Consumption Heart Disease/Dropsy
Old Age Childbirths Stillborns

SECTION 1 – National Maps
.
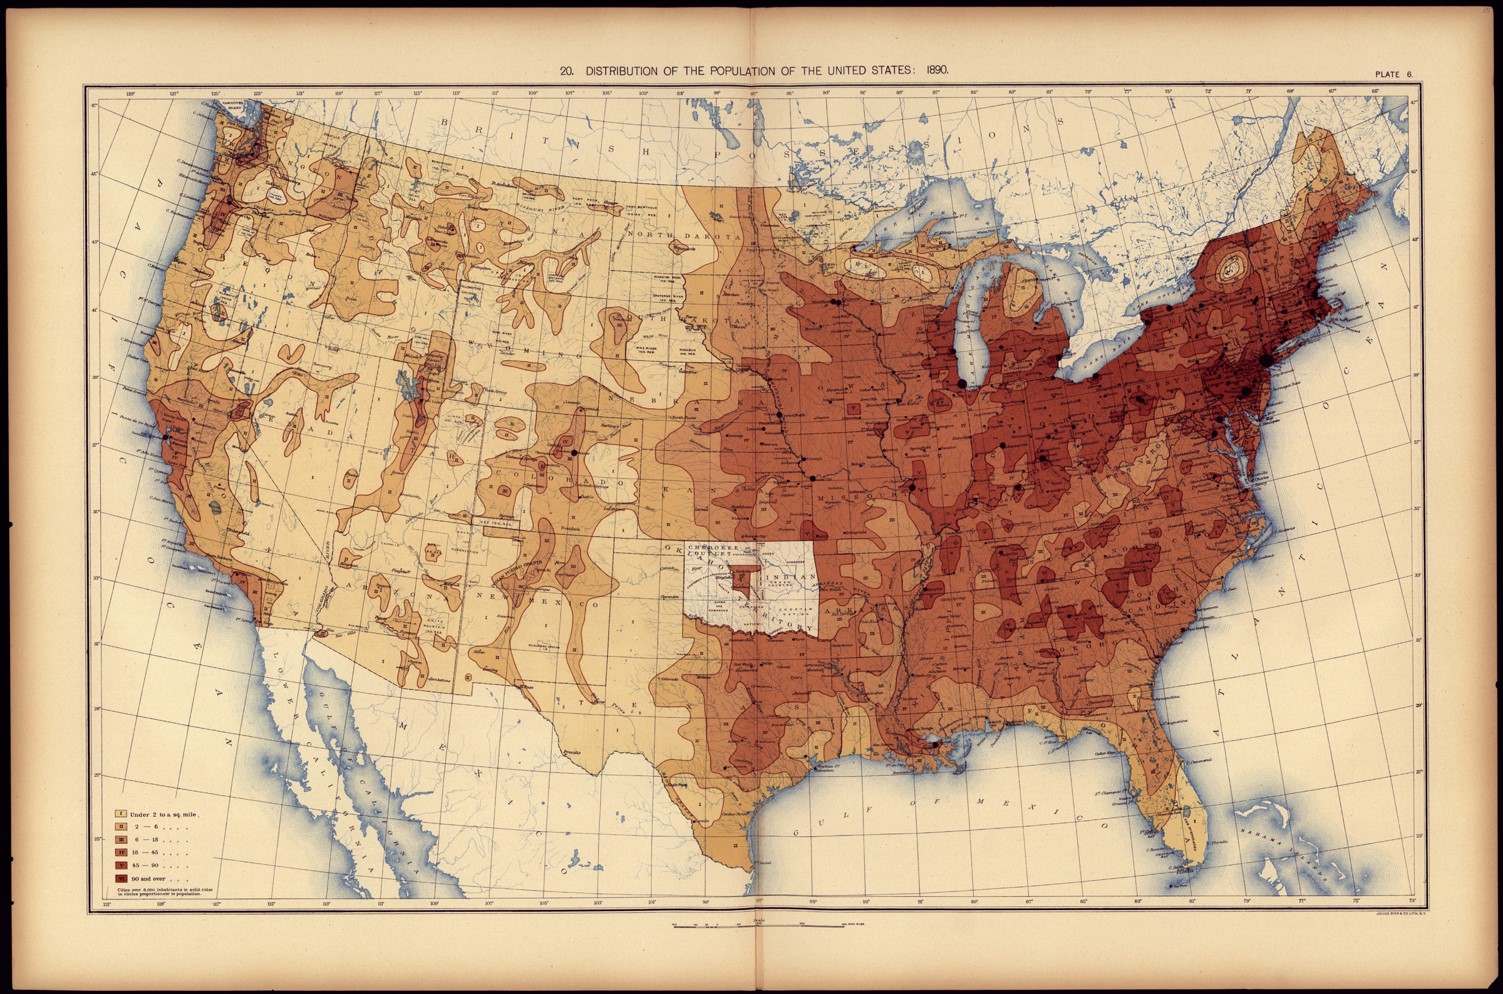
1890 Population Density
.
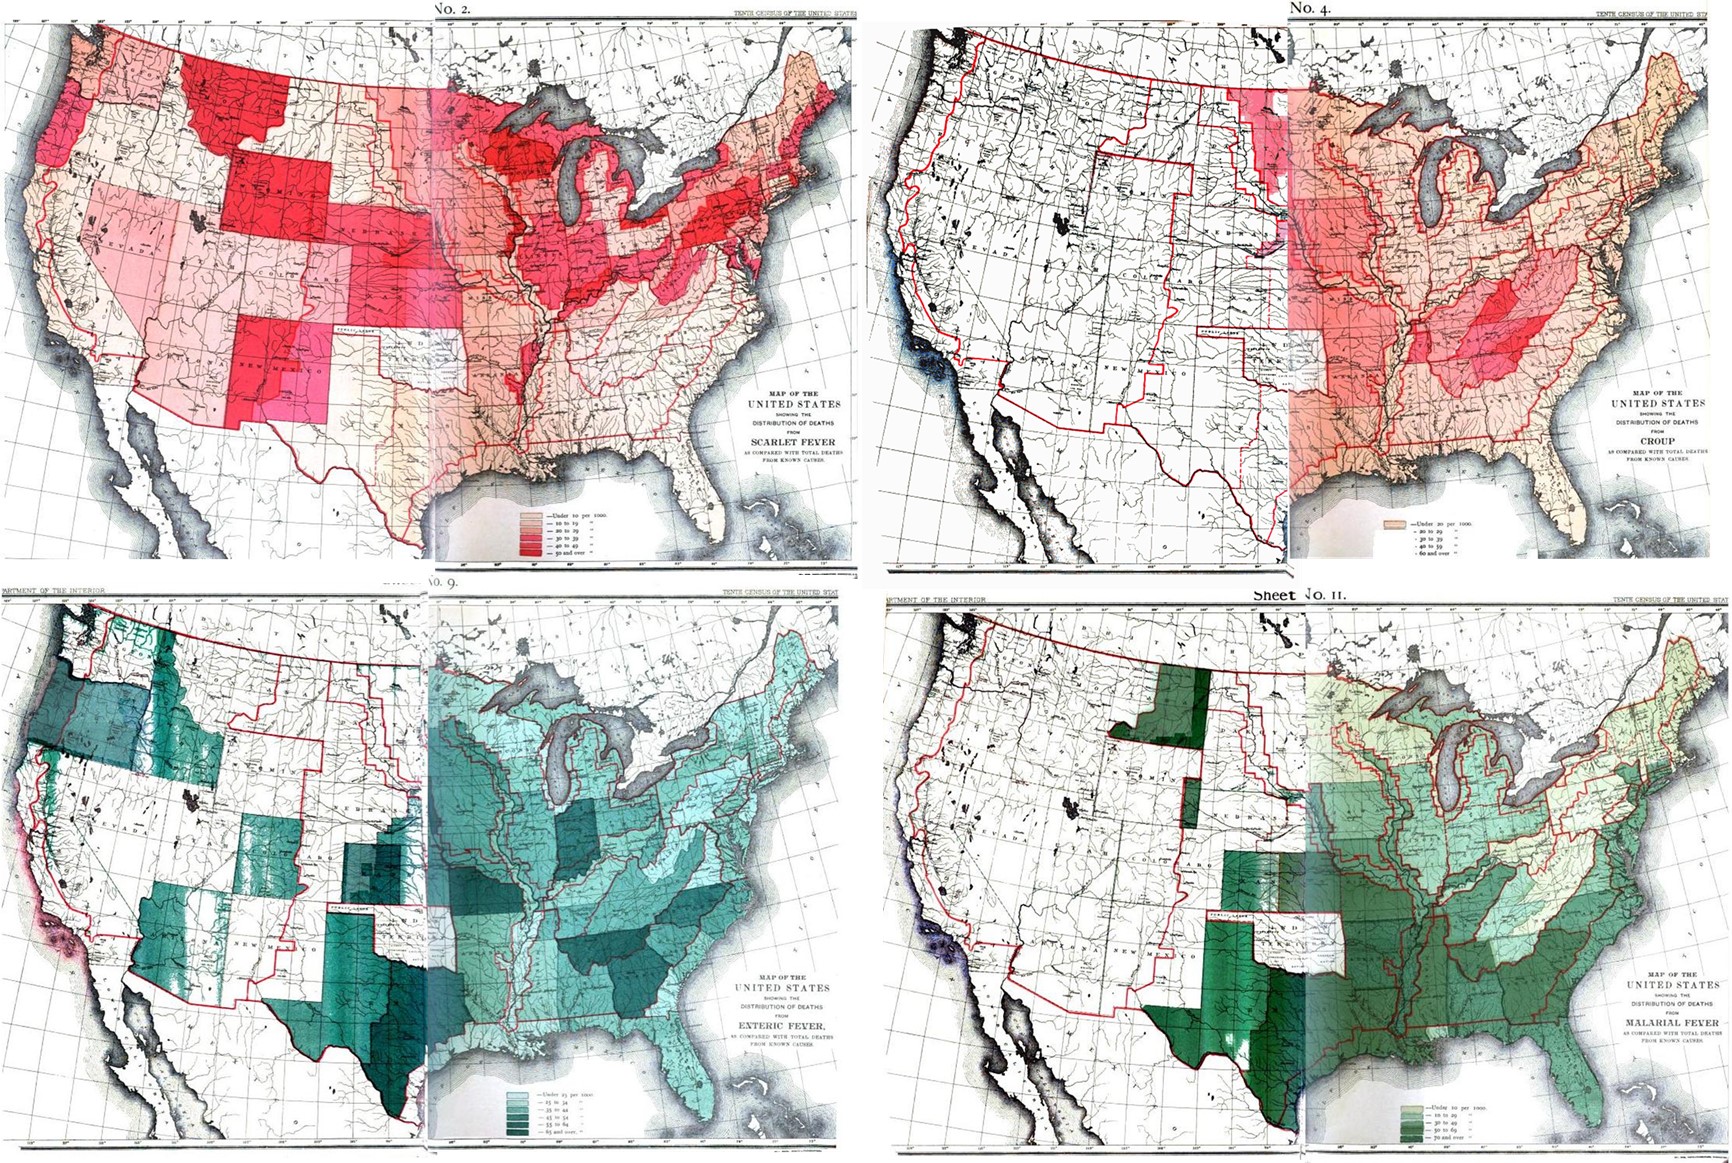
Scarlet Fever Croup
Enteric Fever Malaria
.

1890 Railroads
.
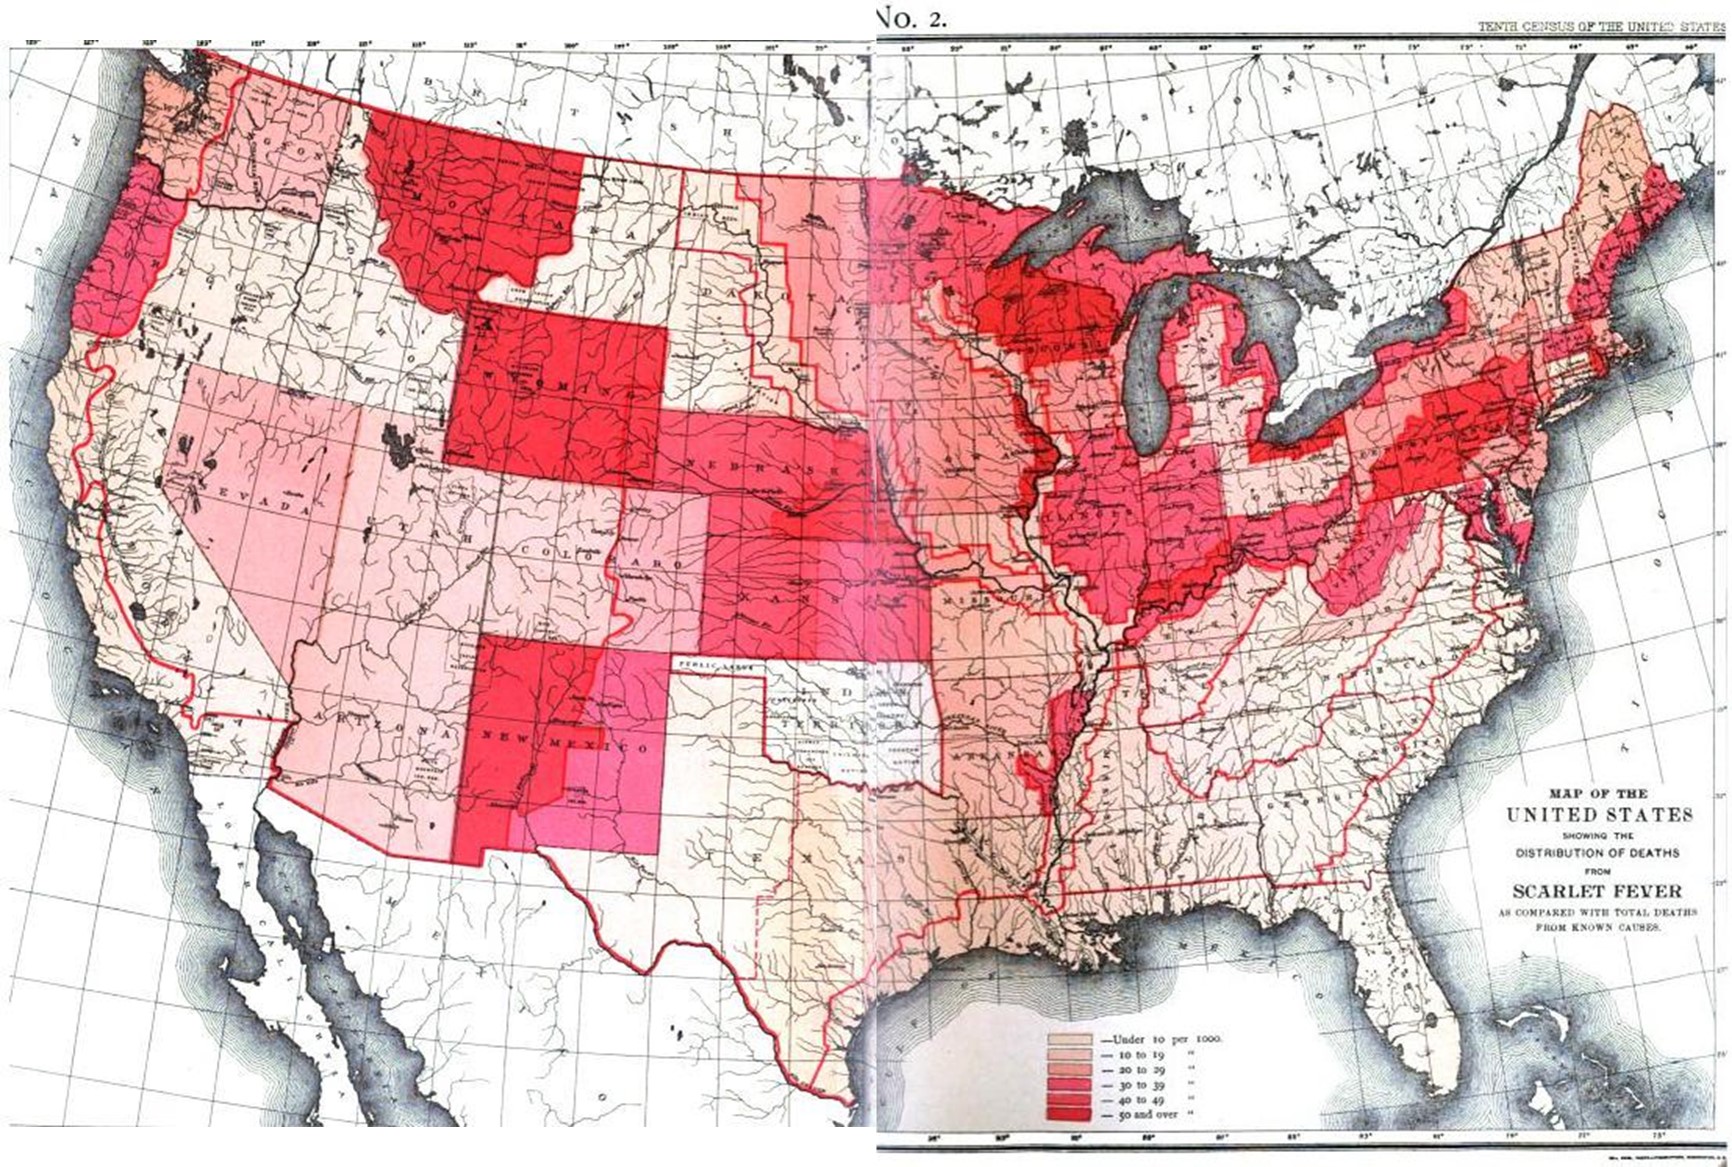
Scarlet Fever
.
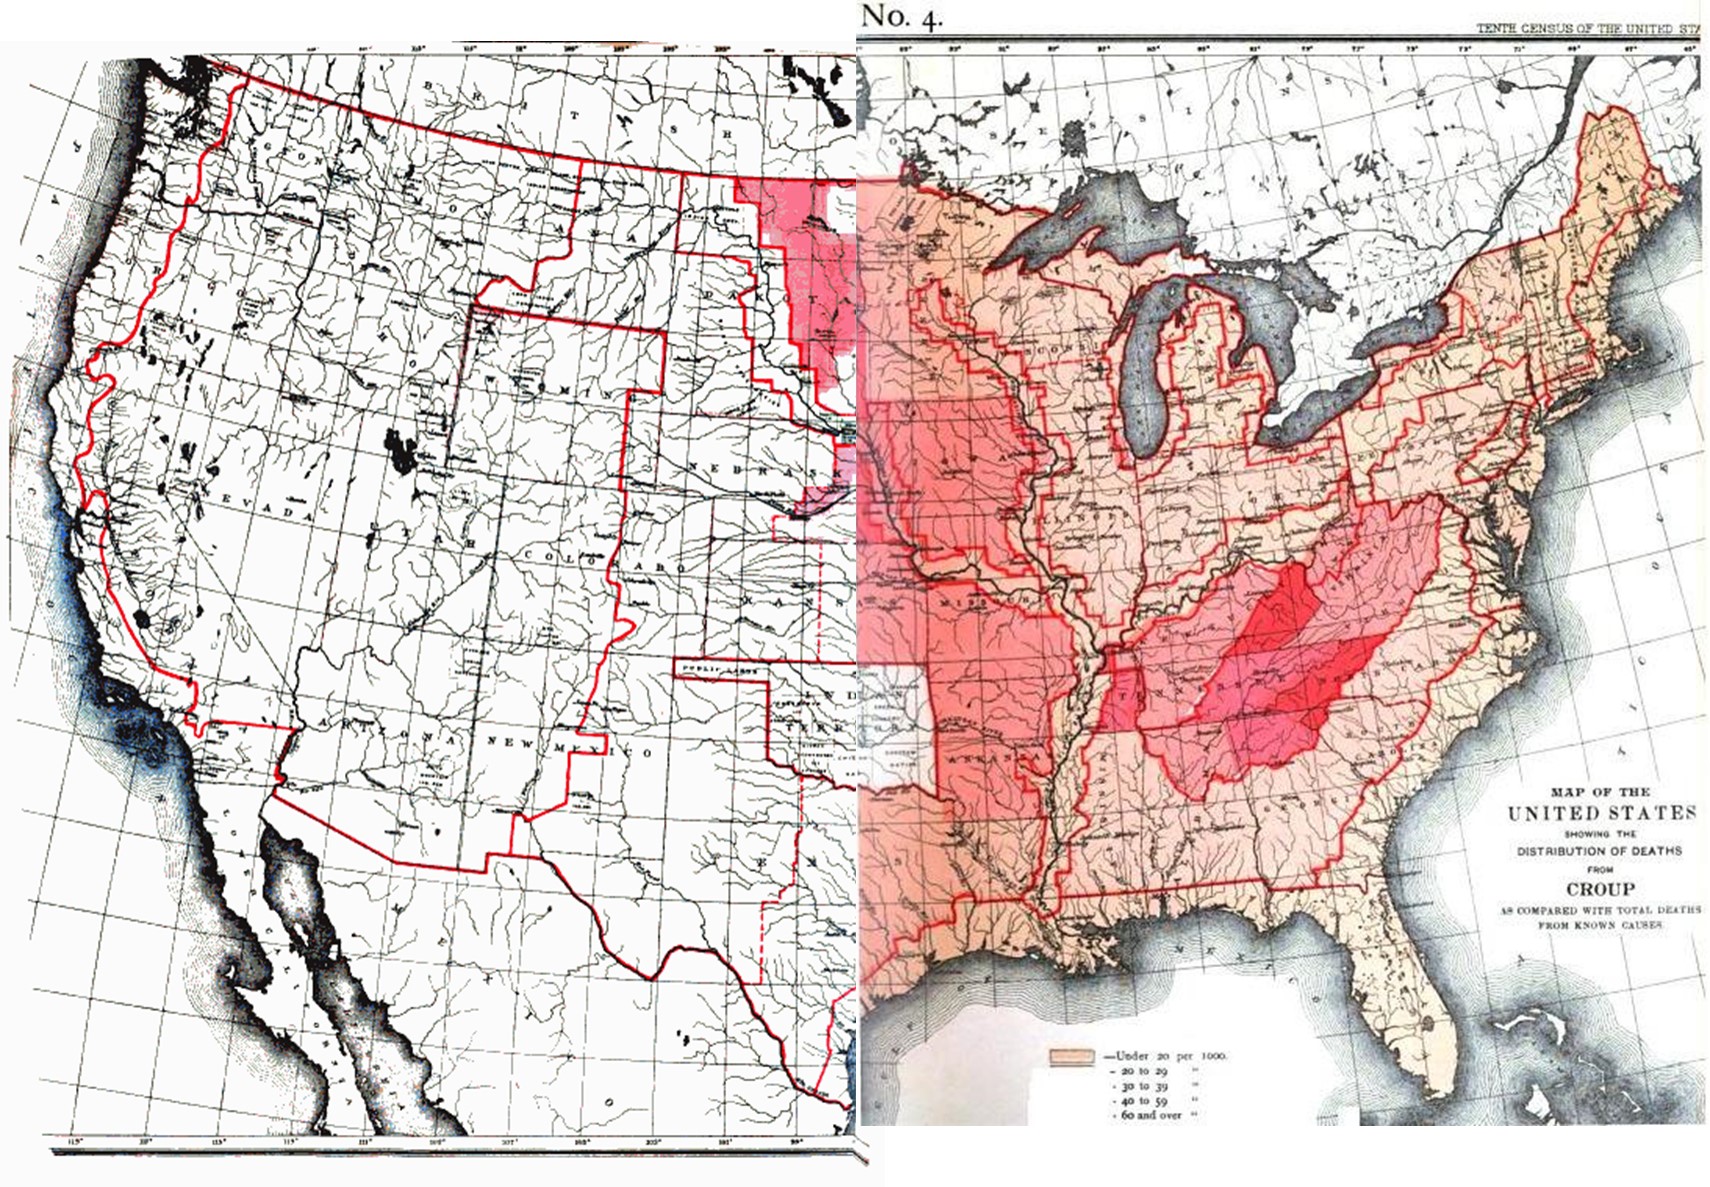
Croup

.
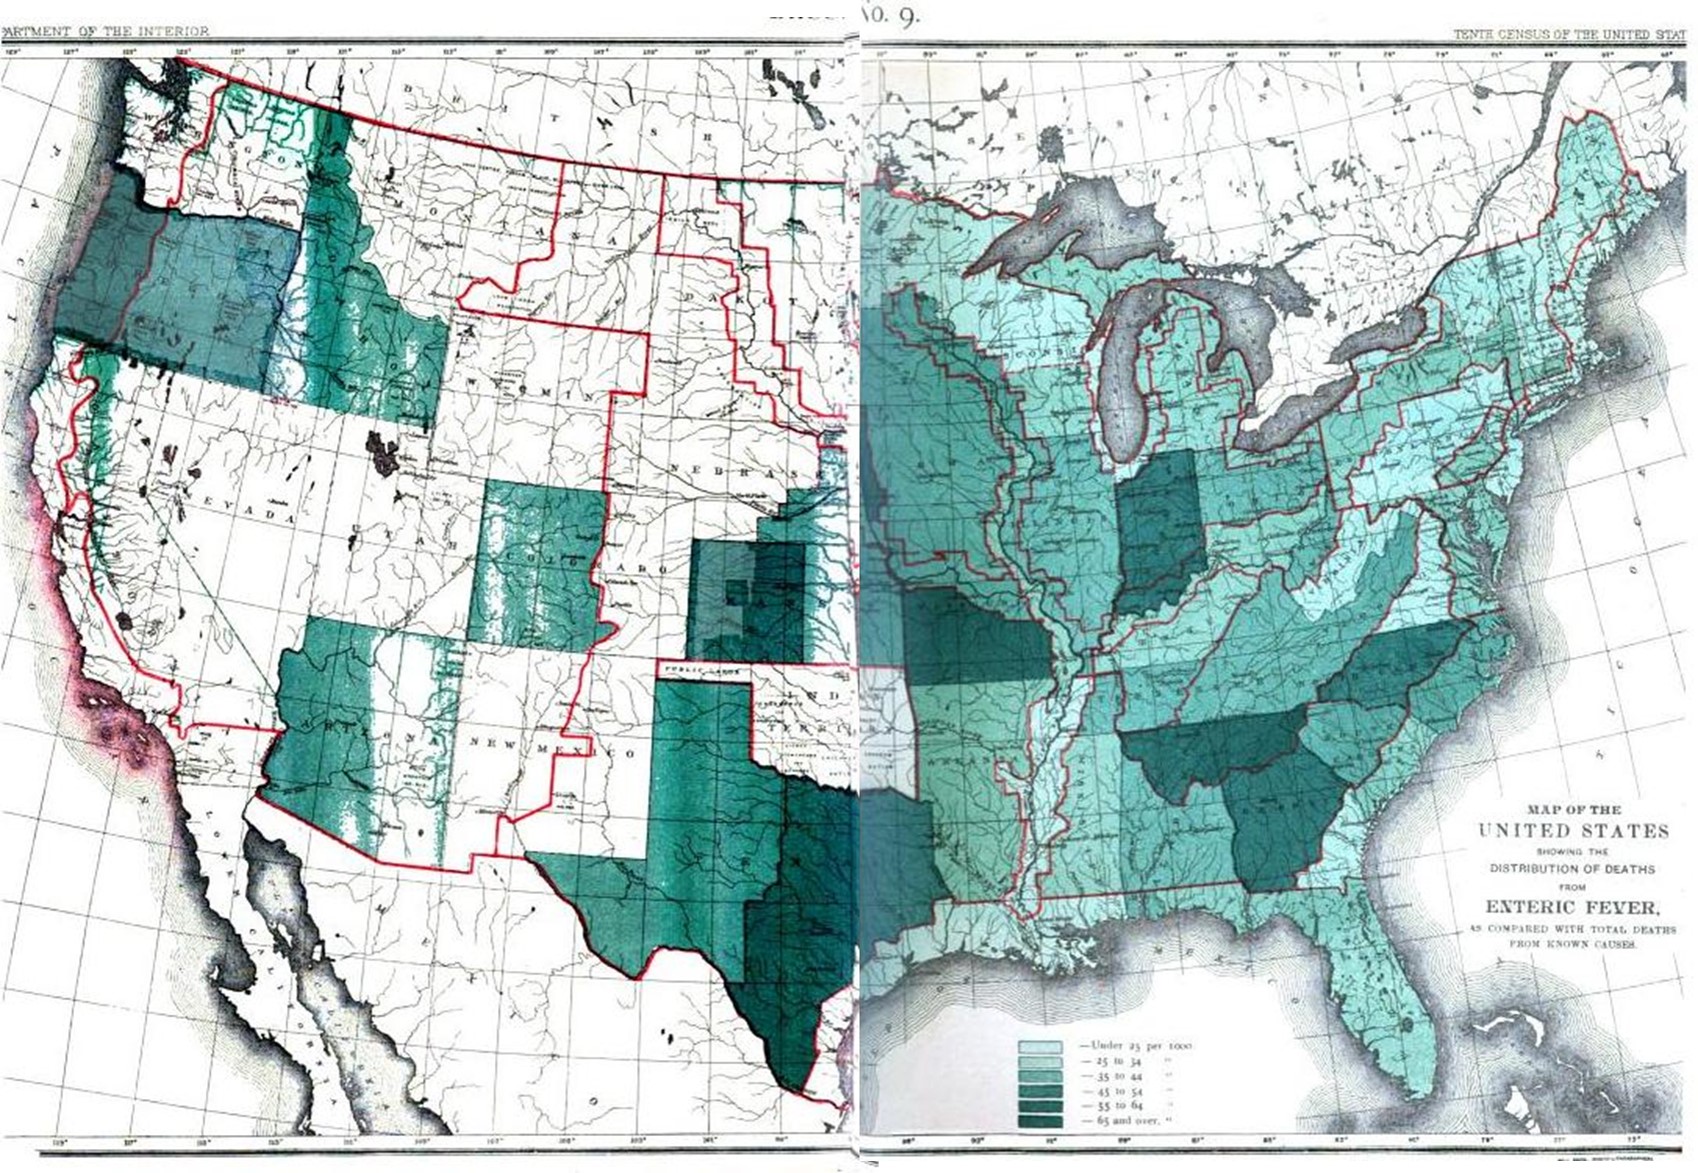
Enteric Fever (Salmonella, incl. S, typha)

.
1890 US Census Population Density
.
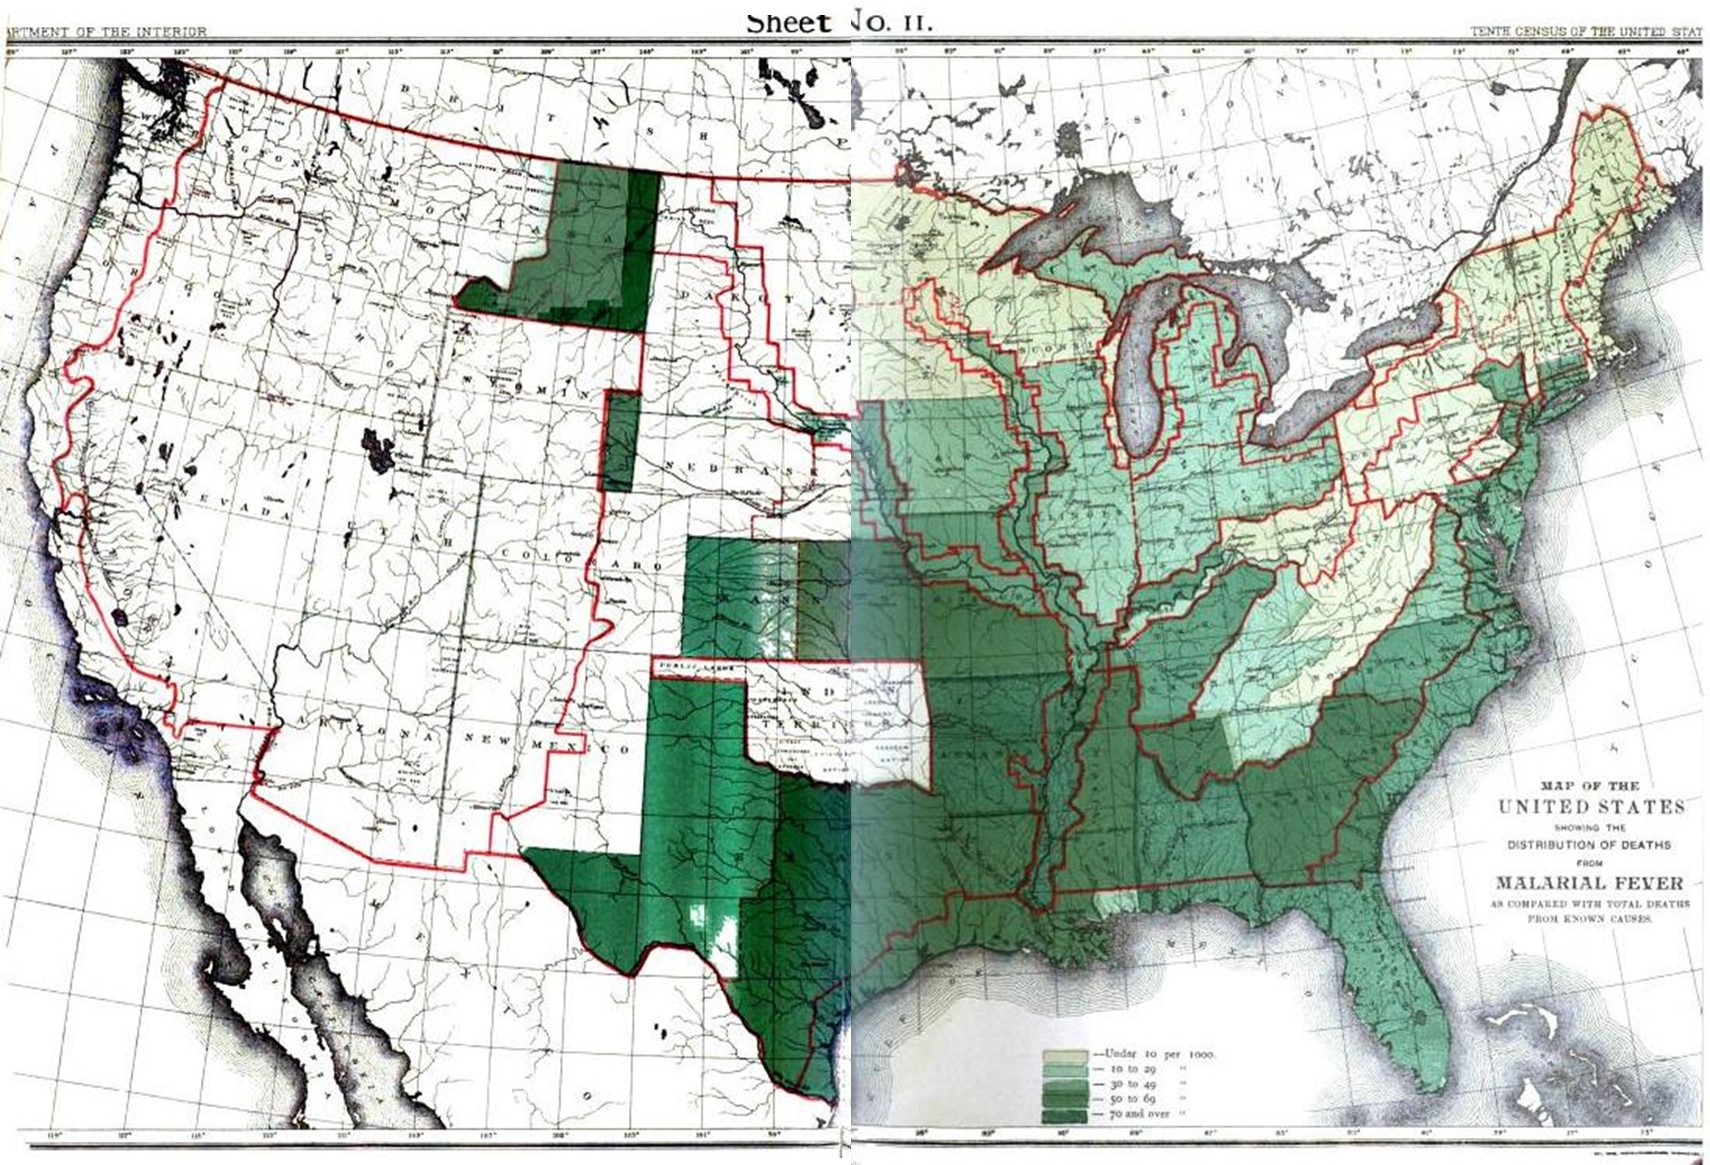
Malarial Fever
.
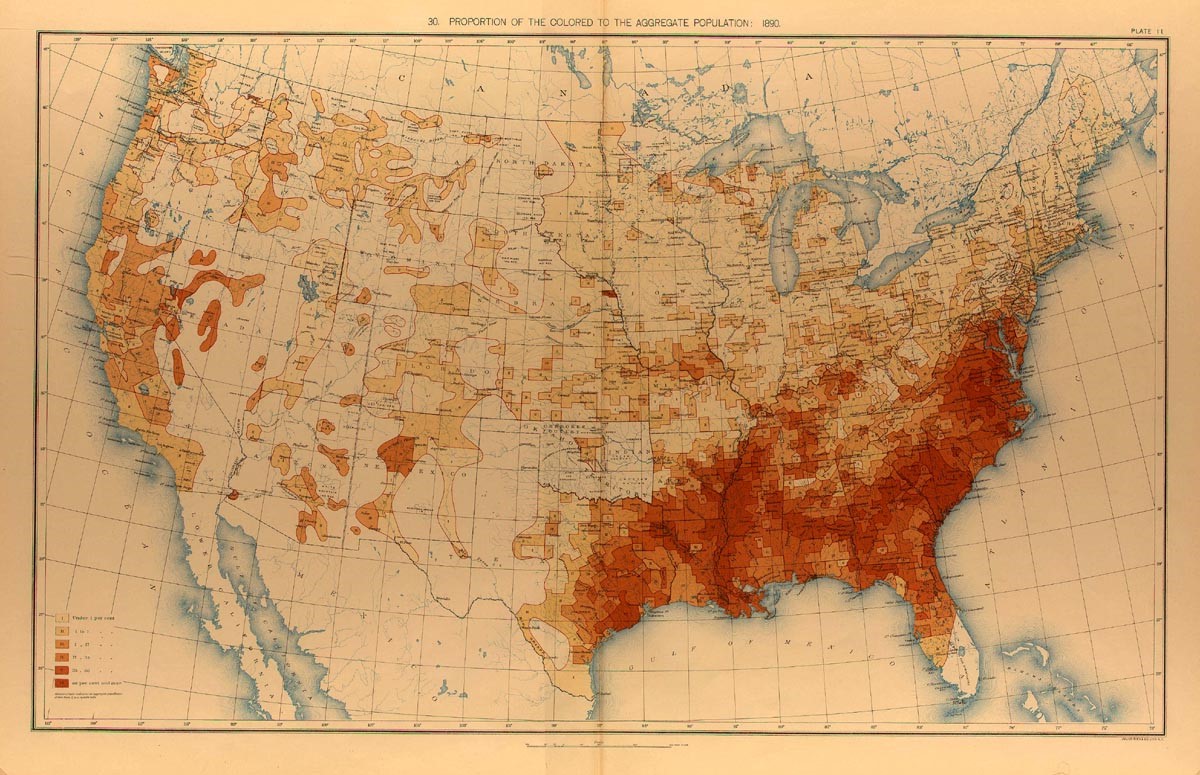
US 1890 Census Population Aggregates – African American
.
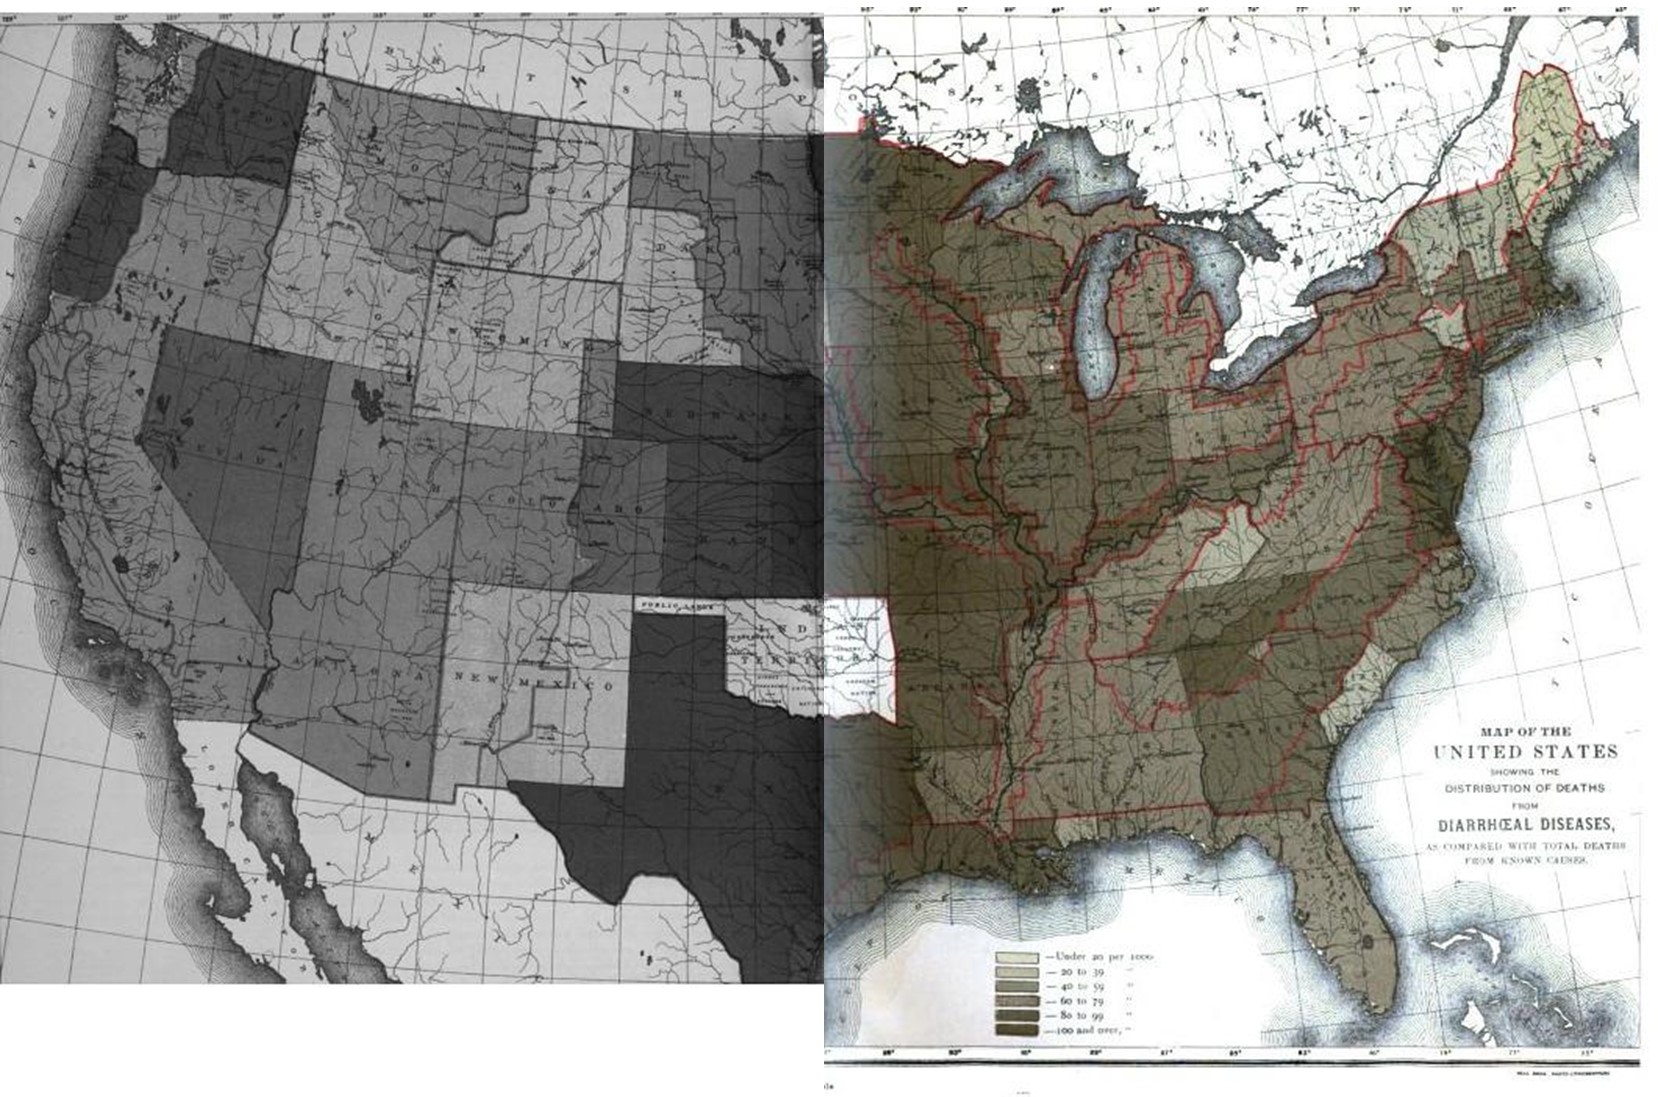
Diarrheal Disorders
.
Consumption, Heart Disease/Dropsy (left ventricle failure), Old Age
.
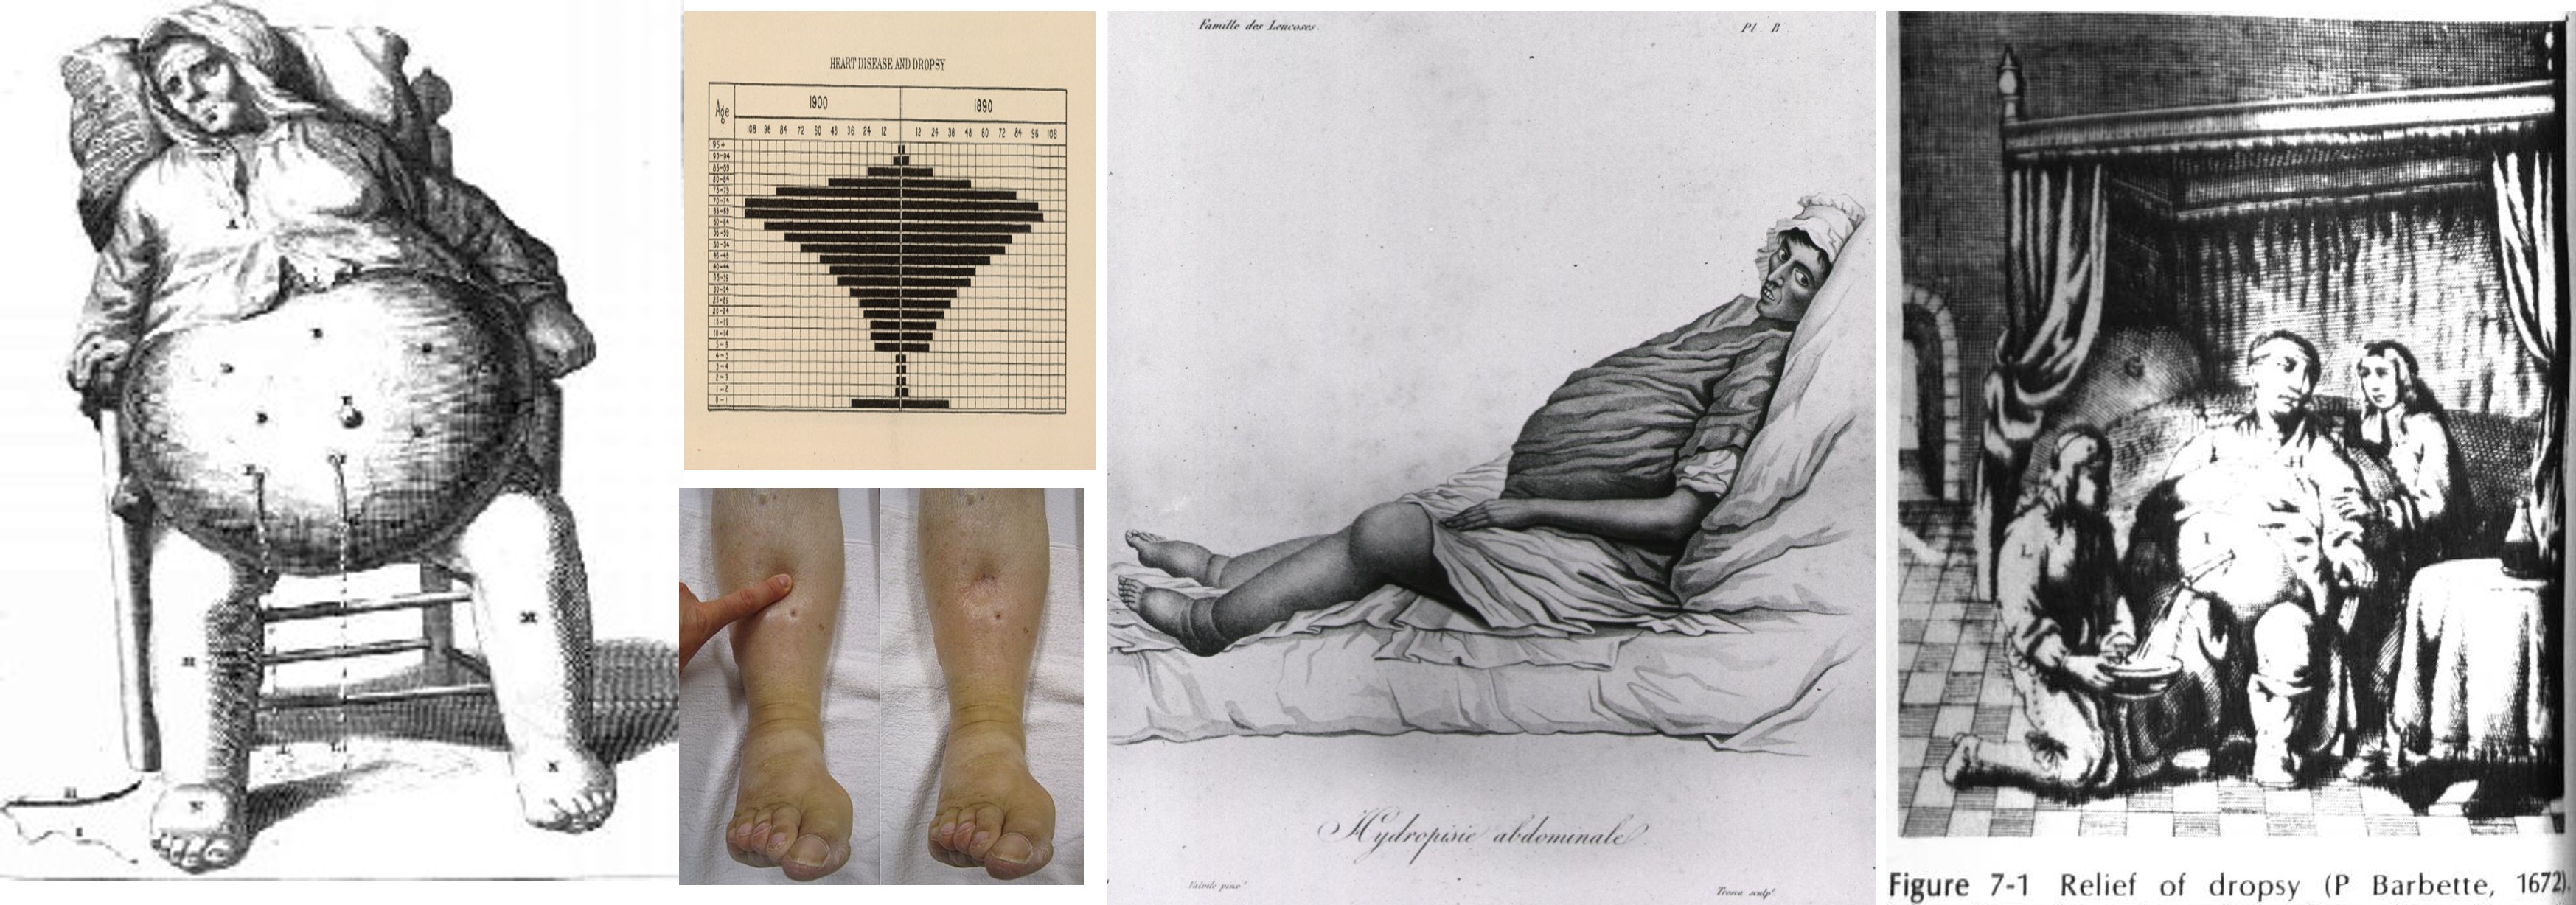
Dropsy, usually due to heart failure, is a chronic, extensive, edema with substantial intraabdominal involvement, usually treated traditionally with punctures ca. 18th C. Modern cases of edema are primarily seen peripherally.
.
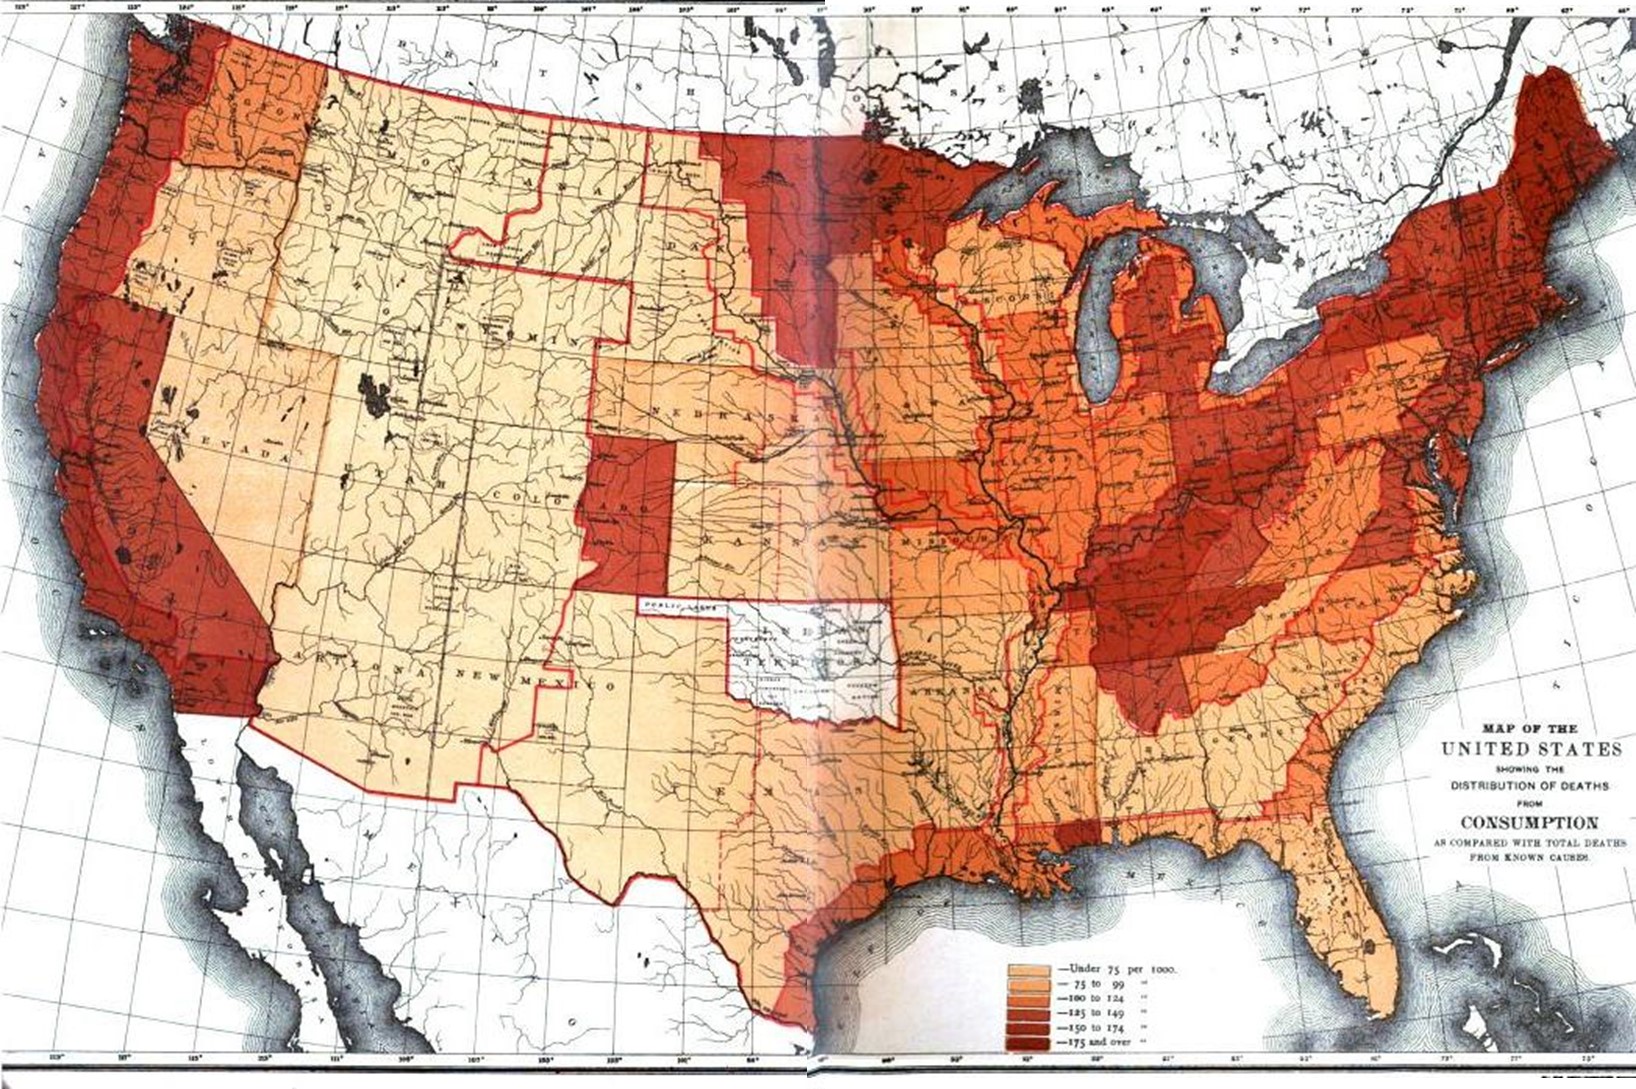
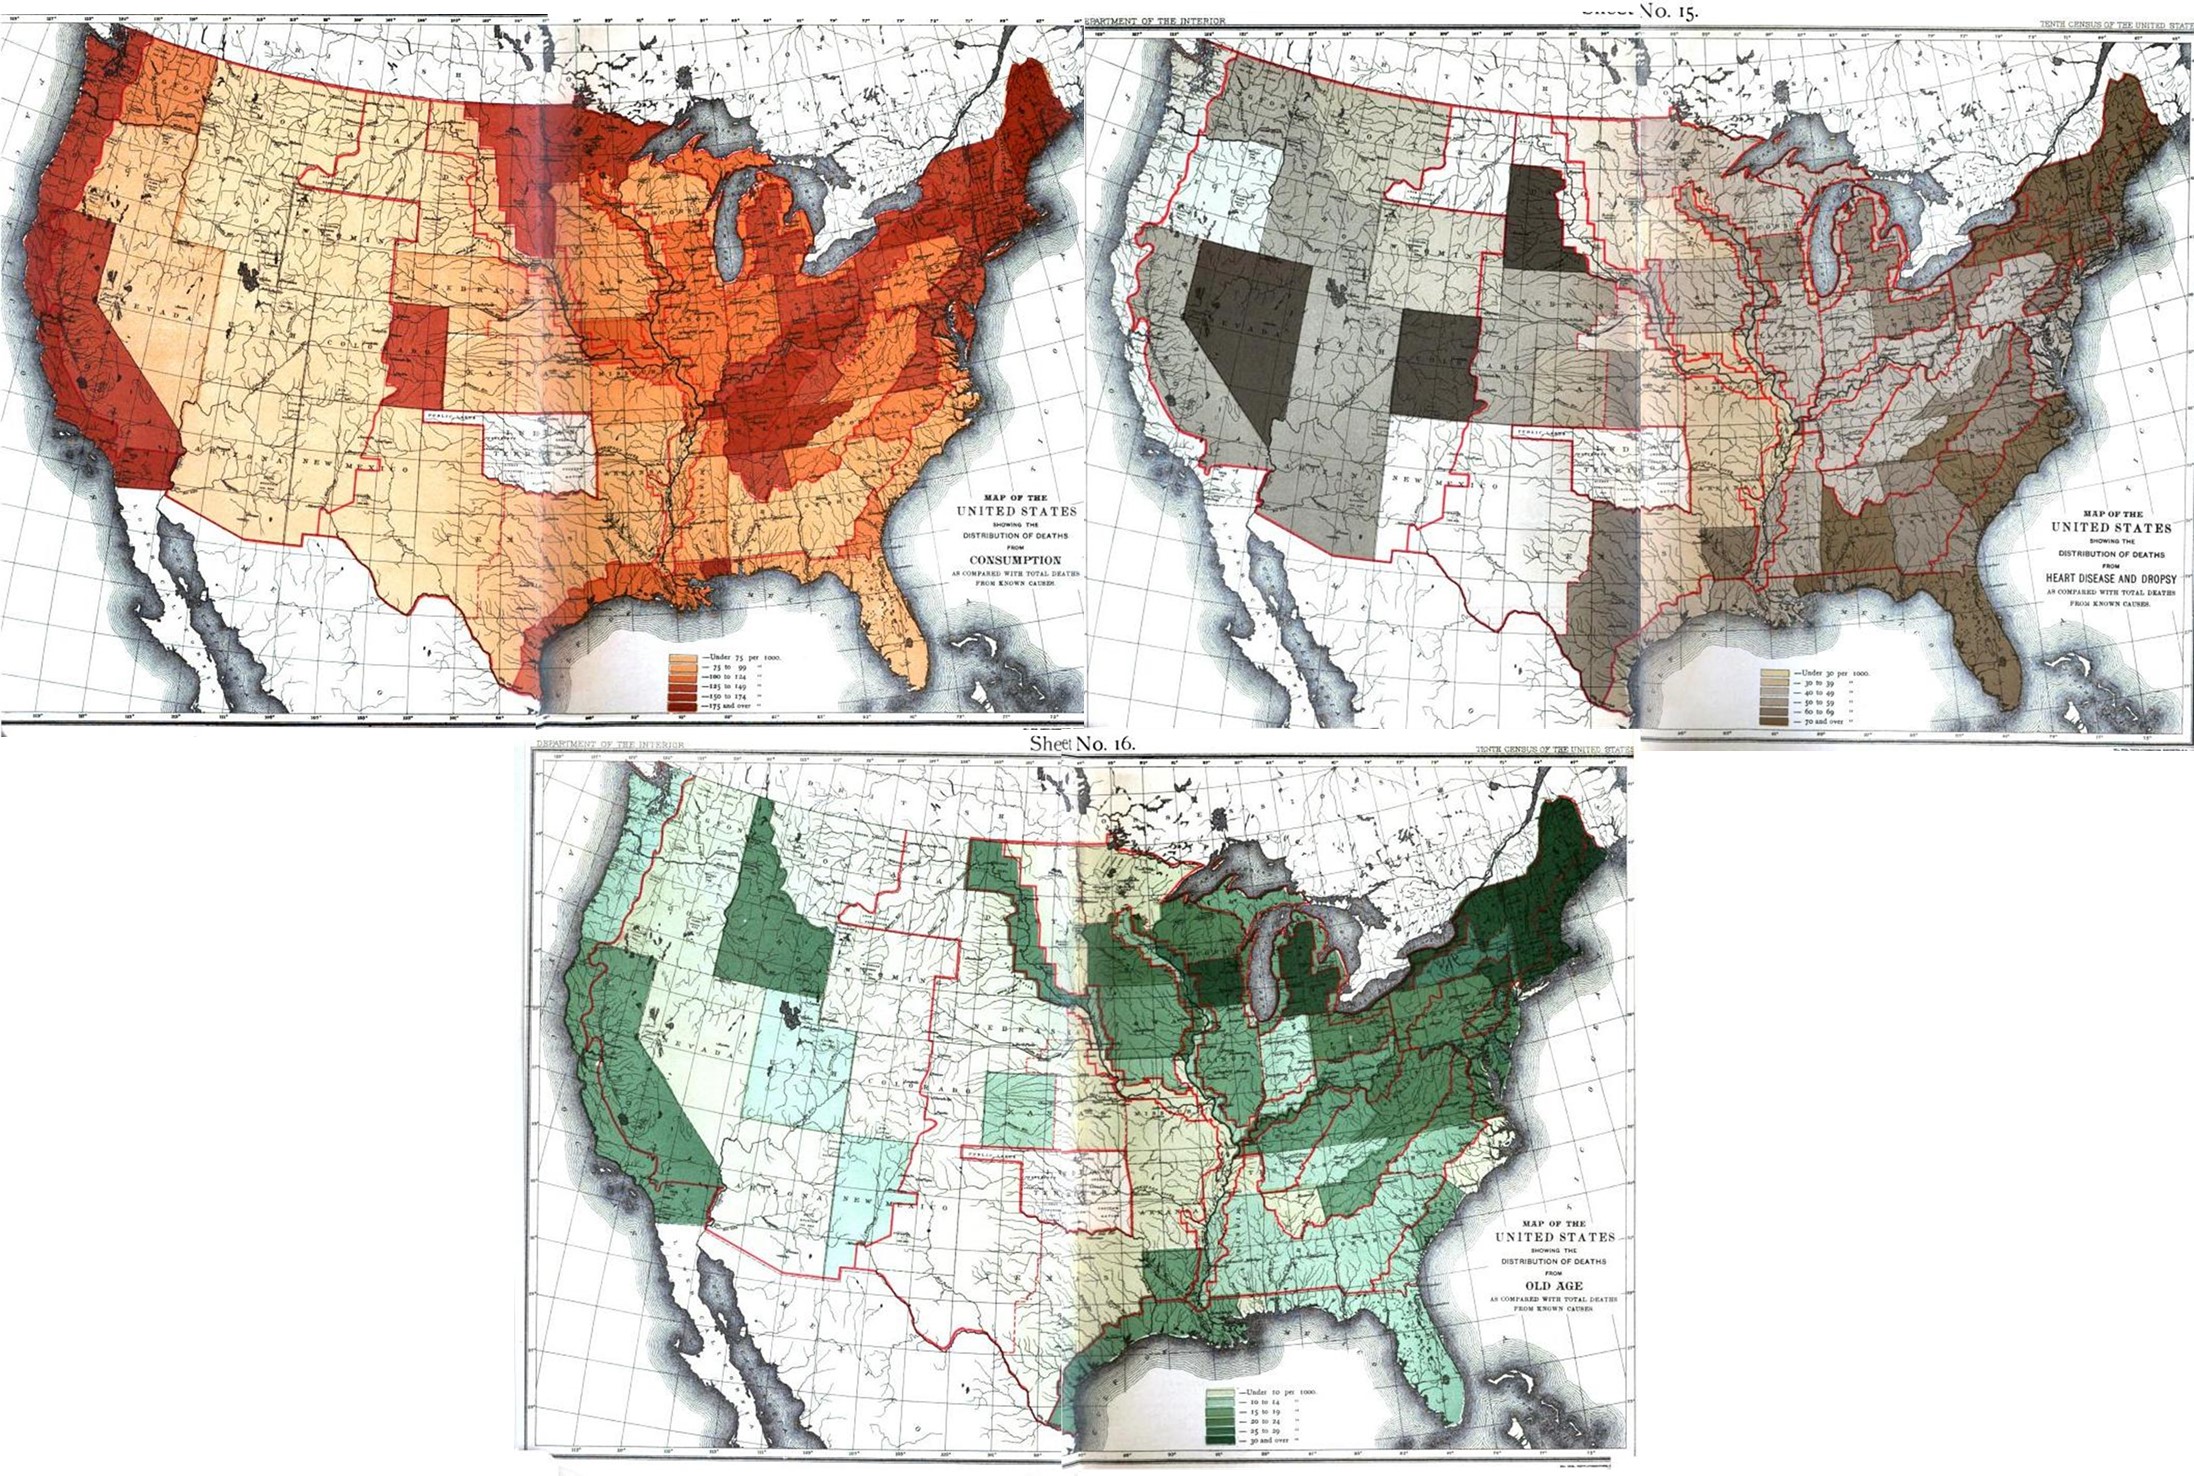
Consumption
.
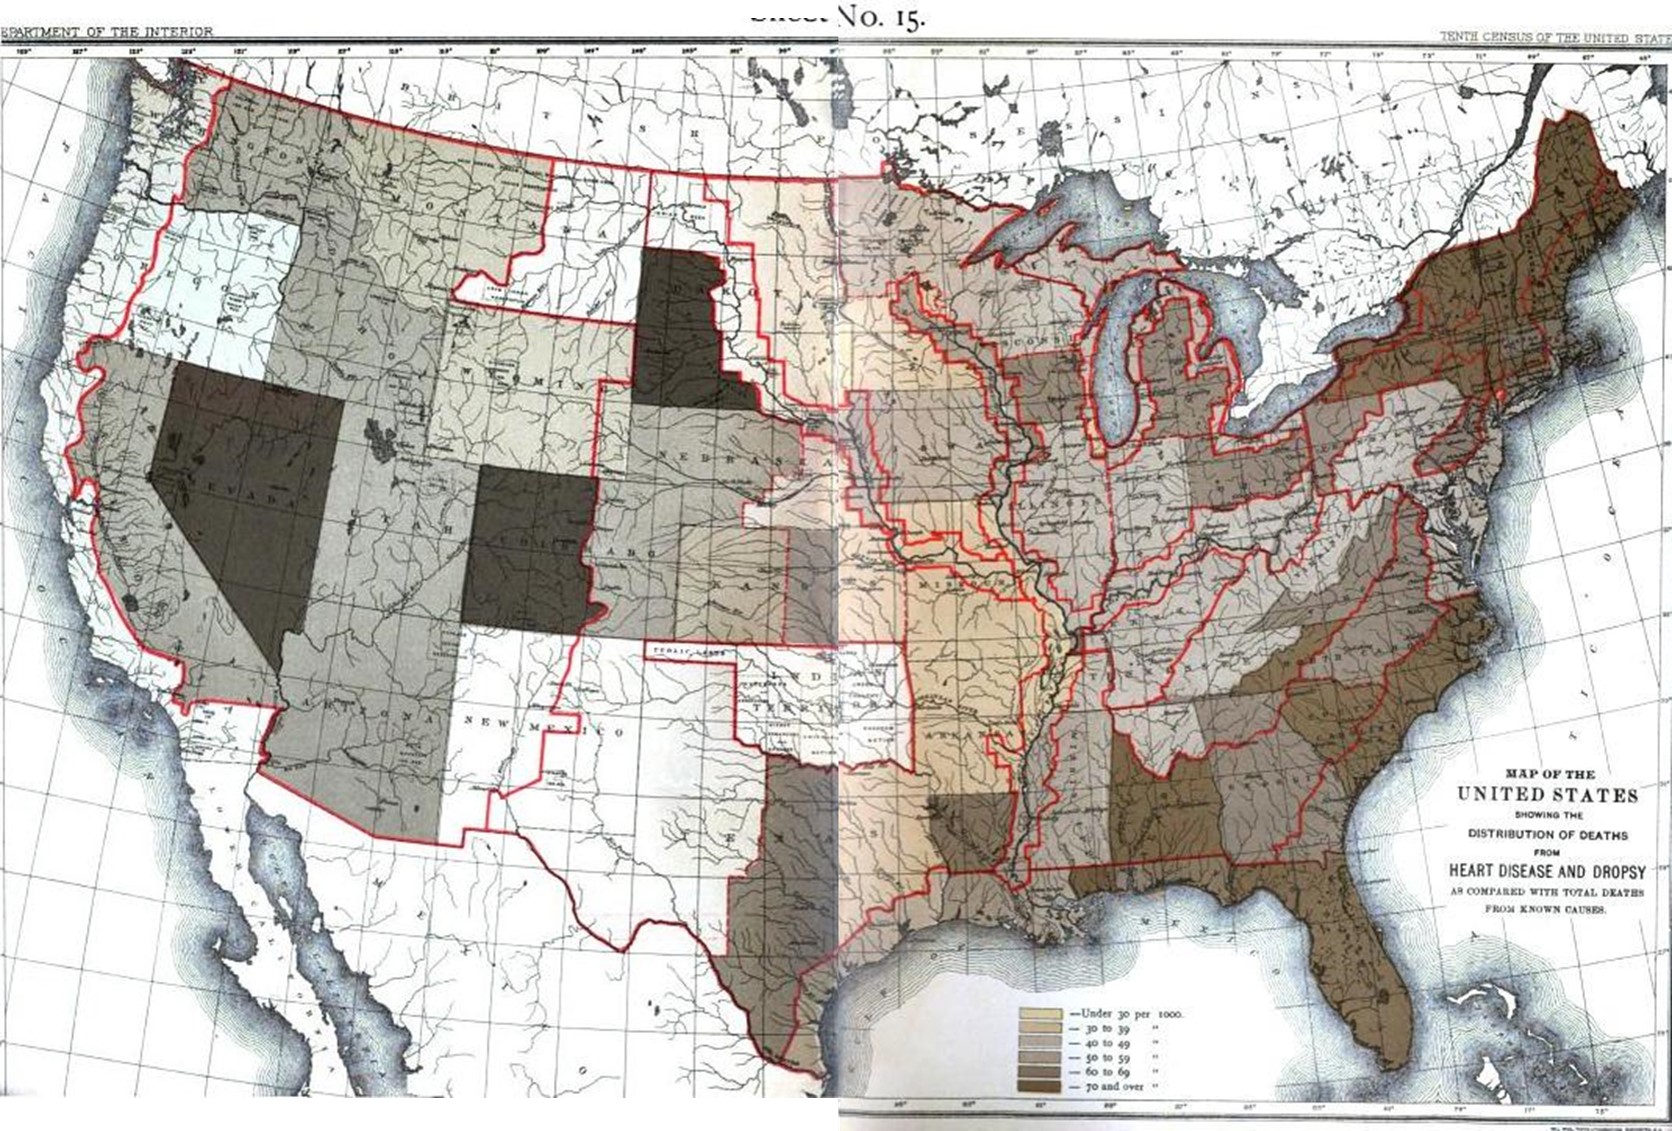
Heart Disease and Dropsy
.
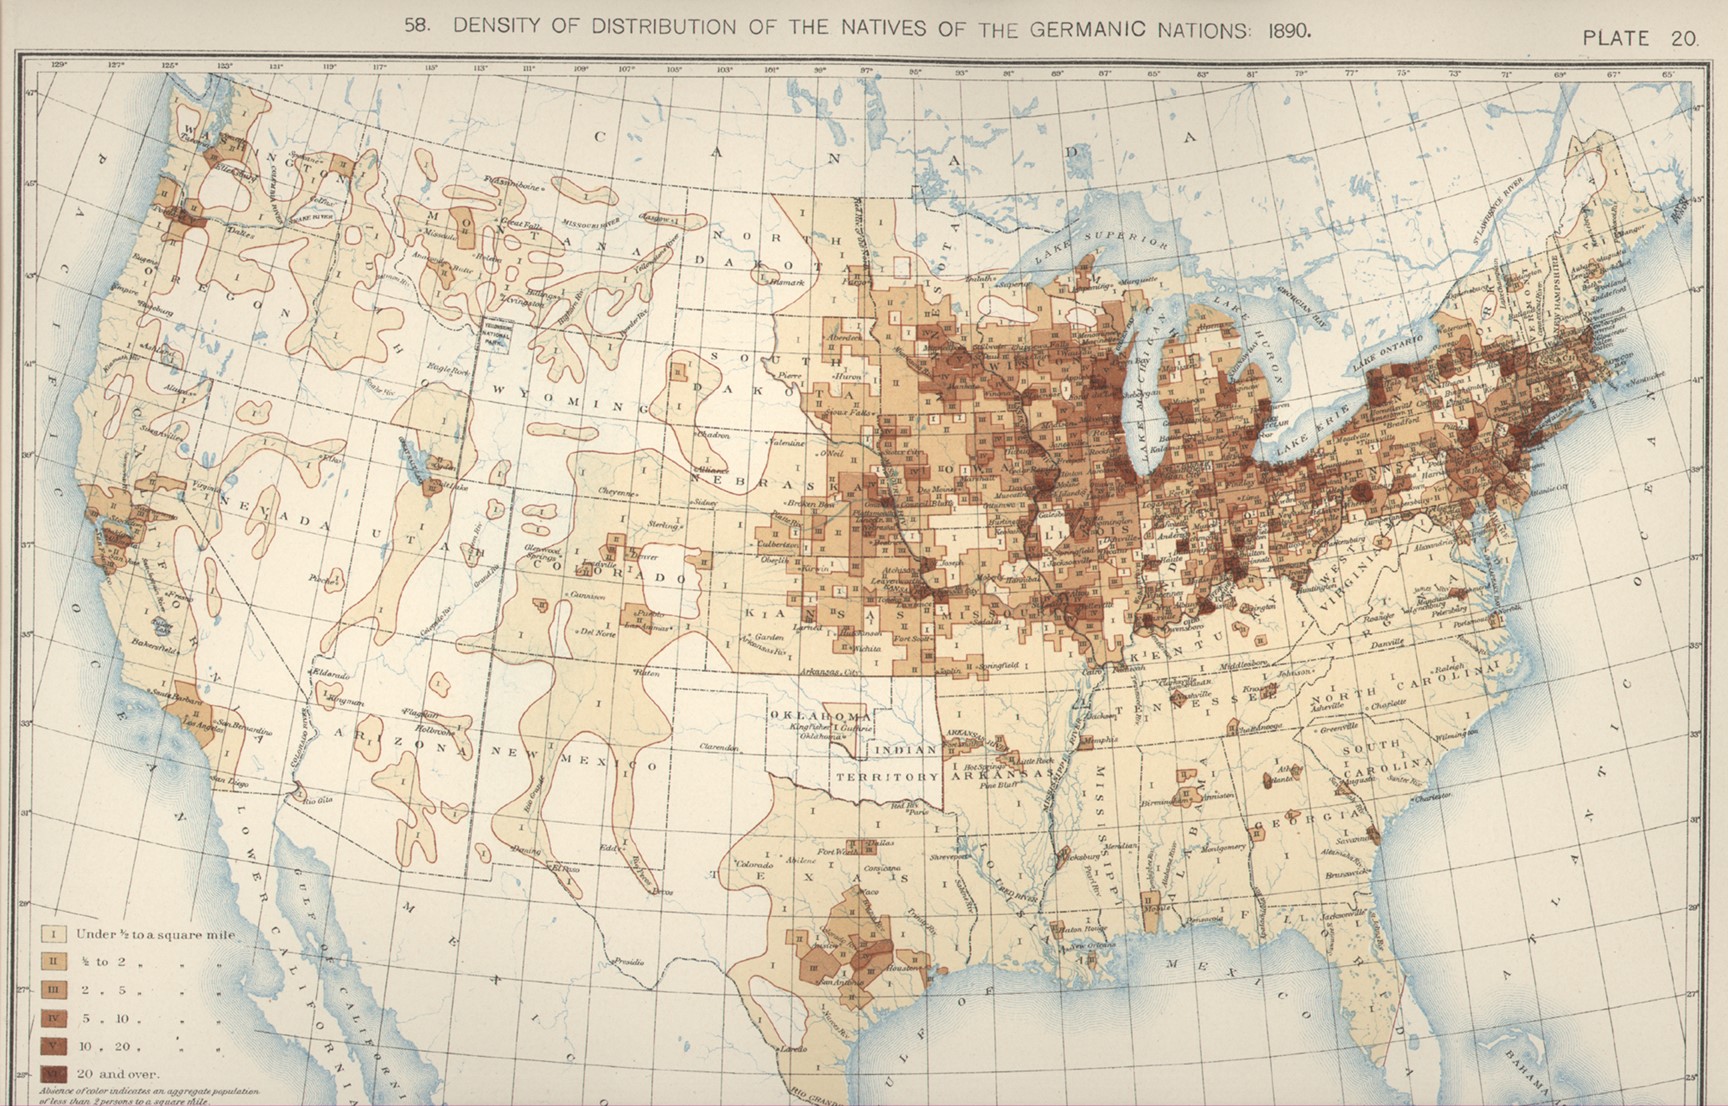
1890 Census – Germanics
.

Old Age
.

Childbirths (left) and Stillborns (right)
.
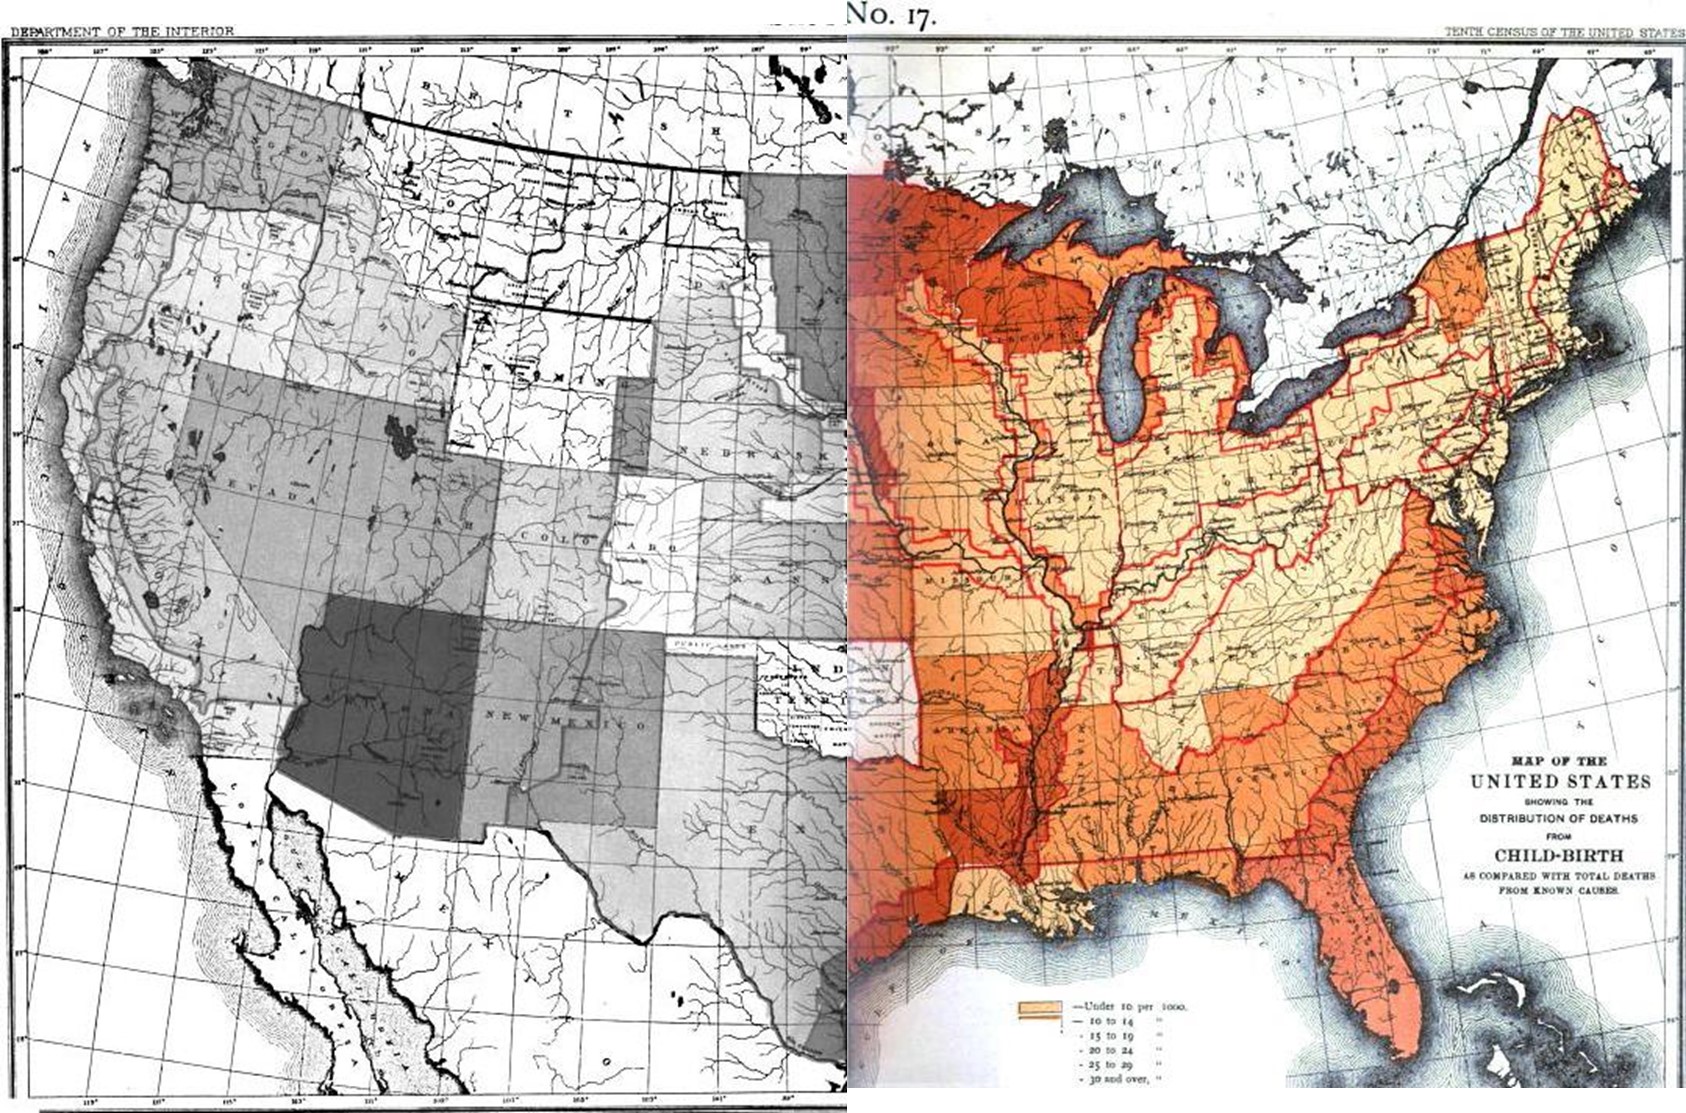
Childbirths
.
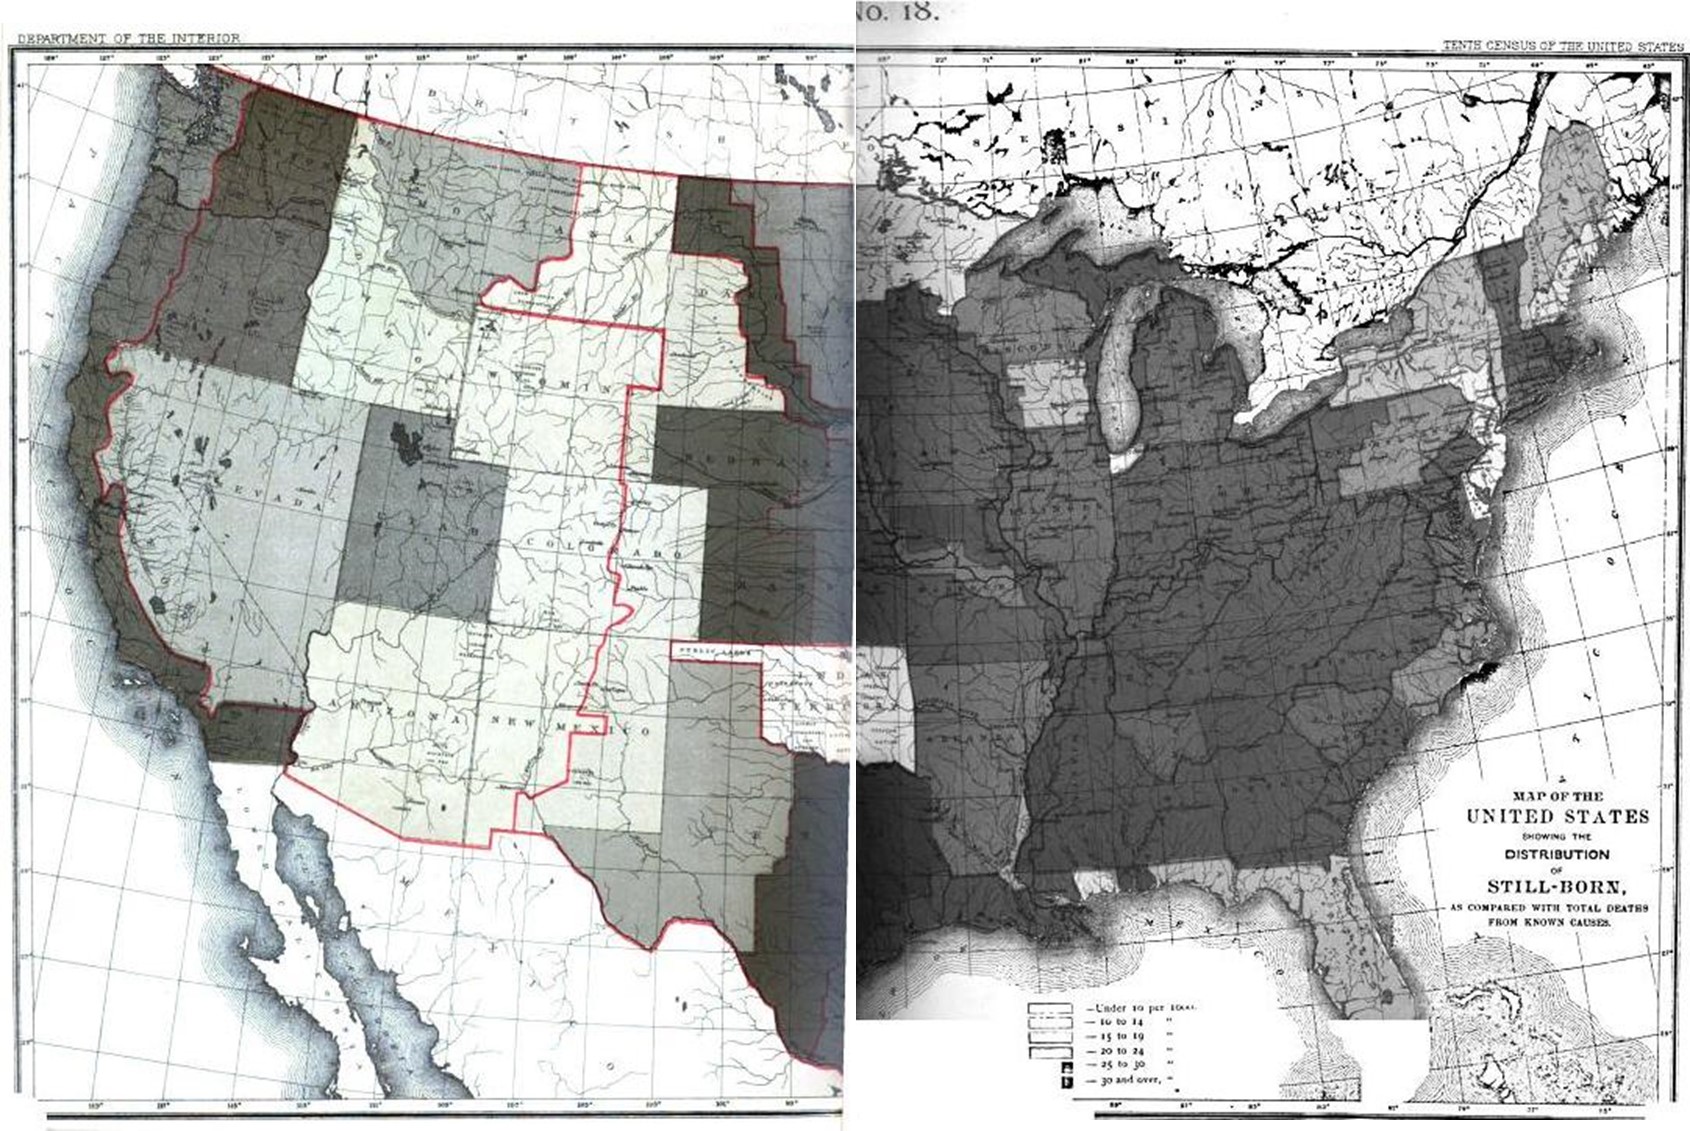
Stillborns
.
SECTION 2 – Regional Maps of Diphtheria
.

To put this 1890 census map of diphtheria into context, in particular the emphasis on county level data, the following information from Wikipedia is provided:
[BEGIN QUOTE]
1613, Spain experienced an epidemic of diphtheria. The year is known as “El Año de los Garotillos” (The Year of Strangulations) in history of Spain.[14]
In 1659, Cotton Mather described diphtheria as Malady of Bladders in the Windpipe.[15]
In 1735, a diphtheria epidemic swept through New England.[16]
Before 1826, diphtheria was known by different names across the world. In England, it was known as Boulogne sour throat, as it spread from France. In 1826, Pierre Bretonneau gave the name to disease as diphtérite (from Greek diphthera “leather”) describing the appearance of pseudomembrane in the throat.[17]
In 1856, Victor Fourgeaud described an epidemic of diphtheria in California.[18]
In 1878, Queen Victoria’s daughter Princess Alice and her family became infected with it, causing two deaths, Princess Marie of Hesse and by Rhine and Princess Alice herself.
In 1883, Edwin Klebs identified the bacterium and named it Klebs-Loeffler bacterium. The club shape of bacterium helped Edwin to differentiate it from other bacteria. Over the period of time, it was called Microsporon diphtheriticum, Bacillus diphtheriae and Mycobacterium diphtheriae. Current nomenclature is Corynebacterium diphtheriae.
Friedrich Loeffler was the first one to cultivate Corynebacterium diphtheriae in 1884. He used Koch’s postulates to prove association between Corynebacterium diphtheriae and Diphtheria. He also showed that the bacillus produces an exotoxin.

A diphtheria immunisation scheme in London, 1941
Joseph P. O’Dwyer introduced O’Dwyer tube for laryngeal intubation in patients with obstructed larynx in 1885. It soon replaced tracheostomy as emergency diphtheric intubation method.[19]
In 1888, Emile Roux and Alexandre Yersin showed that a substance produced by C. diphtheriae caused symptoms of diphtheria in animals.[20]
In 1890, Shibasaburo Kitasato and Emil von Behring immunized guinea pigs with heat-treated diphtheria toxin. Von Behring won the first Nobel Prize in medicine in 1901 for his work on diphtheria. Over the Christmas holiday in 1891 in Berlin, the first attempt to cure a person of diphtheria was made. It succeeded. … it was the first cure.” [21]
In 1895, Mulford Company of Philadelphia started production and testing of diphtheria antitoxin in the United States.[22] Park and Biggs described the method for producing serum from horses for use in diphtheria treatment.
In 1897, Paul Ehrlich developed a standardized unit of measure for diphtheria antitoxin. This was first ever standardization of biological product and played an important factor in future developmental work on sera and vaccines.
In 1901, thirteen St. Louis children died from contaminated diphtheria antitoxin. The horse from which the antitoxin was derived died of tetanus. This incident coupled with tetanus outbreak in Camden, New Jersey[23] played an important part in initiating federal regulation of biologic products.[24]
In 1905, Franklin Royer, from Philadelphia’s Municipal Hospital, published a paper urging timely treatment for diphtheria and adequate doses of antitoxin.[25] In the same year, Clemens Pirquet and Bela Schick described serum sickness in children receiving large quantities of horse-derived antitoxin.
[END QUOTE]
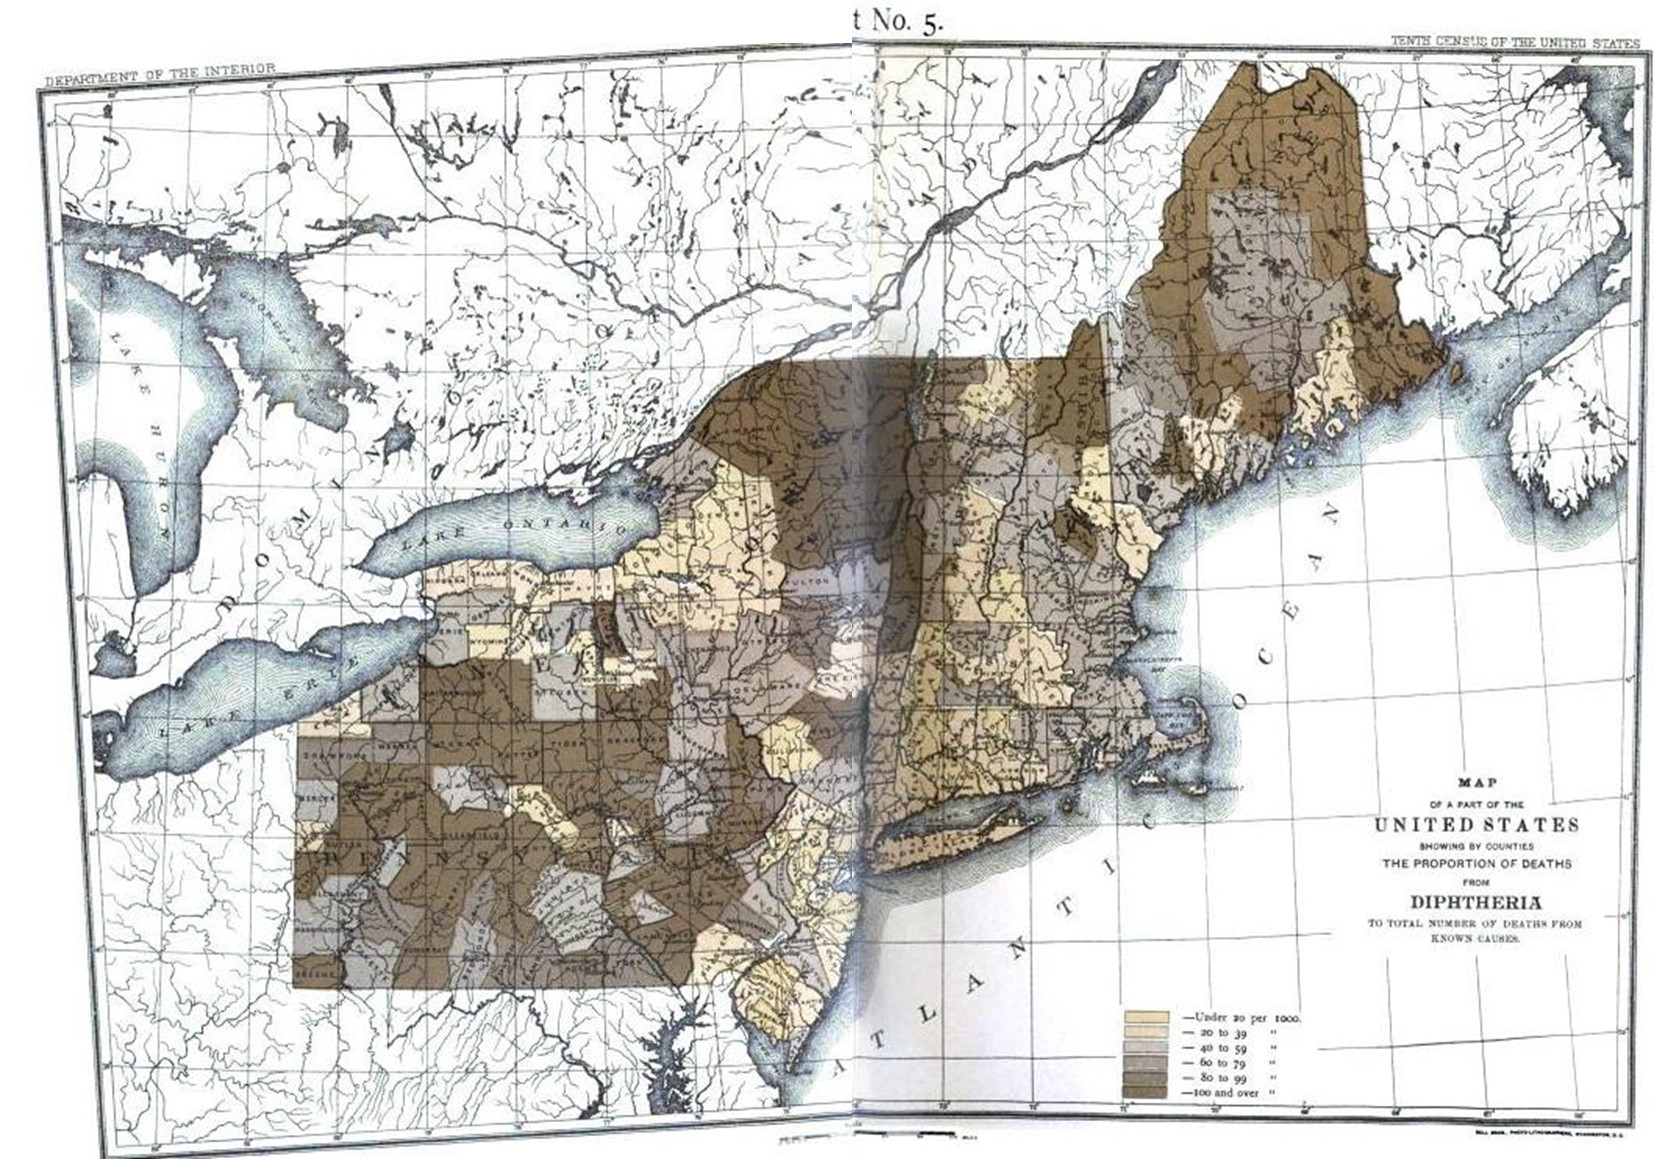
Northeast Diphtheria
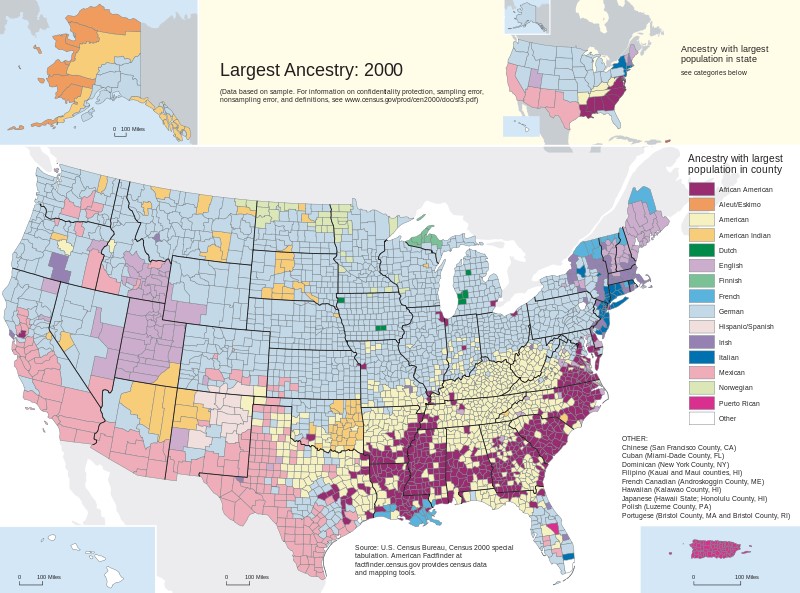
The kinds of questions we can derive from this include: ‘Where is the diphtheria greatest in NY?’
In my study of foodways and culture in New York, the 2000 and 2010 censuses showed that the region where diphtheria is thegreatest in NY is also the region with the lowest income, the lowest cash in savings region, the lowest property values, and the most self-sustaining family farms. Along the greenway belt from NYC to Lake Champlain, this same setting has some of the highest restaurant prices for a simple breakfast or lunch, involving a family restaurant meant to service people heading up to Lake George along the east side of Adirondacks. Diphtheria is most evident in poverty stricken regions, and still surfaces in the US in small clusters of cases, usually in rural settings.
There also appears to be a north end preference for many states and regions, but this may be due to time of the year and seasonal living space requirements back in 1890 for housing accomodations during cold weather periods.
.
Northern Great Plains Diphtheria
.

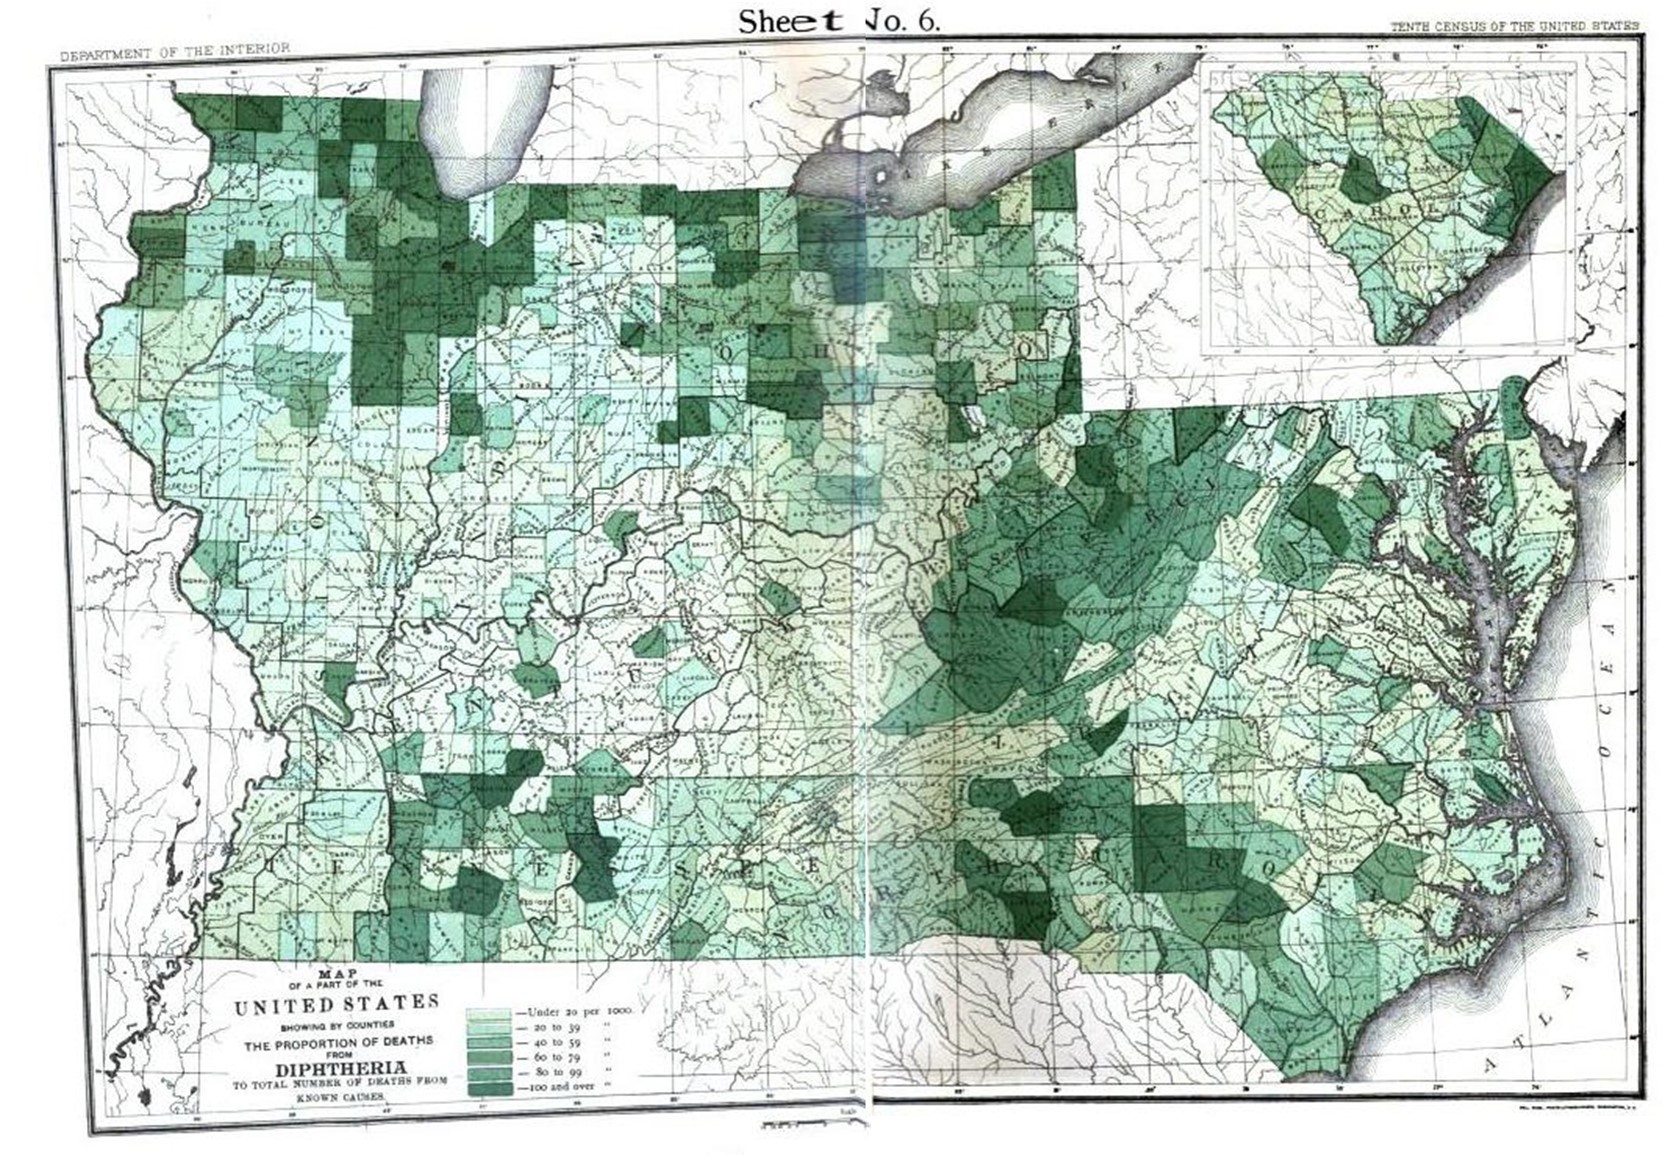
Upper Midwest Diphtheria
.
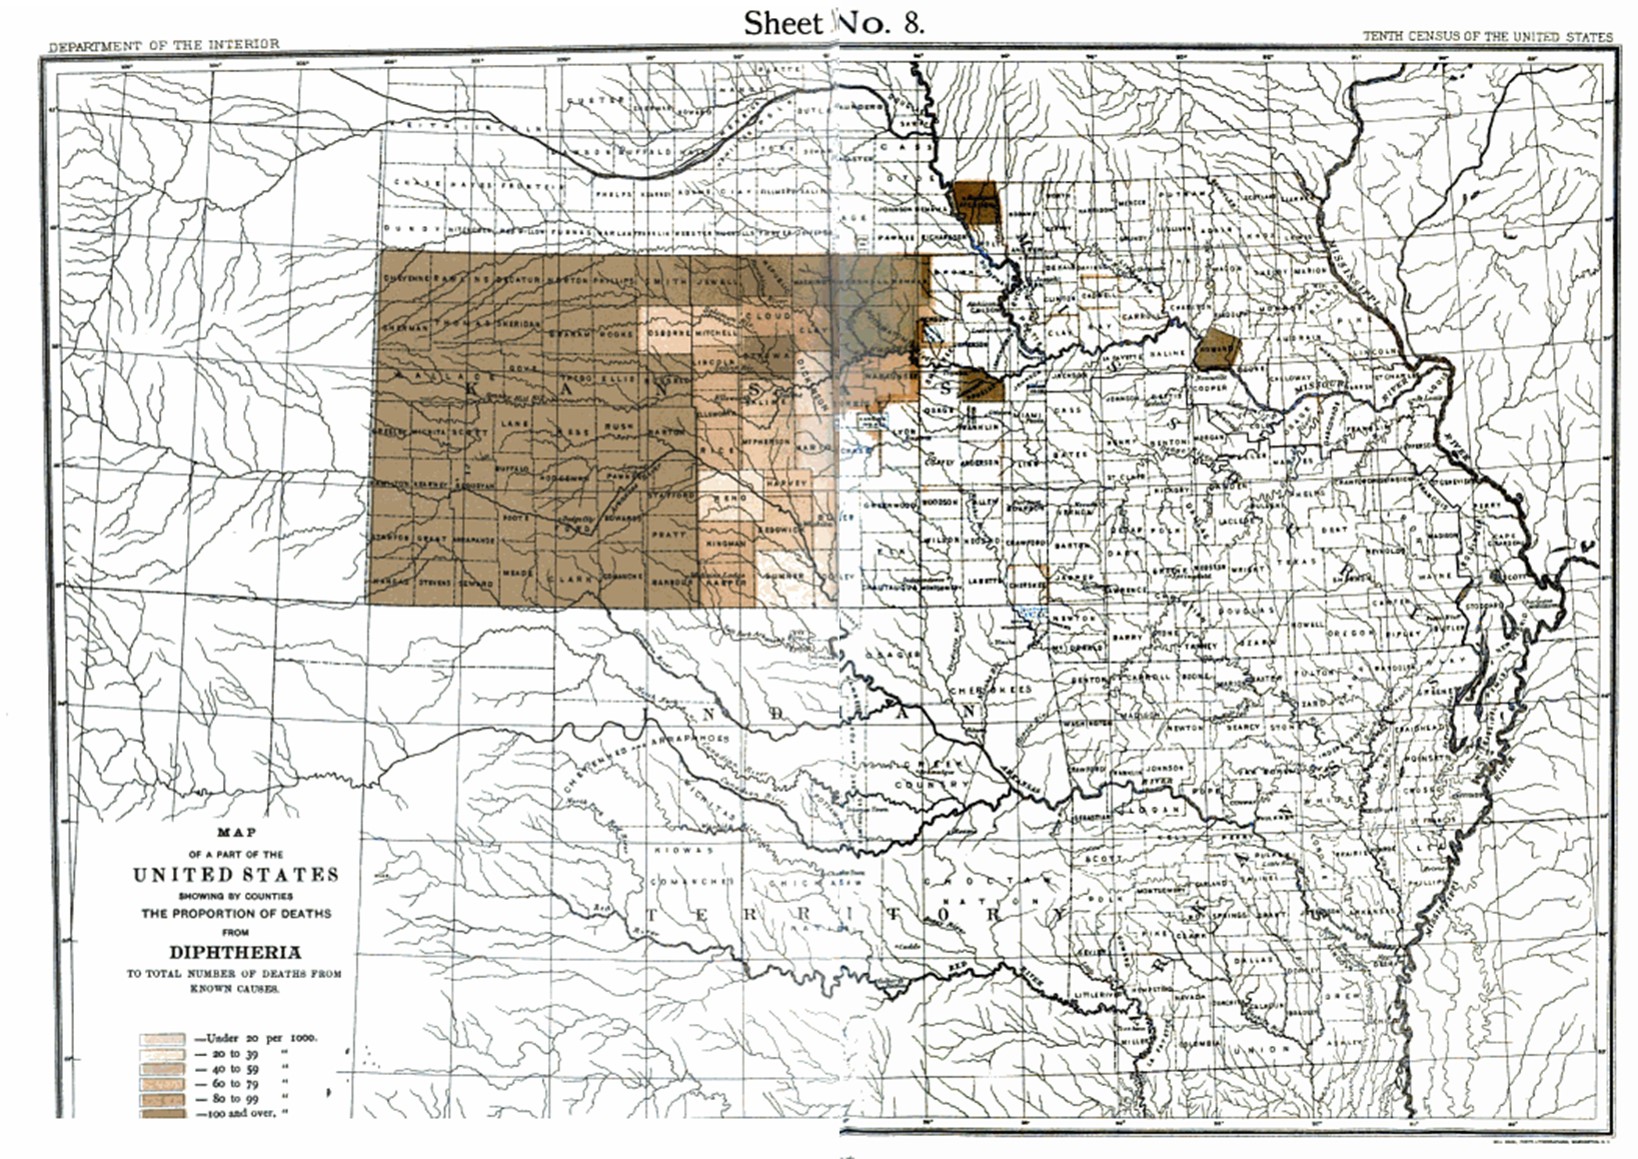
Middle Midwest Diphtheria
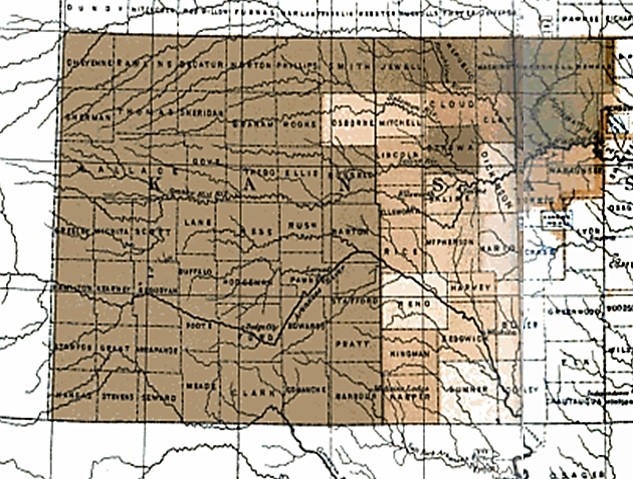
Kansas Only
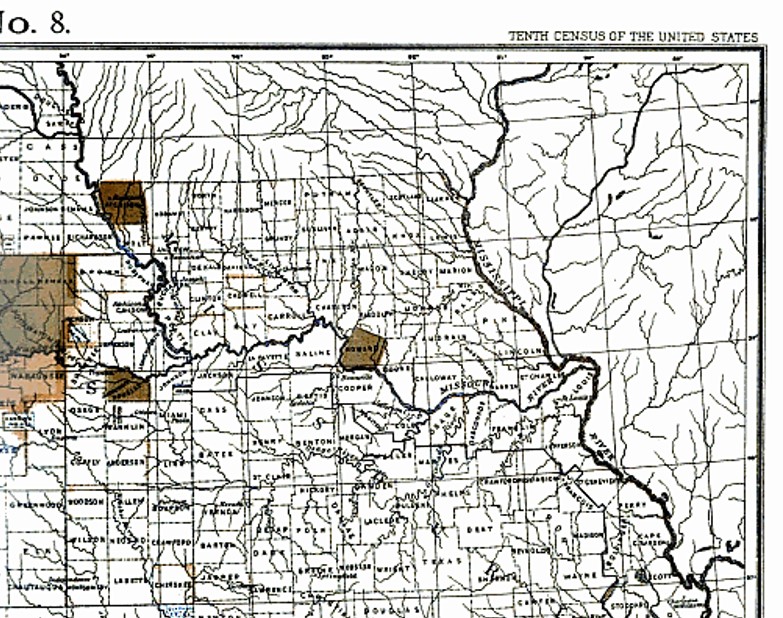
Iowa – Illinois – Kansas – Nebraska
.
US Population
.
SECTION 3 – National B/W Maps
(same source)

Hooping Cough or Pertussis (see figure below)
.

Measles

.

Tetanus and Trismus nascentium
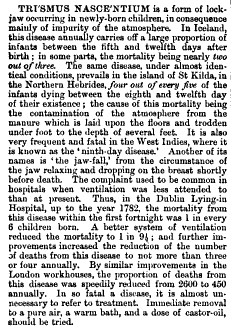
Chamber’s encyclopaedia: a dictionary of universal knowledge…, Volume 9. 1875, p.555.
.

.

Erysipelas

See Chicago Epidemic map page once it is available for more on this.
.
.
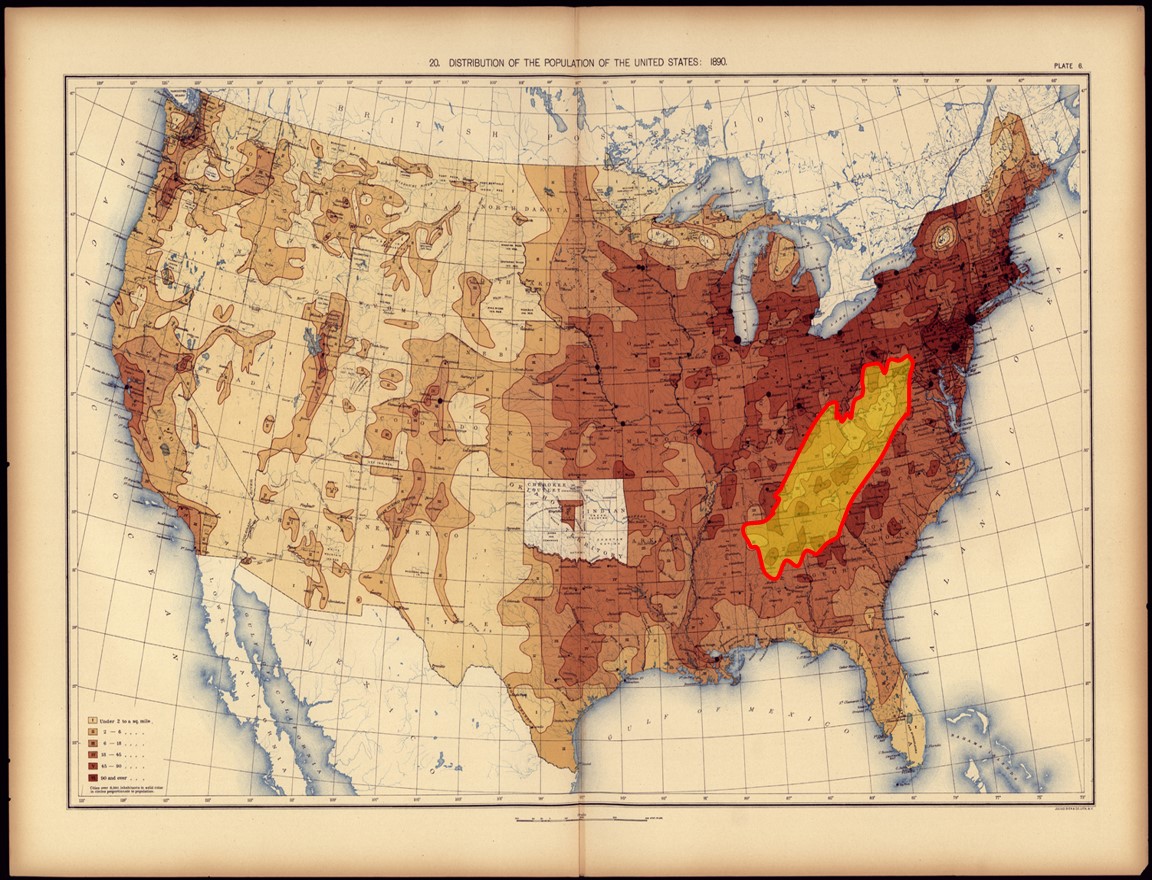
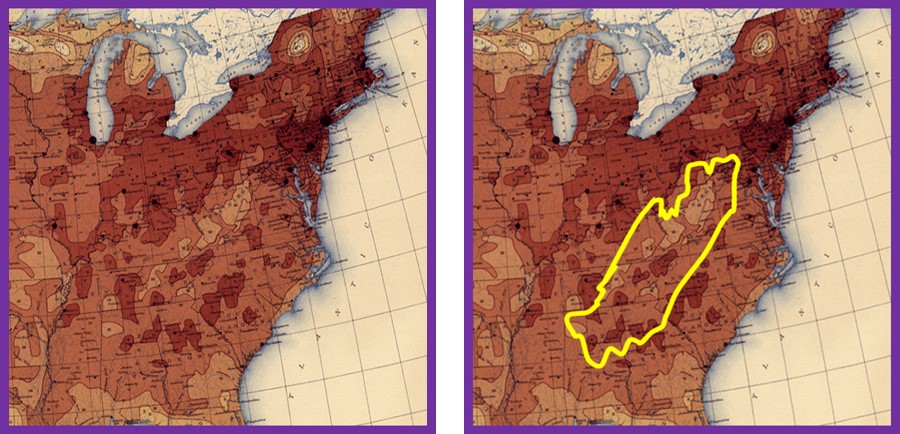
Research Area for Appalachia over 1890 Population Density Map
.

.
Topography of Research Area.
SECTION 4 — Appalachia – Evaluation and Comparison
.
When looking at these kinds of maps, you have to ask yourself:
- what major geographic features over such a large area could possibly be related to these differences?
- weather?
- climate?
- topography?
- seasonal changes?
- ecology?
- amount of water?
- average annual rainfall?
- temperature? elevation?
- length of day?
- type of industries most likely in these different settings?
- etc.
.
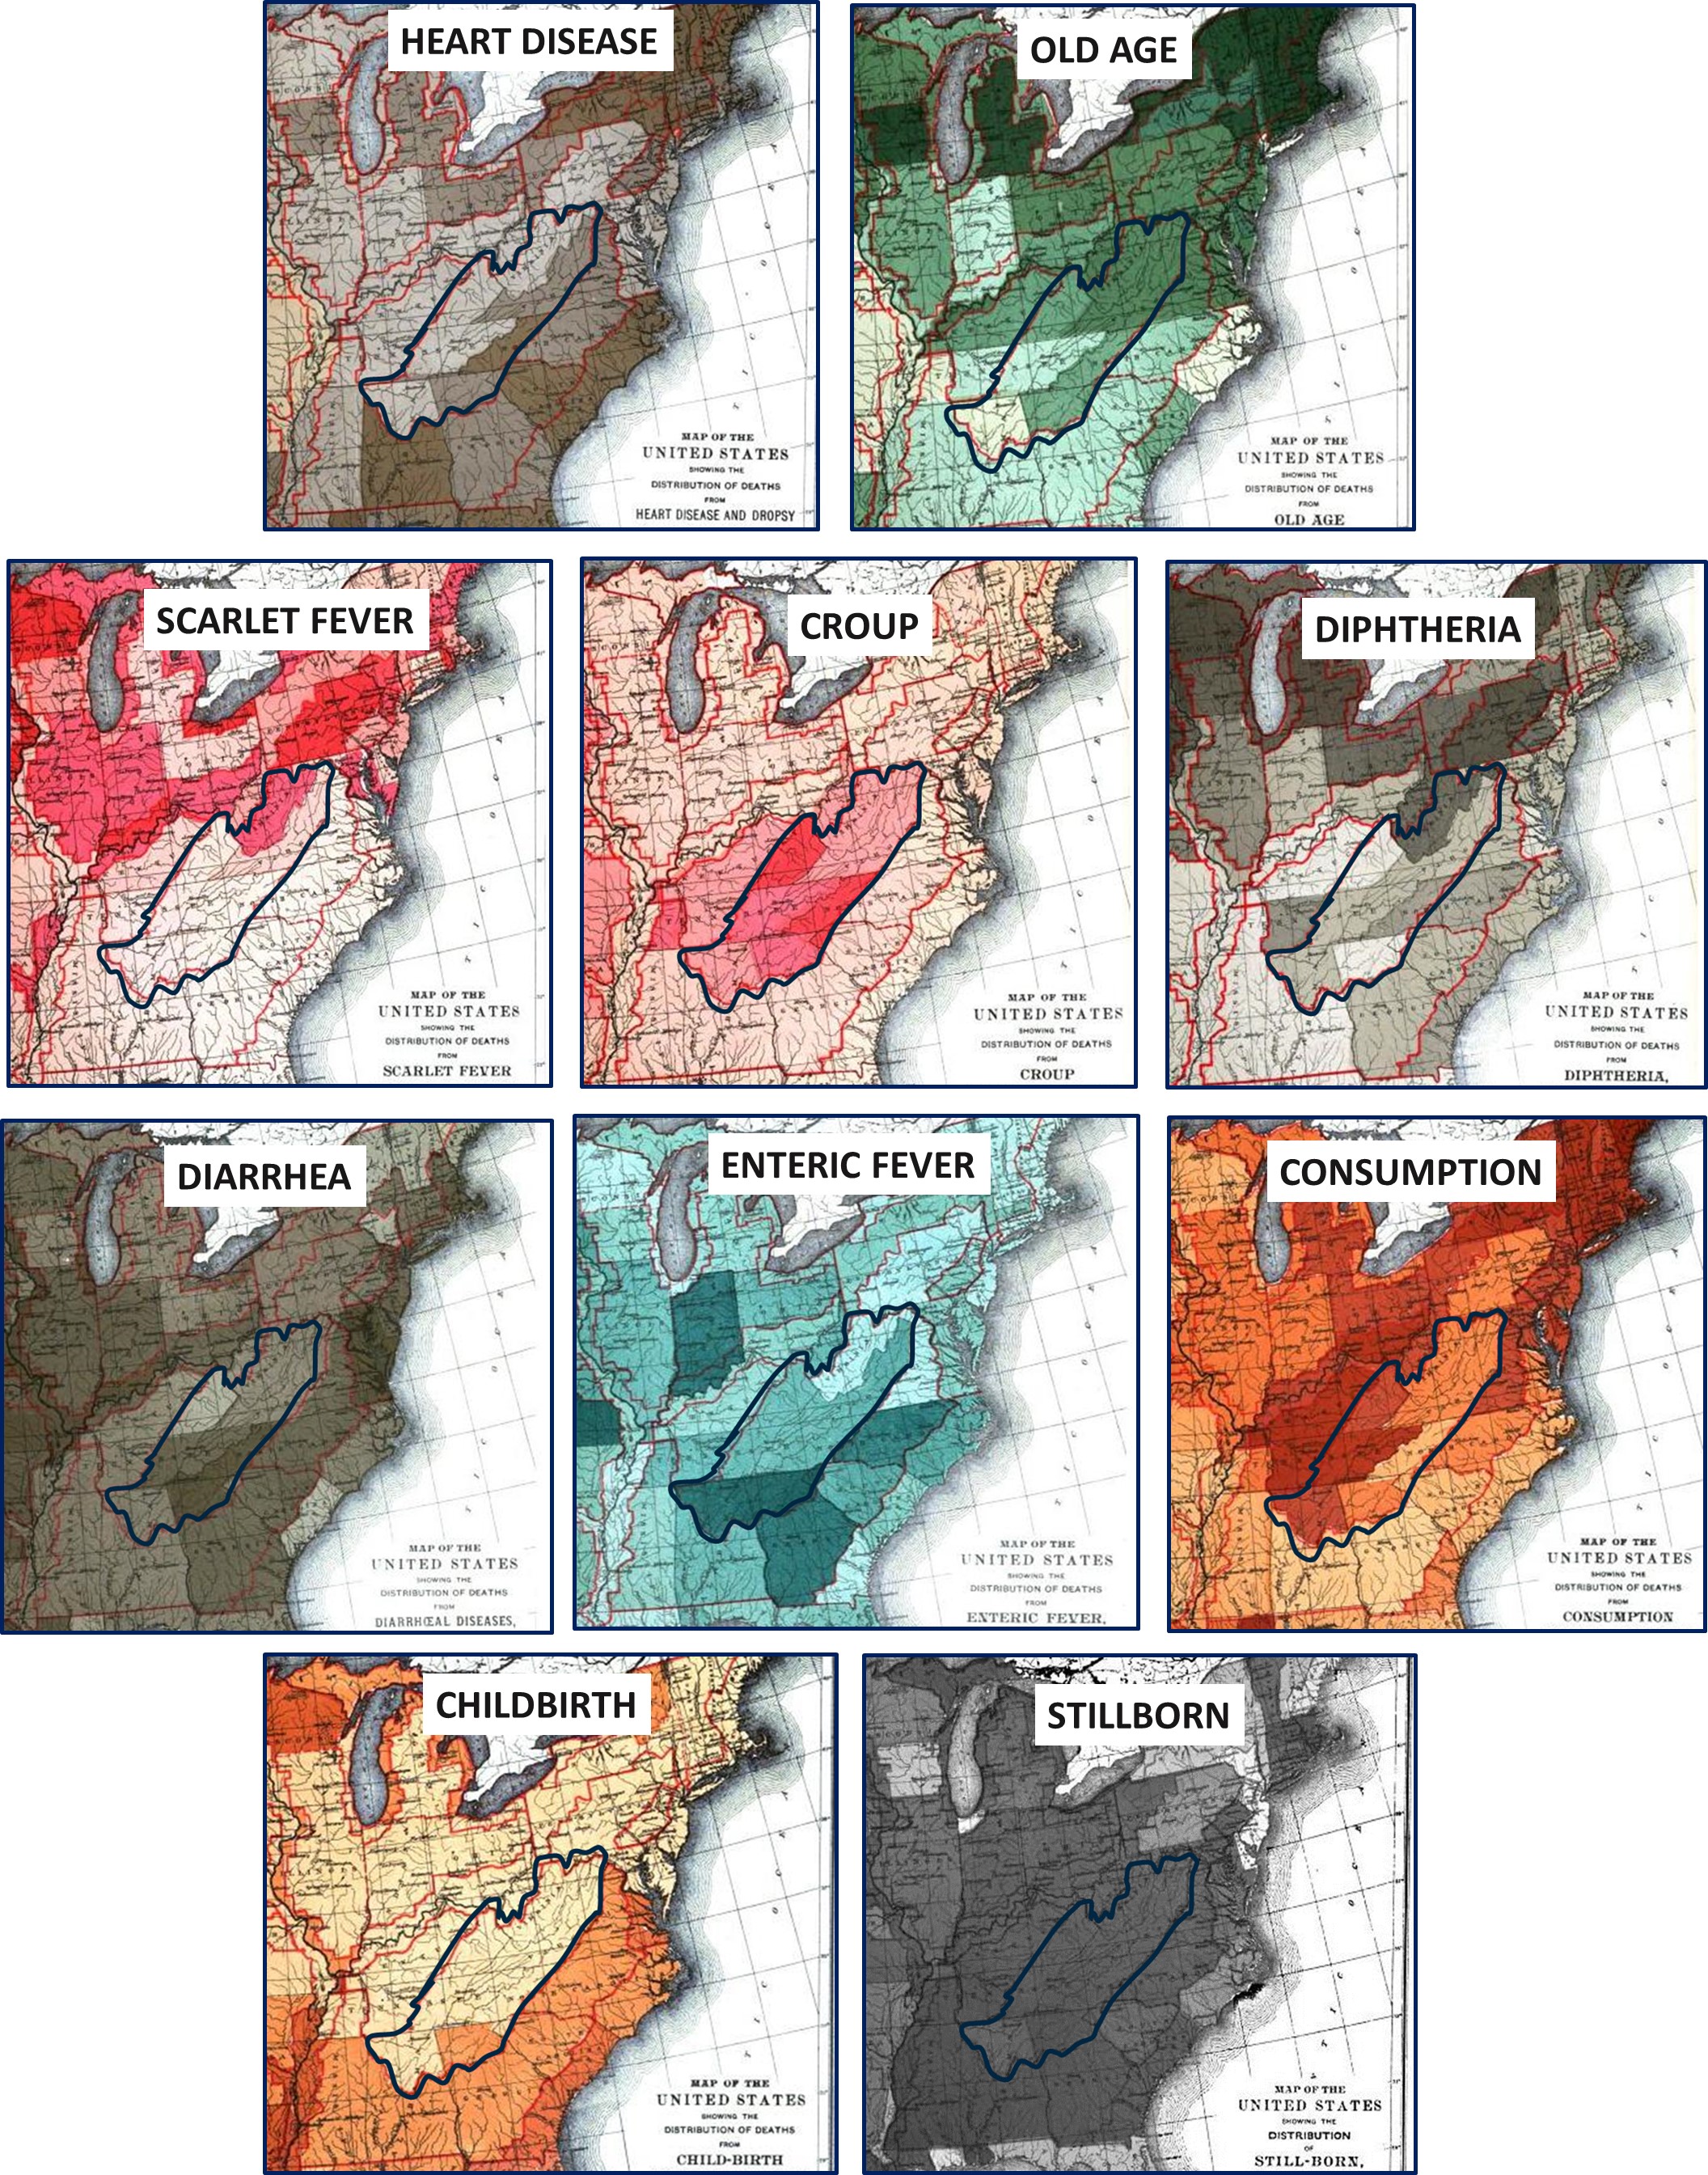
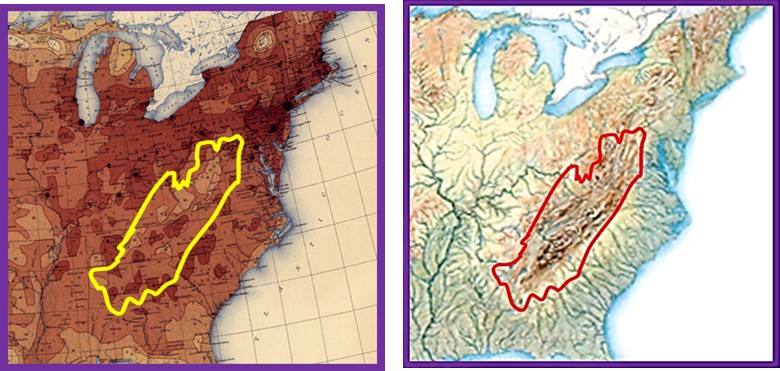
Disease/Medical Colored Maps from 1890 Census
.
Railroads, Population Density and Topography
.
Large Area Geography
The polygons drawn on the above maps depict the research area for this particular set of queries.
This particular region has a very distinct geology, which in theory is responsible for a set of well defined diseases common to the region–coal mines, coal mining businesses and coal miner’s lung and its similar.
This may even influence one or more of the disease statistics mapped based on the 1809 census data.
.
In the brief review of my thesis at this site, I provide a lengthy listing of the various physiographic and climatic features that can be mapped in relation to disease. I also recently posted the thesis as a standalone, in chapters, including an early version of my review of medical geography in detail (there are many more references and a more classical physiographic rendering of this concept in the other essay–LINK, and click on Pre-Thesis section . . . Chapter 3).
The following large area geographic features are reviewed for this page using the above large area spatial distribution maps and maps that follow:
- latitude
- aspect
- crowding
- farming
.
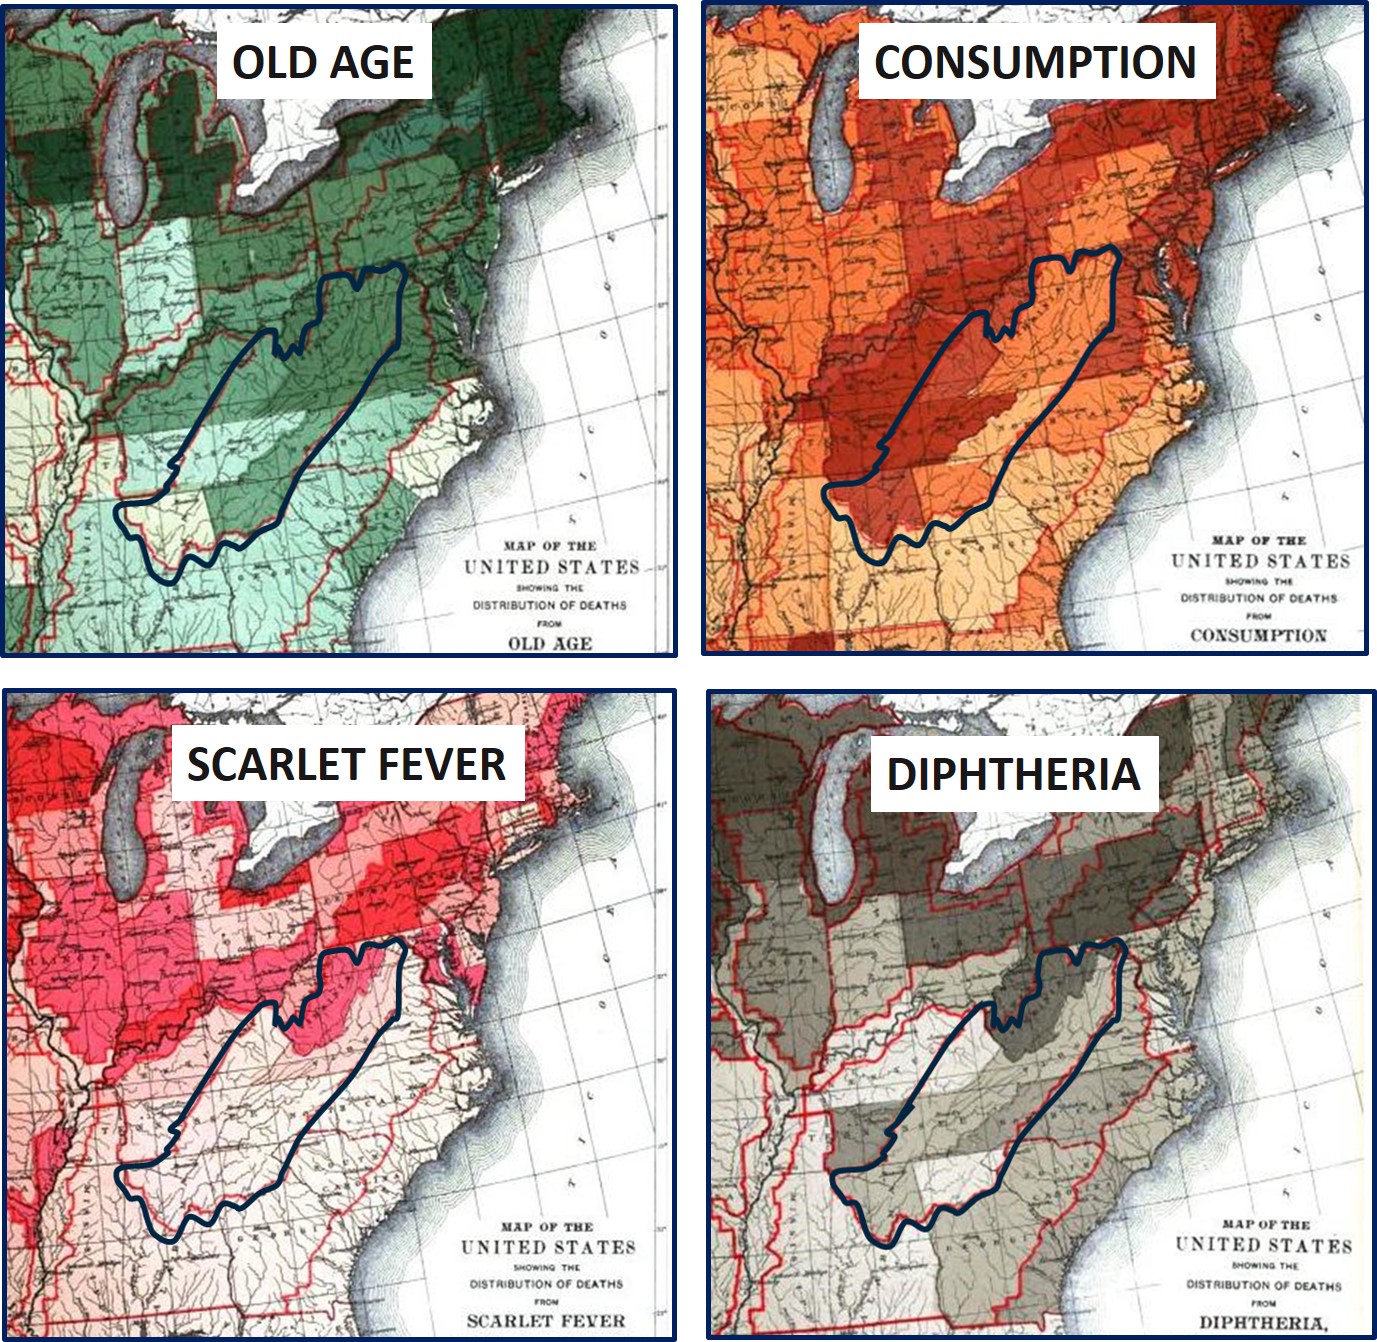
Latitude — Throughout the nineteenth century doctors were certain that latitude had much to do with avoiding diseases or recovering from them. Since 1800, physicians taken ill due to residing in a new place at too cold a latitude tended to move towards the south, where the weather was warmer and the daily fluctuations in temperature not so conducive to fatigue onset, weakness and fatigue, onset of mental chorea, melancholy, lower vitality and ultimately illness.
In the above maps, scarlet fever, diphtheria, consumption and old age do show a tendency to be more prevalent to the north. The old age we can sign off to social and cultural living habits and sociological behaviors. The clustering of old age percentages at the high value up north suggests you live longer if you live up north, than down south once you get older. Consumption has been the traditional disease linked to upper latitude regions where cold winter weather prevails. Scarlet fever and diphtheria could be assigned some ecological component to this finding, were it not for their ability to spread as contagion being passed from person to person. Colder weather and the force cohabitation for longer periods of time per day make for a very easy situation for this disease to be spread by way of domestic settings. Other diseases for the time such as catarrh and the influenza behaved much the same way when it comes to seasonal events.

Railroads, population density, topography
.
Consumption
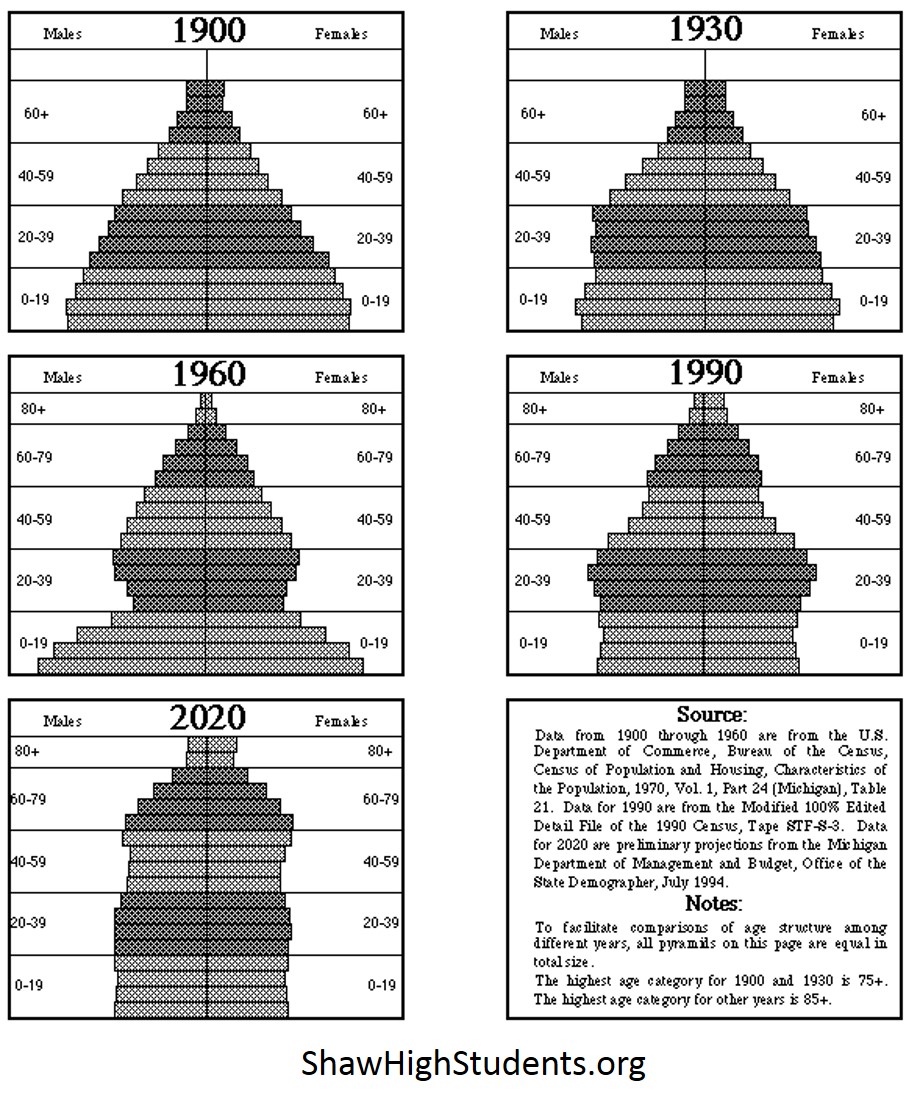
The last of the above three maps is on Consumption, also called Phthisis and Tuberculosis. This disease historically had associations with climate, weather and latitudes. It was considered a prevailing disease of many regions and the colder end of the temperate zone. There were several variations on how it presented, resulting in other disease names that were of the same origin. The classic example of this was scrophula, a disease manifested across parts of the neck, upper torso and face. Consumption is due to mycobacterium (fungal). The population pyramid provided by the 1890 census provides us with valuable insights into the disease and how it took its victims, usually in their 20s to late 30s, with women slightly more than men during those years in age. When reviewing the map of consumption, the following might help with answering the questions that follow.
A historical map review of this disease will be done on another page.

Types of questions to consider:
- What is the age of highest percent or number of deaths due to Tb?
- Why women so much more than men for the 15-35 yo age groups?
- Why the lower number of deaths in women than men in the 55-60 yo age band?
- At what two ages in the adult years do men and women even out in terms of deaths?
- Why are children <2 yo at a higher rate for death from Tb that children 3-4 years of age? (how dis they catch it?)
.
When reviewing the maps that follow, the major points to consider are aspect, crowding and farming.
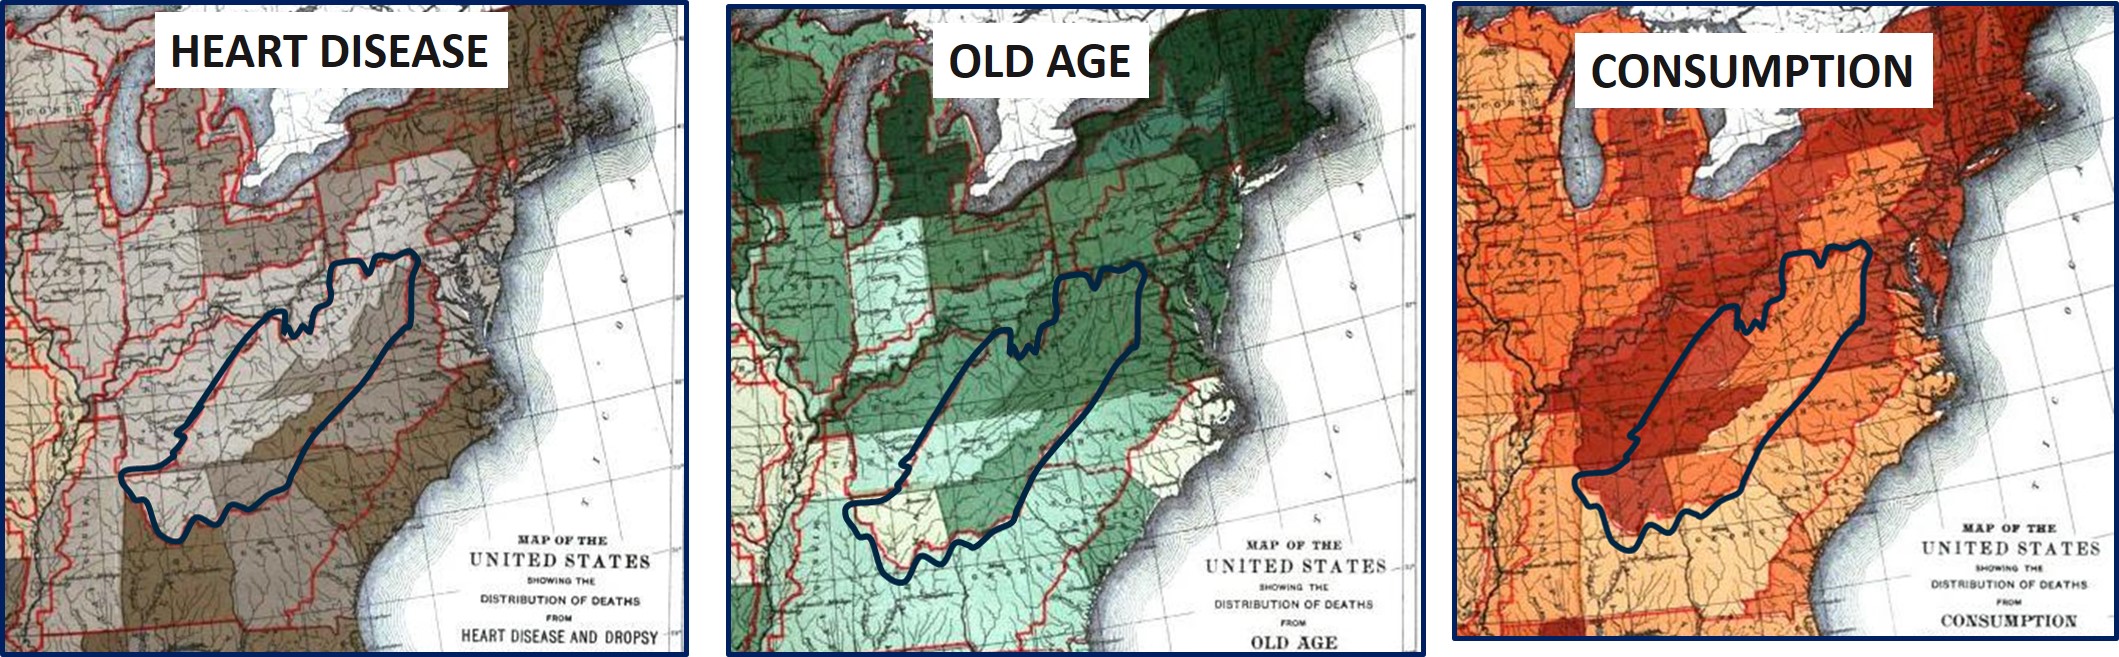
Aspect — Aspect is a relative measure of the angle of the surface in association with the amount of sun that strikes that part of the earth’s surface. One old adage serves as an reminder for this: The north side of the tree for example gets the least sun per year and thus develops moss.
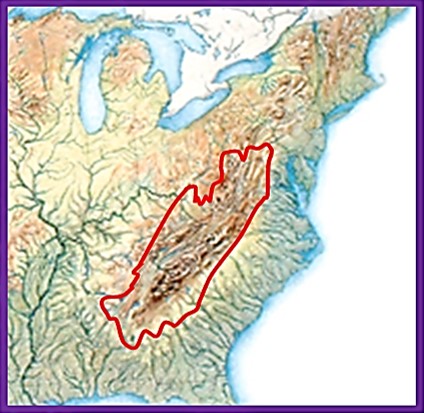
Research area = the low income communities of Appalachia
Upon first inspection of the above maps, we might think that heart disease, old age and consumption demonstrate potential aspect relationships, meaning one side of the mountains is influenced more or less than the other all along the entire mountain range. If we extend the mountain range through Pennsylvania to encompass the Allegheny plateau as well, followed by the Adirondack region, we can continue this argument.
We see this aspect difference continue, with its best fit noted for consumption.
The center of this research area noted on the maps above are the higher elevation areas on the eastern face, thus reducing consumption due to the reduced viability of mycobacterium in high elevation settings.
An alternative query into this might also lead a physician to ponder if there is a great likelihood of consumption striking families when they are living on the west face versus east due to solar ray impacts late in the day.
This dichotomy of possible outcomes demonstrates the ecological error (seeing two things associated with each other, even they there is no relationship) that can set in at times with the use of broad area analysis spatially in this manner. The other way to look at the consumption map is to propose that the Ohio River valley and valleys of other rivers are at this mountain base on the west side, and due to impacts on temperature and humidity make consumption more prevalent west of the Appalachians, in areas less inhabited than the east coast where this condition is most often seen and recorded along the northern half of the Atlantic shoreline.
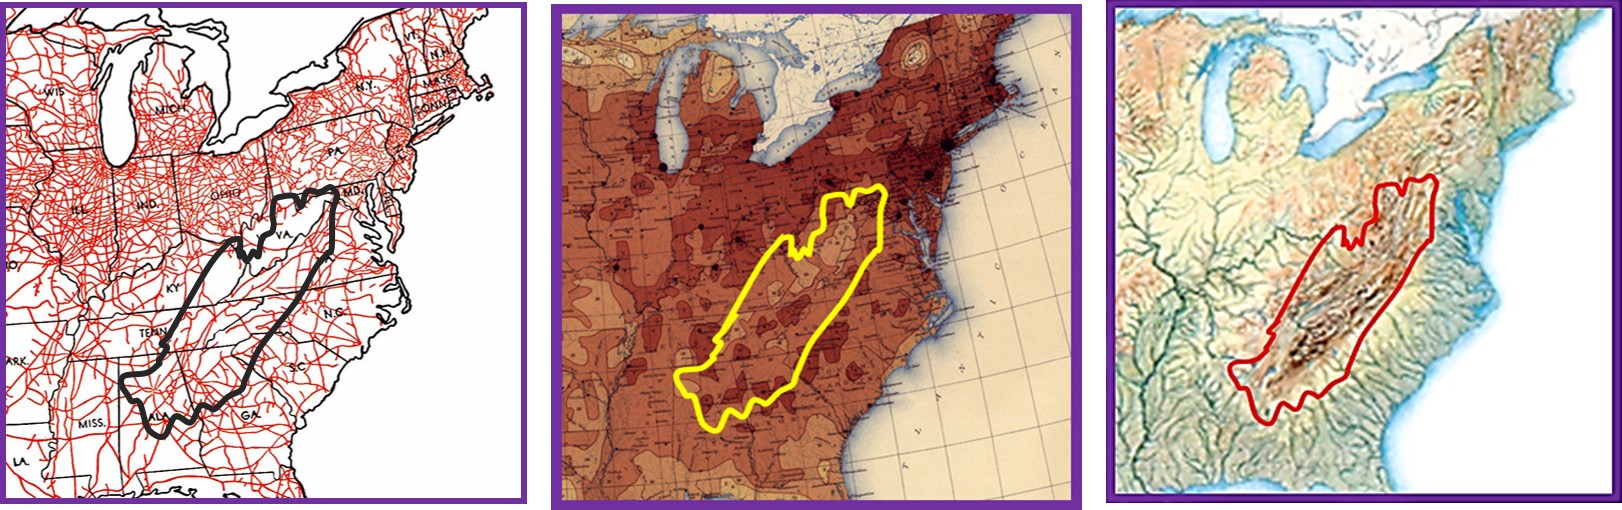
Railroads, Population, Topography
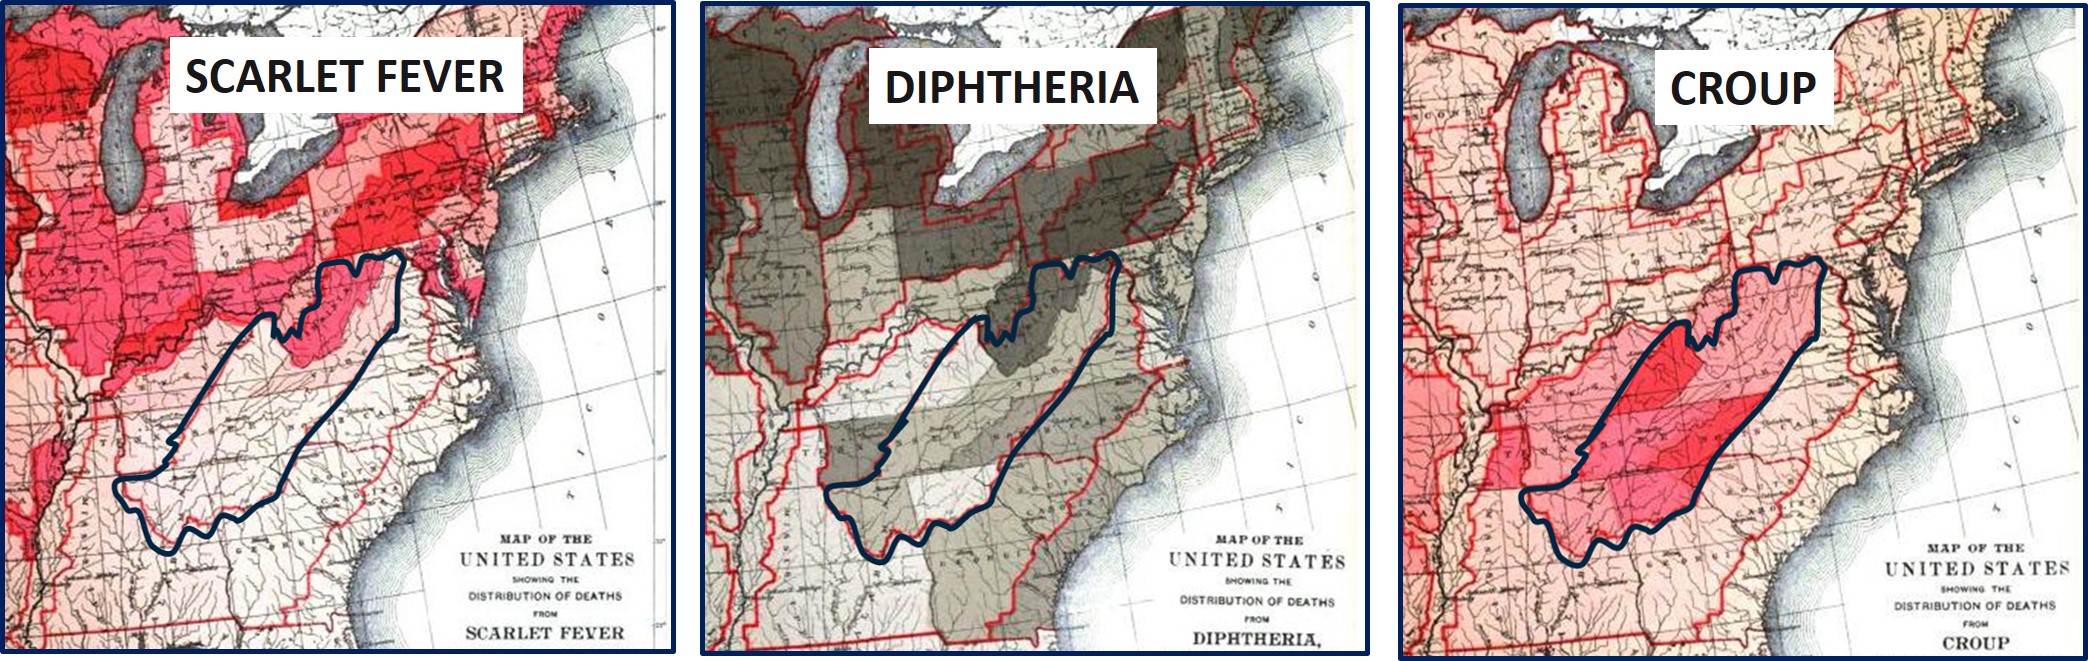
Crowding — Scarlet Fever and Diphtheria contrast with croup (above maps). Croup seems to be more likely to occur in high elevation montane living settings. The year of this census is 1890, a time when diphtheria and scarlet fever had their treatment modalities and prevention programs well documents. The same documentation for croup of whooping cough was lacking. Immunization dates help shed some light on this geographic difference in the diseases for 1890. Once again, wintertime made it very easy for croup or whooping cough to be spread from one individual to the next. This problem might have worsened at the higher elevations due to cooler temperatures. Croup shows an isotherm related difference only at the elevation level however; the isolines for any annual temperature metric tend to traverse the US laterally, implying a possible north south difference is possible. Such is not seen with croup. Because this montane area shows a difference on its east and west faces, this appears to support the elevation relationship with croup, even if the shared beds and living space ends up being an ecological fallacy for this spatial relationship.

Farming — The human ecology of enteric fever during the 19th century indicated it is primarily related to dairy industries at first. The cause for enteric fever is contaminated milk. Five high event areas are noted, and thus these five are must have a dairy-related history attached to this phenomenon.
Dichotomies
Finally, there are some dichotomies between regions that are interesting. Some events seem to share similar behaviors across the country for the most part. The above examples demonstrated some east versus west and north versus south differences, which could be linked to anything from latitude-defined climate patterns to topography-aspect defined weather and human behavior patterns. Occupations tended to related to enteric fever, with diarrhea not showing such a small area specific behavior.
One dichotomy worth mentioning is the comparison between croup and heart disease. Each afflicts a very different age set of patients, in very different ways, for very different reasons. The heart disease does go along with old age pretty much, with old age demonstrating more of a latitude feature than heart disease. Both heart disease and old age have that east coast versus interior valley difference, a result of demographic and place of residency choice differences. Croup stands alone from the rest in that it is highest on both sides of the appalachian low income regions.
In the following pair of maps we see minimal regional differences across the research area, and in general, not much of a difference between neighboring places no where we go for stillborns. Only the lower New York and New Jersey, Delaware areas seem to be fairly well managed with still borns. Childbirths demonstrate and south-north difference in general, a finding that still exists to this day according to my national population health grid mapping project. The peak northwest to westnorthwest of the Great Lakes is also consistent with population grid findings. These are regions where child care back then, as with now, are still a relatively higher needs, higher costs group for this country in general.

.
.
.
.

.
.

July 31, 2017 at 11:53 pm
I live in south MS in a town called McComb. near were I live there is an old cemertary forgotten about its been that way since I was a child. It has always bothered me that my County ,Pike County will not do any thing for it. It has grower up and graves have sank. There still are few noticeable head stones left that can be read but most are sinking in the ground never to be seen again and others have mass growth on them. They are just simple head stones with names on some and just dates on others. It sadens me because most of them are just children some never reaching one year of age and other not much older. I really would love to find family or kin of these poor forgotten souls. The dates on them rang from 1889 to 18991
August 1, 2017 at 12:21 am
Hi admin, i must say you have very interesting content here.
Your page should go viral. You need initial traffic only.
How to get it? Search for; Mertiso’s tips go viral