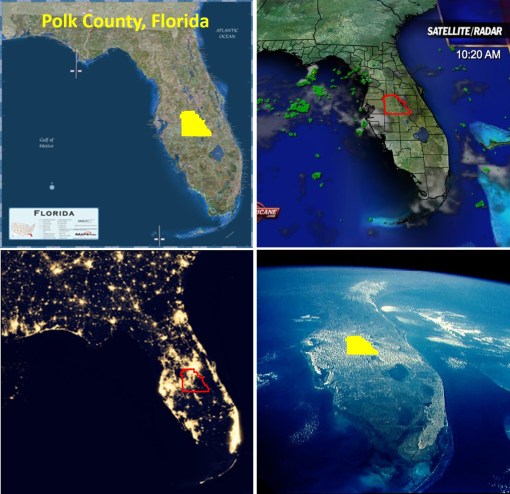
This set of maps can be reviewed in detail at
http://www.pinterest.com/pin/568790627911639938/
The Geography of Ebola, goes one step beyond the environmental ecological concept of Ebola patterns. Past geographers had a unique way of evaluating disease long before the microbial (pre-bacterial) theory became popular in the mid-1870s. Using some of these older methods of spatially reviewing disease behaviors, we discover some important insights worth pursuing as spatial epidemiologists. Amongst these are spatial theories linked to density, diffusion processes and the natural history of disease over time as natural endemic or epidemic disease processes.
By 1800, the latitude theory for disease was already well established. This identified certain regions close to the equator and hot, humid climates as most conducive to bad health (see https://brianaltonenmph.com/gis/historical-medical-geography/1814-the-latitude-of-pestilence/ ). Matching the latitude theory was the longitude theory, which had its support as well in the form of diseases that remained in the Americas and failed to infect Europe, at least in the initial years. The prime example of this was yellow fever during its first decade or two of infecting North American coastal cities (this are on the map is from Alexander Keith Johnston’s map, which I review extensively at https://brianaltonenmph.com/gis/historical-disease-maps/alexander-keith-johnston-health-disease/ ). Race and place of origin have also been linked to sickness, based on the argument of certain kinds of people being more “adapted” to specific settings. The belief that climate and weather were related to diseases was as old as the study of medicine itself. Adding to these early hypotheses by the mid-1800s were the ecological and natural history theories, based upon topography, soil, water, and unique features like slope and aspect (angle relative to the sun, for example for a mountain face).
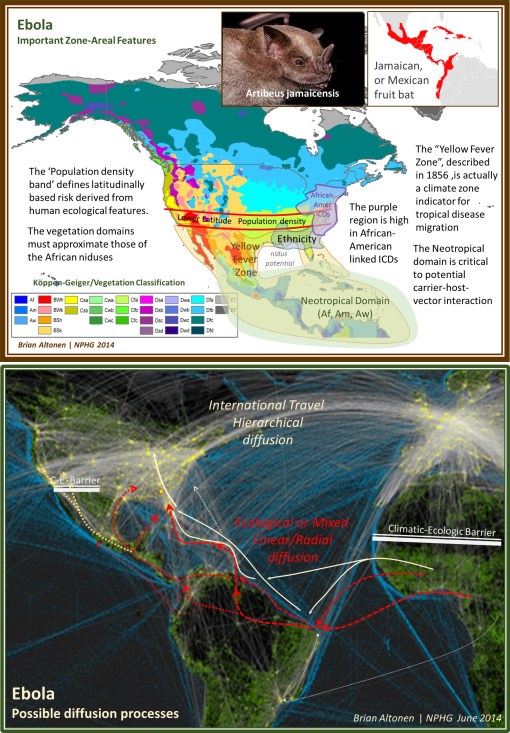
20th century renderings of climate, weather, vegetation zones, and an areal feature known as the Köppen-Geiger climate classification system has become important in understanding global ecology. [for an original map see http://www.ie.unimelb.edu.au/research/water/hydroclimatology.html ]. Understanding global ecology is important to understanding the geography of Ebola. Ebola is specific to certain Köppen-Geiger regions ‘Af’, ‘Am’ and ‘Aw’ in Africa, and therefore similar regions in other parts of the work are more like to support the natural migration of this disease elsewhere. The Amazon Basin is the only part of the Americas that match the equatorial tropical rainforest region in African where Ebola erupted from. In the above map illustrated I have termed this the U.S.-Middle America Neotropical region. These region in both South America and Africa very much mimic the “Torrid Regions” defined around 1800 by famous geographer Alexander Humboldt. [See
http://libweb5.princeton.edu/visual_materials/maps/websites/thematic-maps/quantitative/meteorology/meteorology.html ].
The African bats linked to Ebola are fruit-eaters (frugivores). This differentiates them from nearly all North American bats which are insectivores. In Middle America, are a variety of nectar-feeding and fruit-feeding bats, in particular that Jamaican fruit bat (Artibeus jamaicensis), of which at least four varieties occupy the Caribbean environments (see insets in upper map above, and
http://en.wikipedia.org/wiki/Jamaican_fruit_bat ). Thus the link between the African diffusion process and the American diffusion process are these fruit bats, for the time being.
The barriers to Ebola diffusion in nature are the non-tropical forest, very dry and arid climatic regions along most of the western U.S. Mexican border. This barrier mimics the barrier the Sahara is to natural northward migration of Ebola. Thus only the entry though the San Antonio, Texas area appears to have feasible climate, topography and environmental settings required for such a host or carrier to follow nature and carry the disease northward to the more heavily populated latitudes.
The Neotropical shorelines of this region extend eastward towards Florida, which due to their combined climate and floral features could support the frugivore bats, but an even more adventitious route for the travel of Ebola from Brazil to the U.S. is via the Caribbean. This route was favored by yellow fever, Asiatic cholera, malaria, dengue, and most recently Chikungunya.
The transportation map at the bottom shows two types of disease diffusion routes–the natural ecology routes (linear, radial, mixed or non-hierarchical, red and orange) and the human driven hierarchical transportation based routes (white to cream). The above maps focus on the natural history of this part of the globe relative to the disease ecology for Ebola. It is just as possible for human transportation to be the primary means this disease attempts to strike the U.S. (white to cream colored routes).
Meanwhile, the natural history derived routes, for an in-migrating disease like Ebola, which I placed on the second map (in red and yellow), are for the most part speculative, but stand as useful and testable prediction models.
Readings and more related to the above:
Global Disease Detection Center. [CDC set up these facilities to monitor, perhaps suppress diffusion.] Info and a map detailing their locations (in Guatemela, as of 2006) is at
http://www.cdc.gov/globalhealth/gdder/gdd/regionalcenters.htm
Hierarchical Diffusion modeling, my review at: https://brianaltonenmph.com/gis/historical-disease-maps/john-c-peters-and-the-asiatic-cholera/1960-pyles-cholera-diffusion-and-migration-patterns/
and a contemporary application of it: http://onlinelibrary.wiley.com/doi/10.1002/sim.844/abstract
Studies and news quips about Ebola and other bat-carried diseases:
http://www.infectionlandscapes.org/2012/11/ebola-hemorrhagic-fever.html
http://www.infectionlandscapes.org/2012/12/marburg-hemorrhagic-fever.html
Pierre Rouquet, Jean-Marc Froment, Magdalena Bermejo, AnnelisaKilbourne, William Karesh,Patricia Reed,Brice Kumulungui, Philippe Yaba, André Délicat, Pierre E. Rollin, and Eric M. Leroy. (2005). Wild Animal Mortality Monitoring and Human Ebola Outbreaks, Gabon and Republic of Congo, 2001–2003. 11(2), serial on the internet, available at http://wwwnc.cdc.gov/eid/article/11/2/04-0533, or
http://wwwnc.cdc.gov/eid/article/11/2/04-0533_article.htm
Ivan V. Kuzmin, Brooke Bozick, Sarah A. Guagliardo, Rebekah Kunkel, Joshua R. Shak, Suxiang Tong and Charles E. Rupprecht. (2011). Bats, emerging infectious diseases, and the rabies paradigm revisited. Emerging Health Threats Journal 4, incl Supplements. At:
http://www.eht-journal.net/index.php/ehtj/article/view/7159/8775
Jorge Ortega and Iva´n Castro-Arellano. (2001). Artibeus jamaicensis. Mammalian Species, 662, 1–9. At http://www.science.smith.edu/departments/Biology/VHAYSSEN/msi/pdf/662_Artibeus_jamaicensis.pdf
Alfonso Valiente-Banueta, María Del Coro Arizmendia, Alberto Rojas-Martíneza, & Laura Domínguez-Cansecoa. (1996). Ecological relationships between columnar cacti and nectar-feeding bats in Mexico. Journal of Tropical Ecology, 12(1), 103-119. doi:http://dx.doi.org/10.1017/S0266467400009330 [Note: nectar feeders, Mexico species, not demonstrated to be a potential carrier as of yet.]
And
Yale Edu. 15 OCT 2009 REPORT: The Spread of New Diseases:
The Climate Connection. At
http://e360.yale.edu/feature/the_spread_of_new_diseases_the_climate_connection/2199/
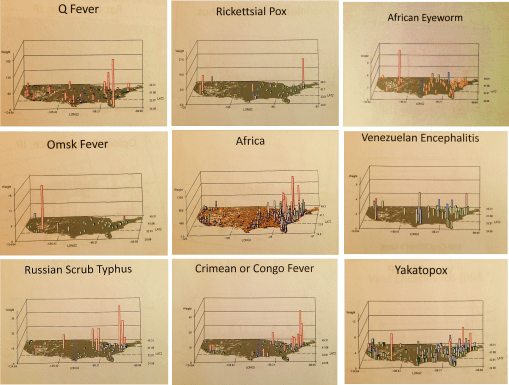
The African ICDs work is from NPHG modeling of ICDs. I describe my process for this at
Defining and Stratifying Risk based upon ICD-Culture Relationships
The following also relate:
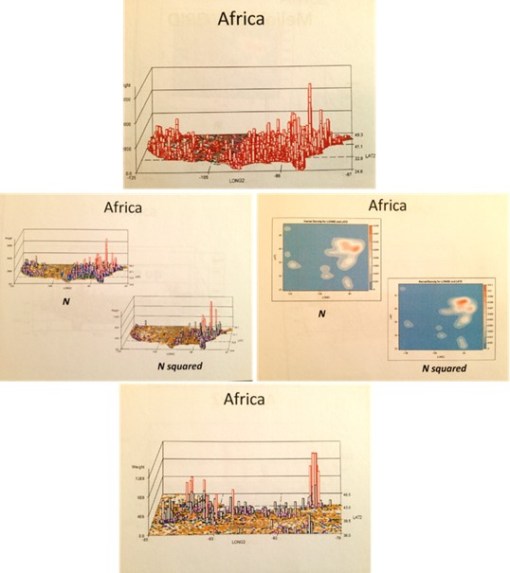
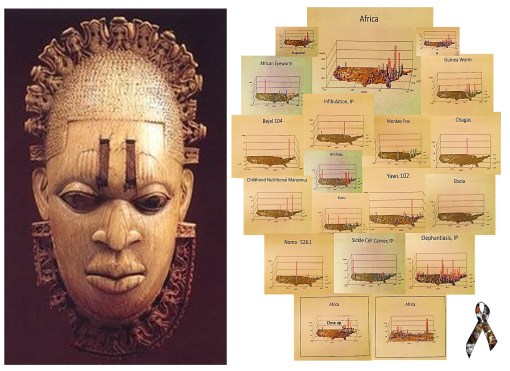
The blue maps are SAS produced krigged data maps. In other words they are very accurate. One has to image the US figure drawn on them, however, for some of the versions I produced.
The two maps are at http://www.pinterest.com/pin/568790627911639938/.