“. . . nature’s laws are causal; they reveal themselves by comparison and difference, and they operate at every multivariate space/time point.”
Edward Tufte
“Great spirits have always encountered violent opposition from mediocrity.”
Albert Einstein, 1940
All truth passes through three stages. First, it is ridiculed. Second, it is violently opposed. Third, it is accepted as being self-evident.
Arthur Schopenhauer

Note: As of May 2013, I have a sister site for the national population health grid mapping project. Though not as detailed as these pages, it is standalone that reads a lot easier and is easier to navigate. LINK
Preface
When you are ahead of the masses, persistence pays off. I was recently given the task of determining how to improve upon a methodology that was essentially failing. The problem with this methodology was that the individuals who wrote the programming for it merged two concepts together. One was the simple descriptive analyses normally engaged in for large amounts of data. The second was to take the numbers that exist and use them to determine whether or not a statistically significant change is taking place.
The first task is of course very traditional and easy to accomplish. The second task however makes use of information from the first task in such a way so as to prove whether or not certain results have occured that which we cannot assign some meaning to.
These two steps in the analyses are not meant to be applied together. This process is kind of like asking a research institute to define the causes for automobile accidents based on the standard classifcation system out there for automobiles. This description of the automobiles takes into account the autobody’s general color, the size of the engine, the number of pistons, its mileage, its age, the part of the country it exists in, how many wheels are on the vehicle (4 or 6), how much of the car is standard old fashioned technology and how much is new computer technology, and the most recent miles per gallon performance this vehicle had. In the end, you wind up with several hundred to even a thousand different automobile classes or types with these various special features, and then you are asked which car types are most likely to cause the next significant accident type. You are told it doesn’t matter who is driving that vehicle, his or her age, or driving history, or personality and skill set. You are told it is only the car that determines the outcomes to be reported.
This is how illness is reported in certain kinds of programs, based on superficial features and basic data, not the relationships that exist within this data at a very microscopic, small group based level.

Distribution of Immunization Refusals for Children by parents, within the first 6 years of the child’s life
depicting infectious disease events in children, for diseases normally immunized against by 5 years of age
There is this great methodology out there for analyzing the administrative and systems performance skills related to health care. There is this standard set of measurements made of sick people and their general sickness level and how a hospital or health care facility deals with these patients. Patients with various types of illnesses are lumped together and assumed to have the same kind of treatments, and the nature of those treatments then get tested for certain features. In the end, all you know is that people with a particular medical problem, say for example fractures, have a tendency to experience certain good and bad outcomes. You never know what fracture type is responsible for the worst outcomes and greatest cost differences noted to exist. You just know that whatever part of the health care system deals with fractures is also relates to these costly outcomes. These outcomes may in fact has nothing to do with the age of the person, or why certain fracture types that are costing much more than others, or the fact that certain fractures affect certain types of people engaged in certain physical activity or health related stresses in life. All you know is that fractures as a group have this specific outcome on the population as a whole, or even as a few age ranges defined in 5 or 10 year increments. Regardless of whether it is an ankle fracture, a hip fracture, a rub fracture or a skull fracture, such large grouping of data is not exact, and to base preventive health activities on this when a more detailed way of reviewing this data exists, is very much a waste or time, manpower and money.
In the end, mostly cost is what is evaluated by companies, not public health, versus the focus on people by agencies and npos more focused on the patient, not the cost of his/her health care. Cost is what drives these annual reviews that are required by nearly all health care programs. Cost is the reason the wrong applications of data often ensue. We can rely upon financial data to determine where to save money, or prevent high costs from prevailing. We use medical data to determine where a particular illness exists, at what risk, to what age group, involving what particular subgroups of people and why. Unfortunately, programs focused on cost like to brag about the public health incidence/prevalence related information regarding the underlying reasons for these costs. Since the evaluation of incidence/prevalence, and the evaluation of cost, are not exactly the same thing involving the same population selection process and the same sets of formulas, these two cannot be compared with much reliability or unbiasness at the business end.
One of the most popular programs out there designed to model the use of health care services uses this exact approach–cost is the focus of the study, not the reasons for these costs. All heart valve diseases are lumped together as a single group. Neurological disorders like epilepsy cannot be evaluated separately from other mostly unrelated events like tourette’s syndrome, tics, or even MS. This program works well with defining the success and failure of a given system of primary, secondary and tertiary care. But if you want to look at the details of these different levels of care, for example what diseases are being cared for in which significantly costly way, you cannot evaluate the illness or condition and the cost of the health care received for that problem. You can only evaluate the system in general, not the individual at a specific age group level, for a specific gender, for a specific ICD. Chronic heart diseases are evaluated along with arrhythmias. Very high frequency conditions like fibromyalgia, GERD, IBS, COPD, asthma, migraines, ALS, RA, insomnia, sleep apnea, depression, cannot be fully evaluated on their own using this standard health care systems evaluation process and reporting method.
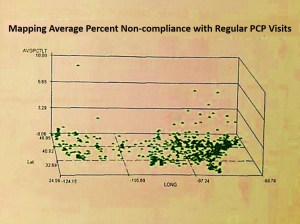
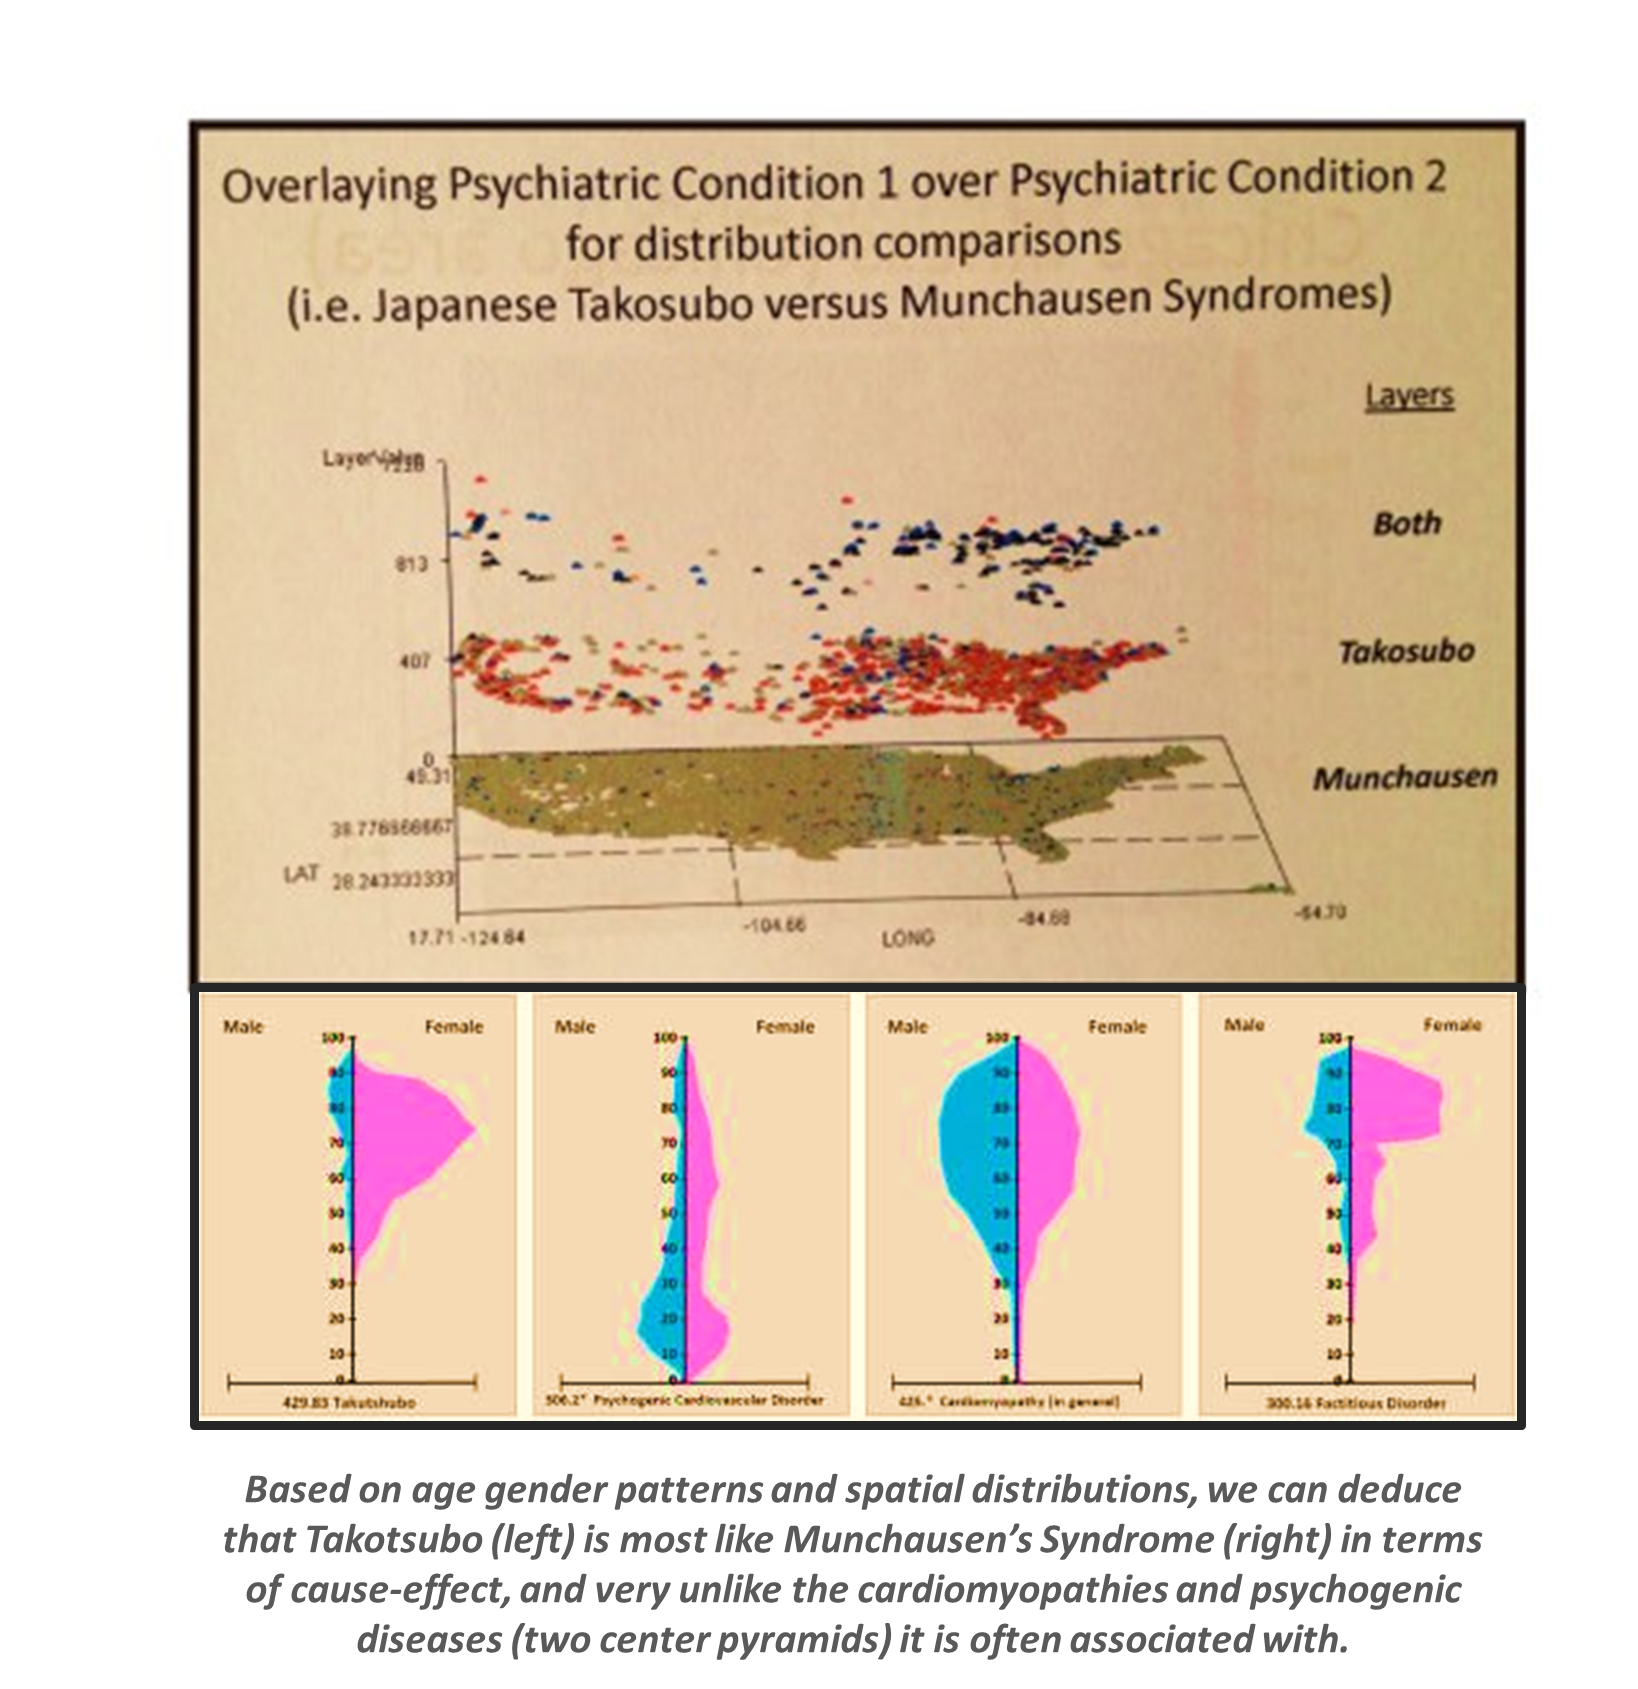
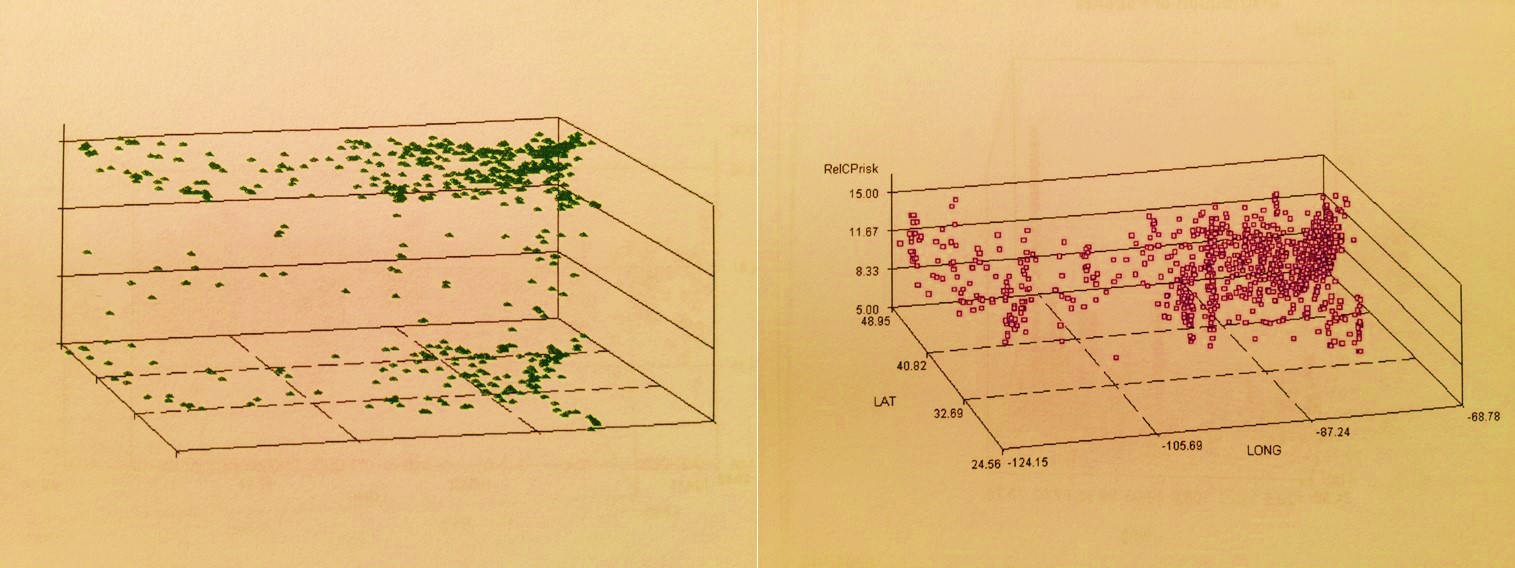
The methodology of disease mapping that I promote corrects for all of these problems. It allows you to evaluate individual care practices based upon age and gender, for a specific ICD, V code, etc., and then relate this information to a cost curve related to the frequency and cost for this specific form of health care required by individuals within specific age ranges. This methodology also allows me to query further into the data to define what age ranges, down to the one year increment, are experiencing a statistically significance difference from the norm, in terms of prevalence-incidence, in terms of cost, for any sized region in the total area being evaluated.
Unfortunately, this methodology is currently not in use. But fortunately, it has other applications to such things as evaluations of cost and utilization in other forms, such as the impacts of local demographics on gas consumption, the effects of people age-gender-ethnicity features upon the total regional market behaviors and consumer related expenses, the relationship between different regions with different employee SIC types and the types of activities they engage in locally and regionally with regard to recreational activities. The nice thing about useful formulas is that the best ones will have multiple uses and multiple applications. My age pyramid techniques for evaluating diseases at the population level is one example of a successful application for these formulas. My ability to use it to generate large and small scale spatial analysis maps of disease incidence-prevalence in relation to place and time is another.
Great innovations occur when you discover something that you know the others in your field have not. It is an interesting experience being two or more standard deviations ahead of the norm. That is where the best discoveries are typically made. Such discoveries, once you have made them, are hard to express and prove to others who have not taken the time to keep up with you. This is due to the lack of interest many people have in making a discovery. Most people just want to behave according to the status quo. People want to follow the flock, not produce their own path.
There is more personal success that follows when you engage yourself as a part of the flock. No one is going to mock you or judge you as being too eccentric when you decide to go this route in studying, research, work, or life. Even the ivy leagues typically shun you when such is the case, especially when something you have discovered or achieved is over their heads, a few feet higher than expected, enough to uproot them from their comfort zone of placidity and apathy about the possibility of making still more discoveries.
Such is the case often in academia. I learned this when I drew up the evolutionary tree for the plant kingdom back in 1988, depicting the metabolism of all the secondary natural products a plant produces–its chemicals that we call poisons, medicines, aromatics, etc. As a teacher, professor or researcher there is a lot of stability that comes with following the status quo. Most people liked to follow Bessey’s image of the plant evolutionary tree. I modified this to better depict the plant chemical paths I spent several years researching, and then integrate that version with two others–one by Robert Thorne and the other a very famous one by Dahlgren. As a chemistry lab professor and research at the time, I thought that now I knew where to go hunting for new chemicals.
So long as you are not that much of an inventor, you get along with other members of your professional group very well. This situation is kind of like being a doctor and finding a cure for something that no one else has found–like stopping a lifelong condition midway, and eliminating it completely–all because you found the status quo writings about such a thing were bogus and artificial, made up to meet cultural and professional-political needs, not necessarily patient or individual needs. I am not satisfied with not coming up with anything new and innovative, something to rest your tassles upon and perform according to expectations, by the book
Bad Surveys versus Good Surveys
The frustration of this lab work I was engaged in led me to go to the medical school library and research what to make of being different in how you interpret things. For the most part I knew I was right brains and used photographic memory and the others were left brained, very linear and logical. That led me to return to an old field of study I favored as an undergraduate student–neuropsychology. A few of us professors in Oregon had this idea on the development of creativity in our independent fields–each of us (at several colleges and universities) were often working as a think-tank trying to come up with more important projects. I was already well ahead with that having monopolized the natural plant chemicals profession (i.e. my taxol and several other cancer drugs work). Our goal was to predict what the next bread-winning natural products discoveries were going to be, ca. 1990/1991.
This is when we learned the differences between creative geniuses and synthetic geniuses. Synthetic geniuses simple reshuffle the cards of knowledge and try to come up with a new order of stuff already known, and a new discovery. Creative geniuses pull their discoveries “out of the hat” so to speak. There is no logic that gets you there–you just figure it out, by putting things together in an “outside the box” way. My chemical synthesis chart was kind of an example of this, due to its integration of something basic with numerous other things never successfully pulled together before. At least this is what I was teaching my students in chemistry/plant chemistry from 1990 to 2000.
There is a lot more to education than what you learn in the labs and classroom. To excel in your field you need to produce more than just what your school or college has asked you to produce. You have to produce more. This common requirements for passing a school program and graduating treats every program as if there was this standard ritualistic test you have to take, or some simple very brief term paper you need to write just to make it through. This is why there are few innovators or creative geniuses graduating from college–those who actually invent and create, only synthetic geniuses–those who reiterate and regurgitate, one step above simply plagiarizing all of the knowledge that is already out there. In statistics, your goal should be to take the old teachings and apply them to the new technology, better understanding both the theory and any possibly new applications for the traditional methods that are already out there. Then you should take the lessons you learned in biology, and apply them to an engineering question, followed by an anthropological question, followed by a psychology research question. Knowing how to do something in just one field isn’t enough.
Bringing all of this back to the field of statistics . . . with the ways in which statistics is used in the workplace, the best innovations are those which either make use of a new formula, or an old and traditional formula and methodology in a new way. The best innovations of this type require that you meet the three standard deviations goal with your work. This means that what you have created has reached a level that is well ahead of the others.
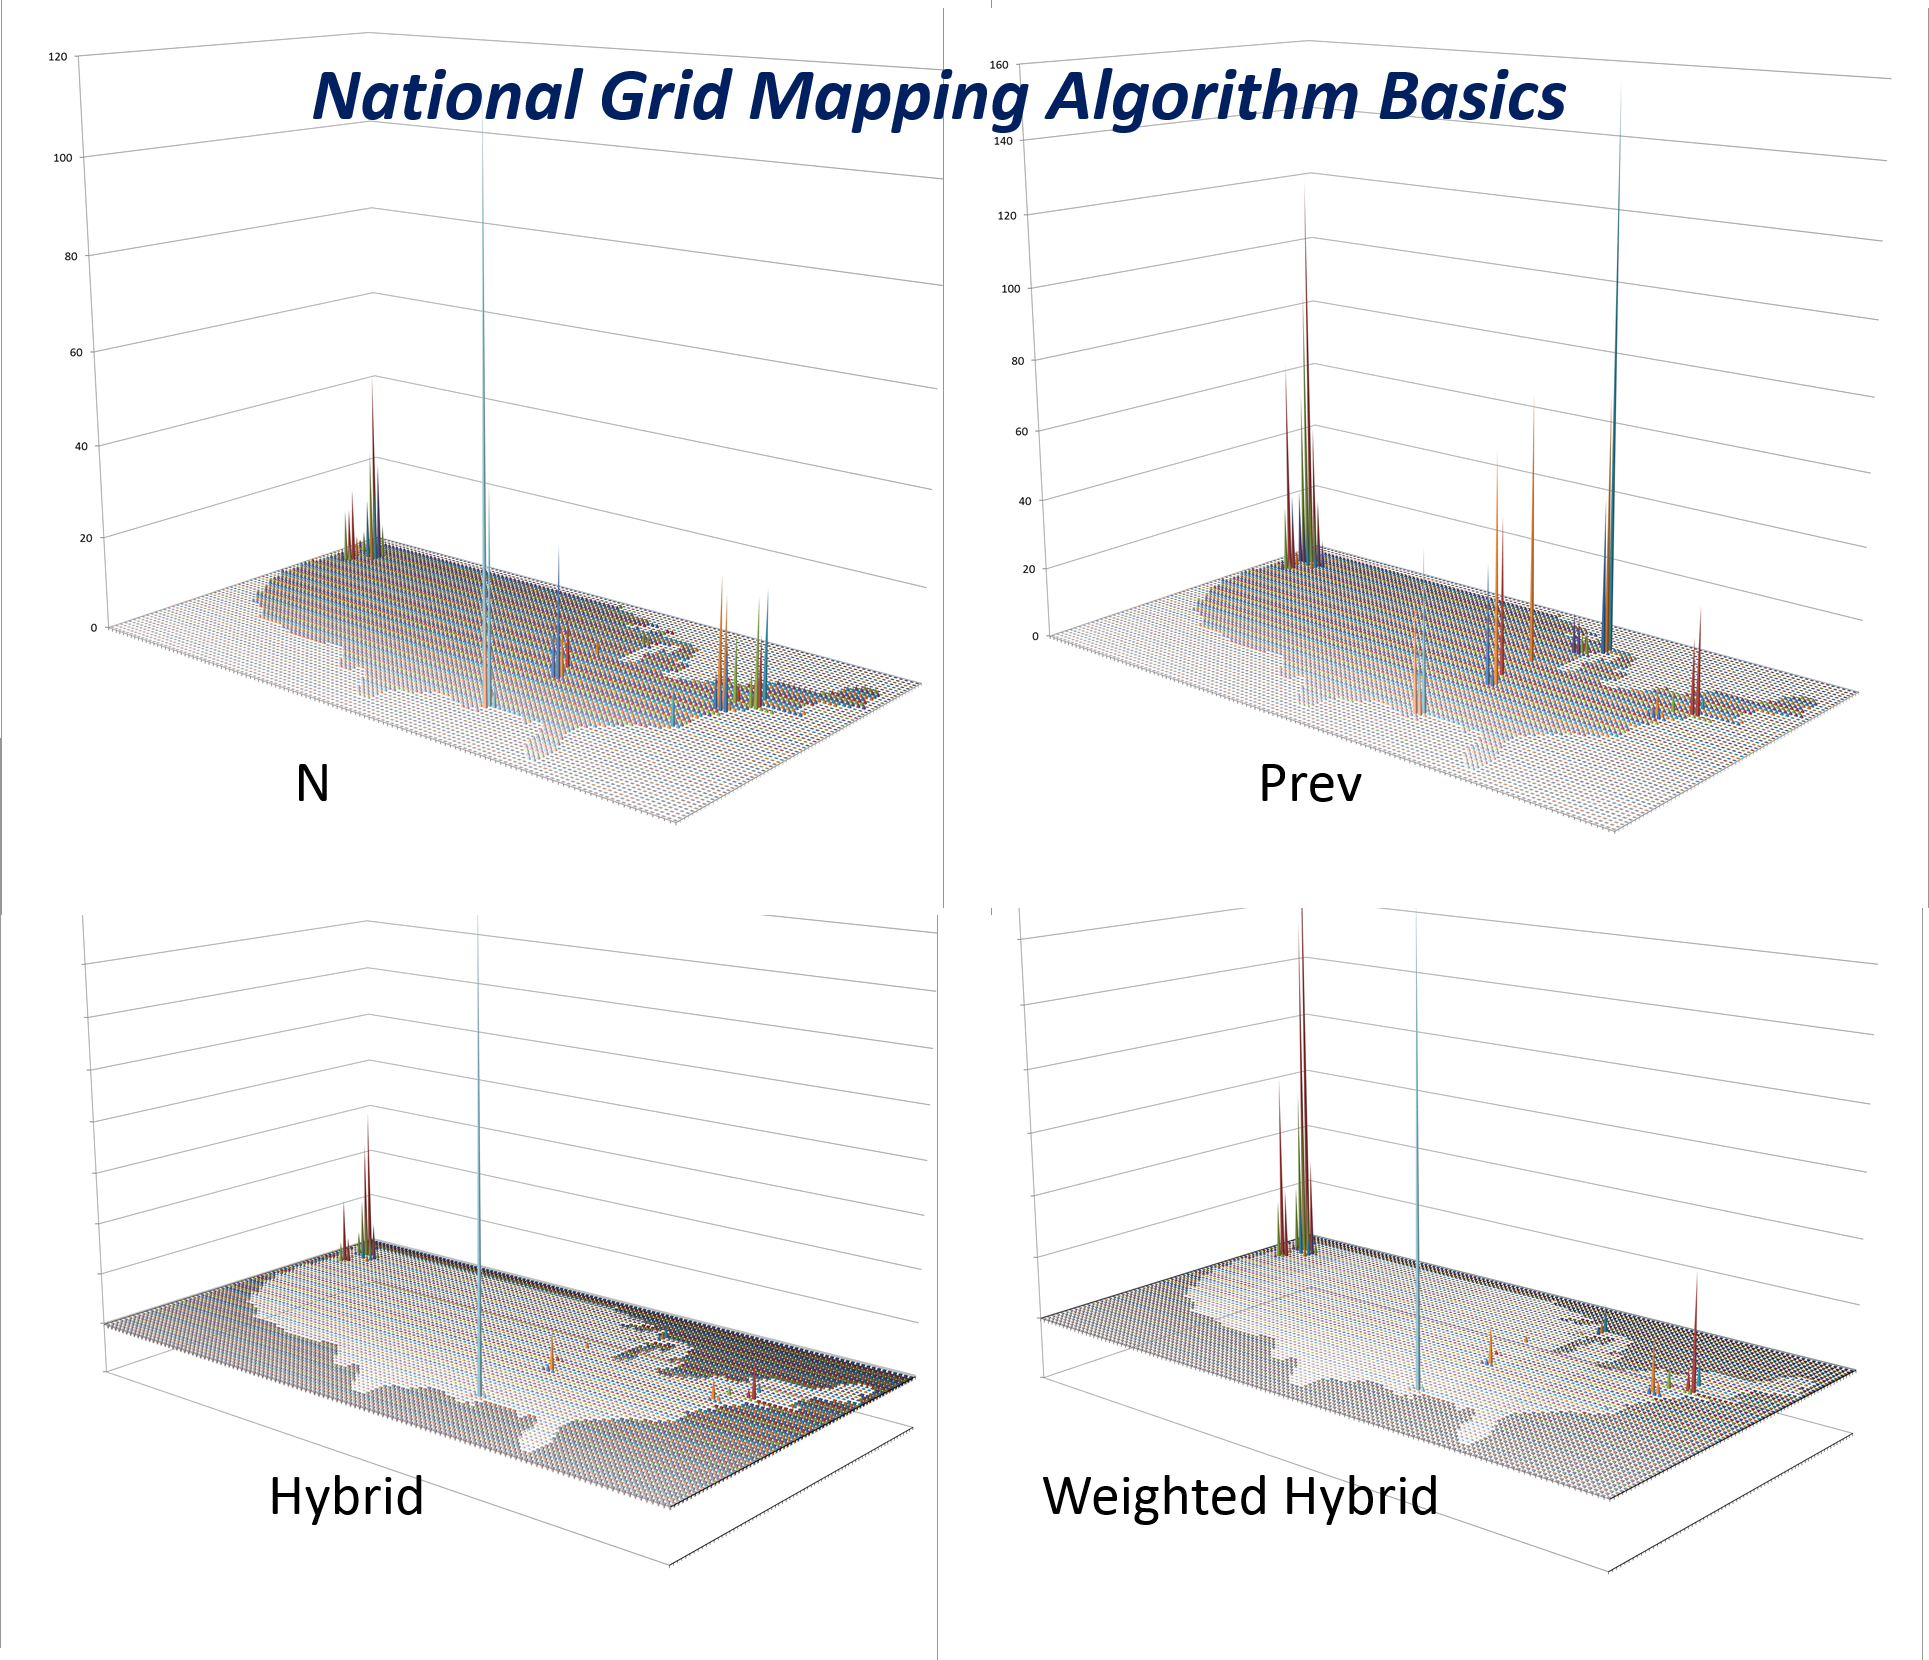
Cost and Prevalence (top row) can be hydridized (bottom row) to produce a new output used to develop different intervention strategies based upon different regional needs.
Unfortunately, when you become productive at this level, making new discoveries, you are also too ahead of your time. Old people cannot follow at all what it is that you have discovered or are stating with your new theorem. Those freshly graduated from the traditional programs are not experienced enough to comprehend what you have done. They understand parts of the theory, but are trained to be status quo like all the rest. They use the traditional formulas, and have many followers who already know their outcomes, or at least how to reproduce them. There is no ingenuity, and in the long run no discovery. It’s like one older Asklepian patting the younger Asklepian on the back in a Turkish temple; each thinks he has independently discovered the same thing as the other–something that is very new and important–all of this happening while Methuselah, who knows just how archaic their methods are, simply stands by and watches.
If you are a brilliant and gifted student, neither the old or new in the post-academic world of work do much to help you achieve anything new with your new discoveries. Unless there is a company or source of support to test and prove the theories or hypotheses that you have developed–some sort of think tank setting–the discoveries to be made are up to you. Only in the best think tank settings do new discoveries become important for businesses to add to their ammunition against their competitors. I refer to this with my colleagues as being ahead of the competition, being 2 or 3 standard deviations ahead in the math and in the discoveries made by using this math.
Innovations require that you continue to promote what it is you’ve discovered. Discoveries that are truly innovative, will also be ahead of the masses, and therefore will not only be slow to be accepted, but also result in a lot of criticism from peers and scholars in your field and a lot of disrespect. First you are criticized and questioned , then you are ridiculed, then they sign you off as being crazy, but finally once they begin to question your theories and hypotheses, they see your paradigm is also correct, and perhaps even better. Then it become a matter of whether or not they want to spend the time to learn what you have done.
So how does all of this relate to biostatistics and statistical innovations?
GIS, paving its way to the top in the business world.
The most experienced from decades prior often run and manage industry, not the young, brilliant or creative. This is normal human behavior. However, this respect we give the more experienced can backfire at times when it limits progress, a result very likely within the IT world. A common sign that companies have this problem is when the company can think of something it should do but cannot accomplish it. This occurs when daydreamers dominate the corporate atmosphere rather than doers. Such staffing problems we often see relate back the work of Edward Tufte, a common example often cited by businesses trying to learn how to improve their productivity and get one step ahead.
It is now going on 30 years since Tufte started publishing his criticisms in books for the masses to read. Yet the masses still like to turn to work to think about what they might be able to accomplish today. This means that if Tufte’s work is being discovered the first time today, these companies are terribly behind. Corporations and corporation heads that fit this description are there because older leaders pushed themselves away from Tufte’s insights and the math potential out there for their company to latch onto. Taking on GIS as a major avenue for research is an example of progress is slowed in this manner. Those managers. Directors, VPs and CIOs who initiate and engage in this process are the weak links in the chain of progress so to speak–all talk, no action.
Edward Tufte’s review of how we present information demonstrates how as a statistician, your work can become severely limited by lack of acceptance if it not status quo. He explains this in the book The Visual Display of Quantitative Information, published in 1984. It is a common behavior for companies to refer to Tufte’s work, without at all following their decisions to try to think outside of the box. This is mostly because they don’t know how to think outside the box, for that would require extra knowledge they haven’t obtained yet, knowledge that is not yet taught as a part of their paradigm. Most of these people are talkers not doers, watchers not explorers trying to lay claim to doing something they could never accomplish on their own, since they don’t have the knowledge base required to engage in such a task.
So, how many companies do we know are actually using the recommendations made by Tufte? Very few. We do not see drawings and illustrations like those of Tufte in most traditional presentations. New time skills are face to face against old-time traditions and ways of thinking. This is why progress is as slow as it is in many industries, in desperate need of reconstruction rather than maintenance. They simple cannot and will not think ahead far enough to pass that 1 standard deviation boundary they force on themselves. Two or three editions of Tufte’s writing later, little to no progress is made and industries that like to mention Tufte still have to prove that they are at all innovative and creative, in any way.

From http://www.edwardtufte.com/tufte/books_vdqi
This hesitancy to think “outside the box” demonstrates to us how very few companies are able and willing to risk the changes that would ensue were they to produce something different from the standards, like Tufte’s books suggest. However, individuals can still engage in some of what Tufte recommends, presenting your newer method in a way that others can still understand it. We know this is theoretically possible due to all of the Excel and Powerpoint options provided to people trying to present their quantitative discoveries in some new way. Very few companies actually make use of these to present any new and innovative information in new ways. This is because such methods require “too much work” to understand, on behalf of the presenter as well as the people it is being targeted for. People are too lazy to go much beyond status quo. Their “comfort zone” keeps them where they are. This means that their accomplishments are not ahead of the time, but instead at most just one small notch ahead of other coworkers and peers in the same field.
Tufte’s work is an inspiration for most large companies. But rarely are Tufte’s recommendations taken seriously. They are discussed and used as pats on the back between certain leaders in the business. Overall the recommendations of change by Tufte are still a decade away from ever becoming reality in most businesses.

ibid
Innovations are a lot like miracles. In the business world there are “innovations”, and then there are innovations, just like in the medical and religious world — there are “miracles”, and then there are miracles. The first of each is synthetic, the second creative. The first is very much a shuffling of old information, the second the generation of new discoveries , new information, new methods, new conclusions.
The most success is generated when a discovery comes several years or more ahead by “innovative” thinkers engaged in big business. But businesses are afraid to take a risk; afraid they might fail. This is what prevents most businesses from leading the pack, taking the option just to follow the other CEOs and CFO’s footsteps. This also means that many times something discovered in such a workplace will result in failure and lack of acceptance. With this failure comes new lessons, leading the inventor to improve his or her invention, until finally, it becomes the success it deserves to be, although not necessarily for a company to take full advantage of–only the select few that are not status quo. (For students with an open mind: see http://www.youtube.com/watch?v=P4gAkM72ah4&feature=pyv&ad=6519114391&kw=ted%20talks, sections starting at 01:37, and 24:00; or http://www.youtube.com/watch?v=A_YaMGoCiwQ&NR=1.)
If you are a statistician working on summaries, new ways to solve problems and producing conclusions should be your first goal. This means you have to completely understand what it is you are analyzing. You have to dissect it down into its parts and pieces, like a frog in a biology lab, and then put everything back together again to see how things work and how you can change those things that are not working so well. This means you have to know the answers to:
- What do these numbers actually mean?
- When are they misleading?
- When are they not misleading?
- How do your results really play out?
- Are there rules you are following in your analysis that are based on assumptions that have not yet been completely evaluated or tested?
This is not always what scientists do, and it is rarely what businesses do. All businesses have processes in place to prevent some of the basic problems with how they develop their statistics. But rarely do they engage in anything that requires analysis of the new discoveries. They fail to provide room for new discoveries, and instead rely upon traditional theory rather than the need for change.

Four diagnoses evaluated for areal distributions. The most effective way to demonstrate spatial medical statistics and to use these to develop effective intervention programs utilizes 3D modeling (DX4). 3D images not only tell you the basic information learned by traditional maps (i.e. DX1,2,3), but also inform you of where to target your intervention activities and costs. The national population grid mapping technique uses small area analyses to identify foci for your starting points and helps to identify routes that are taken by these unhealthy behaviors or medical conditions (DX4).
Engaging in this kind of work requires individuals who can successfully understand the total picture on their own as a part of your team, without help from others. They should be able to test your theory or the changes you recommend in order to prevent mistakes and any new risks that could evolve due to success of what you’ve developed. But when as a company you are not that far ahead of the pact, you are more likely to find these peers but this also meant that you are very susceptible to being replaced or outdone by your competitors. Many companies like to think they are ahead of the pack, but they are not, at least in an amount that is much more than is already out there. If a company cannot convince the people who are served–the consumer population and their bosses or leaders–that it are as far ahead of the pack as you its like to be, its consumers of clients will ultimately go elsewhere for the same services. Success is a lot like fishing for change. Your can react to your personal successes, discoveries, as opportunities, even if it puts you in a worse situation than you when you started this endeavor. But by sticking to your philosophy and your proofs that you are right, always looking into the arguments once they erupt, you are likely to succeed in the long run, although not when you originally wanted to.

Back in 1982, the year I began medical school, I purchased my Sanyo MBC 550, with 4 kb hard drive (2 for RAM back-up, one 5.25″ disk drive read the programs, the other saves your work), with SBasic (short for Sanyo Basic) as its programming language, and Wordstar, Datastar and Calcstar as the software package (http://www.emsps.com/oldtools/w/wordstar.htm). I purchased this in order to write a diagnostic program for something I had already determined much of the logic for–how to analyze a patient or patient’s parent calling into a hot line, with a specific set of symptoms for a plant-induced poisoning case. I called this program Toxidrom (you were restricted to 8 characters for a file name), short for ‘toxidrome’, a term used by Howard Mofenson of Long Island and chief physician in charge of the poison control center, which in turn was a shortened version of the much longer official term ‘toxic syndrome’.

Dr. Howard Mofenson. See http://aapnews.aappublications.org/cgi/content/full/28/6/43-a
This idea came about 15 months earlier when I was attending a 5-day conference on Poisoning in NYC. A presenter at this conference, Dr. Howard Mofenson, the MD in charge of the Long Island Poison Control Center, had this idea that certain types of poisonings would always present themselves in such a way that through symptoms and lab tests, one could more quickly diagnose the poisoning case at hand by entering certain bits and pieces of clinical and patient interview related data. He used lists of barbiturates, opiates, kitchen cleaning products, stimulants, home-stored petroleum chemicals, classes of insectides, etc. to argue and demonstrate his hypothesis.
I applied this concept to plants and their chemicals, with the theory that many plants will have similar intoxication effects due to similar if not identical chemistries–such as groups of alkaloids, phenolics, oils, heart toxins, liver toxins, etc. each group bearing a similar chemistry, solubility and toxicity due to production via a similar metabolic path. I next drew up the first version of my plant taxonomy tree in order to see how particular recurring chemical groups were laid out in terms of plant families and family specific metabolic pathways. I then realized that I had to go one step higher in the taxonomy tree to develop a good model on how these poisons based on similar chemical groups were distributed in the flowering plants kingdom.
.
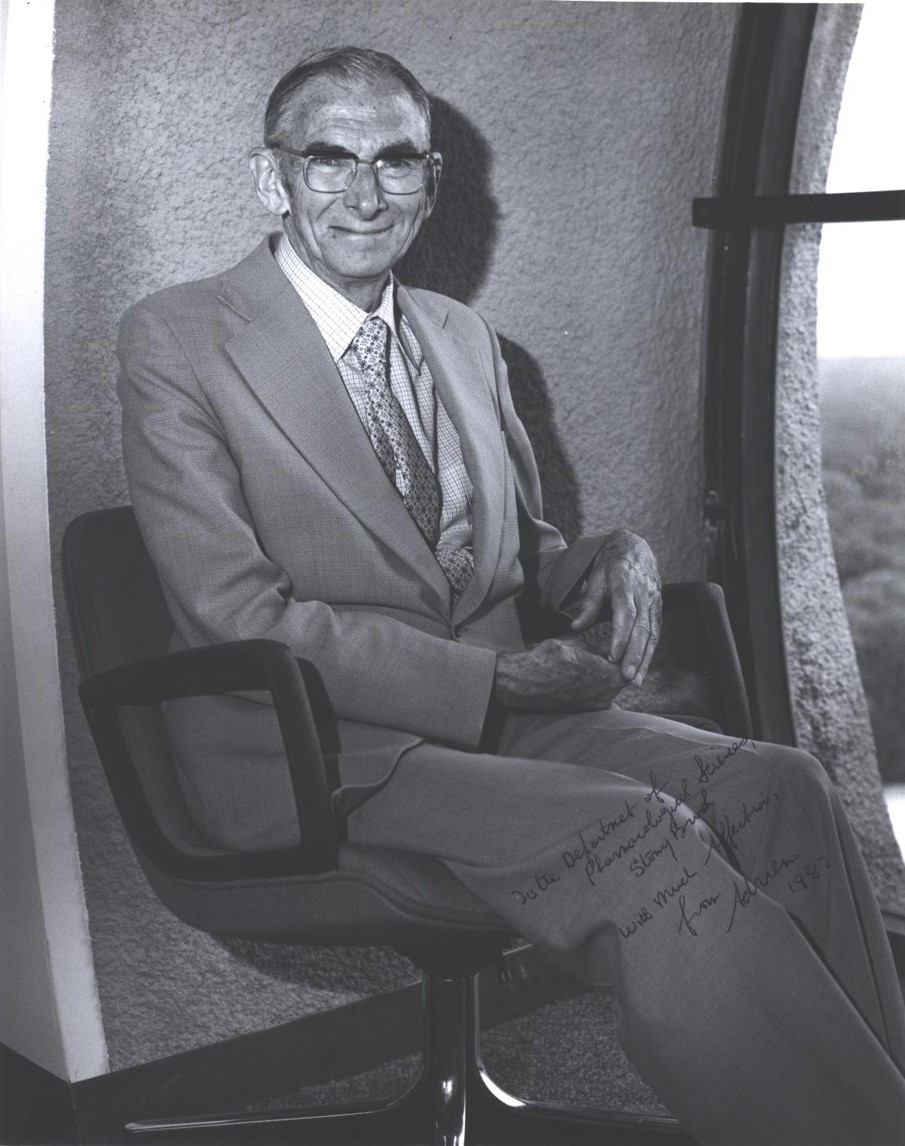
Prof. Adrien Albert in his office in the famous ‘robotoid’ HSC structure in 1982.
The signed portion over his right knee states
“To the Department of Pharmacological Sciences, Stony Book. With Much Affection, from Adrien 1982”
In my third year as an undergrad at college, I took Adrien Albert’s course. When it was given, he was just a visiting professor from Australia. The following link is to the pages from his course handouts on ‘Selective Toxicity’, pages from a draft of his book then in the works. To this theory I then added to my personal noted on plant toxicity. This led me to be a lab assistant in several neurotoxicology and synaptic receptors/Na+-K+channel study places on campus.
Drugs in the service of Man by Adrien Albert
At the time, I was also enrolled in classes taught by a professor from Australia who had finally become a professor at SUNY Stony Brook. Several years earlier (1978) I had taken a course of his entitled “Drugs in Service to Man” as a part of my pre-med curriculum at Stony Brook. I bought his book at the time by the name Selective Toxicity, 2ed, and used this philosophy to begin to unravel and better define the chemistry of poisonous plants. Next I pulled all of this together with the teaching of Mofenson in the 1981/2 five-day conference on Management of Emergency Poisoning Cases.
During my first weeks in medical school, in a course given by the pharmacology department, Adrien Albert discussed “selective toxicity” again. I immediately saw applications of this philosophy to the databasing of plant toxins, since many had similar forms of selective toxicity, and developed a 1-5 Likert scaling of the selective toxicity of a given chemical or chemical groups in plants in order to better quantify the toxicities they had and shared taxonomically, and the related toxic syndromes that could be defined by this philosophy, including a quantification of their degrees of severity in various symptom types, their degrees of toxicity, their reaction to specific binding sites, and specifications as to their half life and such in the metabolism. In retrospect, it is kind of funny to think about what little the department understood about the novelty of this application of knowledge in the very much newborn IT medical diagnostics world. I was then applying for graduate schooling with the pharmacology department, repeated on a per semester basis from 1981 to 1984, but never got the change to implement this use of the toxicology data derived on the teachings of the medical school’s own professors–Drs. Mofenson and Albert.
So be it, less than six months later, in 1982, I had purchased my very first computer and in just a semester my database was developed. The first version I completed by the end of the Fall Semester in 1982. The PC was the Sanyo MBC and the programming software Datastar.
Over the next two years I continued to develop this database, added to it, building it up to about 300 entries, with about 75 well defined toxic syndromes. Throughout those first two years of medical school, my applications for grants were to no avail unfortunately. The pharmacology department was unwilling to invest in the idea of computerized diagnostics. Interferon was the hot topic for the time, and AIDs was about to become a worldwide epidemic disaster.
This particular aspect of computer-based diagnostics was no longer researched for medical use much by 1985. Fortunately, in late 1986 I was asked to integrate it into another database on herbal medicines, nutritional supplements, oriental medicine, homeopathy, etc., by several naturopathic medicine specialists and political leaders in this new and growing alternative medicine field. So, I used this experience to develop several dozen toxidromes for plants used as herbal medicines, in order to avoid repeating the same toxicology data across numerous lines of products and formulas making use of similar plants all with similar chemistry and similar toxicities, we made a database for cross-referencing based on just the plant toxidrome and related severe side effects. This saved us from having to enter the same details numerous times. Since we were using an early hierarchical database for this work, one only had to connect to the toxidrome to what symptoms exist in the plants being discussed for the various products, formulas and recipes reviewed. I also applied this to identifying groups of plants that if used chronically were toxic to the kidney and liver, as well as those which were fetotoxic, or capable of inducing abortions, and the like. Recommendations against certain OTC products use, especially in combination with certain prescription drugs, were then proposed. This work was completed by the end of 1987.
 The neighbor’s Kaypro, with a 4 MHz Z80A processor, dual slimline 400 KB floppy drives, and built-in 300 baud modem, in DOS, with DOS to CPM/SYS conversion software
The program using this dataset continued to grow in popularity and was bought by a larger company, put on the internet, re-bought and then put on the web, and then purchased back by its initial creator. It was known as IBIS (Integrated Botanical Information System) and originally produced and marketed by AMR’TA (Alchemical Medical Research and Teaching Association). During this time it changed from a basic pre-windows format of DOS to Win3.1, to various generations of traditional Macintosh and non-Macintosh windows and non-windows formats. Using my neighbor’s Kaypro computer that had just come out, I was able to transfer this old information in the old CPM/SYS formats to a new DOS system floppy form. This Kaypro had the new programming, reading language and software needed for converting one to the other. As a result, I changed everything from CPM/SYS to DOS in about 3 weeks. The database and notes related to my Toxidrom are still circulating around amongst the various alternative medicine fields.
Once my copy of the old CPM/SYS file disks with Wordstar and Datastar information on them were transferred to new disks, I built upon them using the Word program. This information was integrated into a textbook for my course of the evolution of plant chemistry and medicines beginning some time around 1991.
Toxidrome is now a standard term in many of the plant toxicology writings (100th monkey and butterfly effects; see the surviving note on this herbal med toxidrome at http://www.all-natural.com/ginkgo.html). By the time this became popular, I was on my new topic and progressing in another direction. Academicians may disagree with what I have just said, but this is the sign of true innovation and success, not constantly arguing with the status quo due to your discoveries. However, I used this logic to produce my evolutionary tree of plant chemicals, the taxonomy tree used to teach my courses on the same beginning back in summer of 1989, for the next ten or twelve years.

Inventors of the Hexagonal Grids and Theissen-Voronoi Polygon methods for Population-Area Analyses
Innovation 1 – The Use of Hexagonal Grids to Analyze Space, 2002 (see Oregon State Pollution and Chemical Release Site study)
Innovation 2 – Evaluating Statistical Differences at the very large N Population Level, 1997 to 2005
.
Innovation 3 – National Population Gridmapping [NPG] and the GridEcon Matrix [GEM], 1997 –
.
…to be continued

“. . . the solutions to our problems lie outside the box.”
Aviation Week & Space Technology, July 1975
