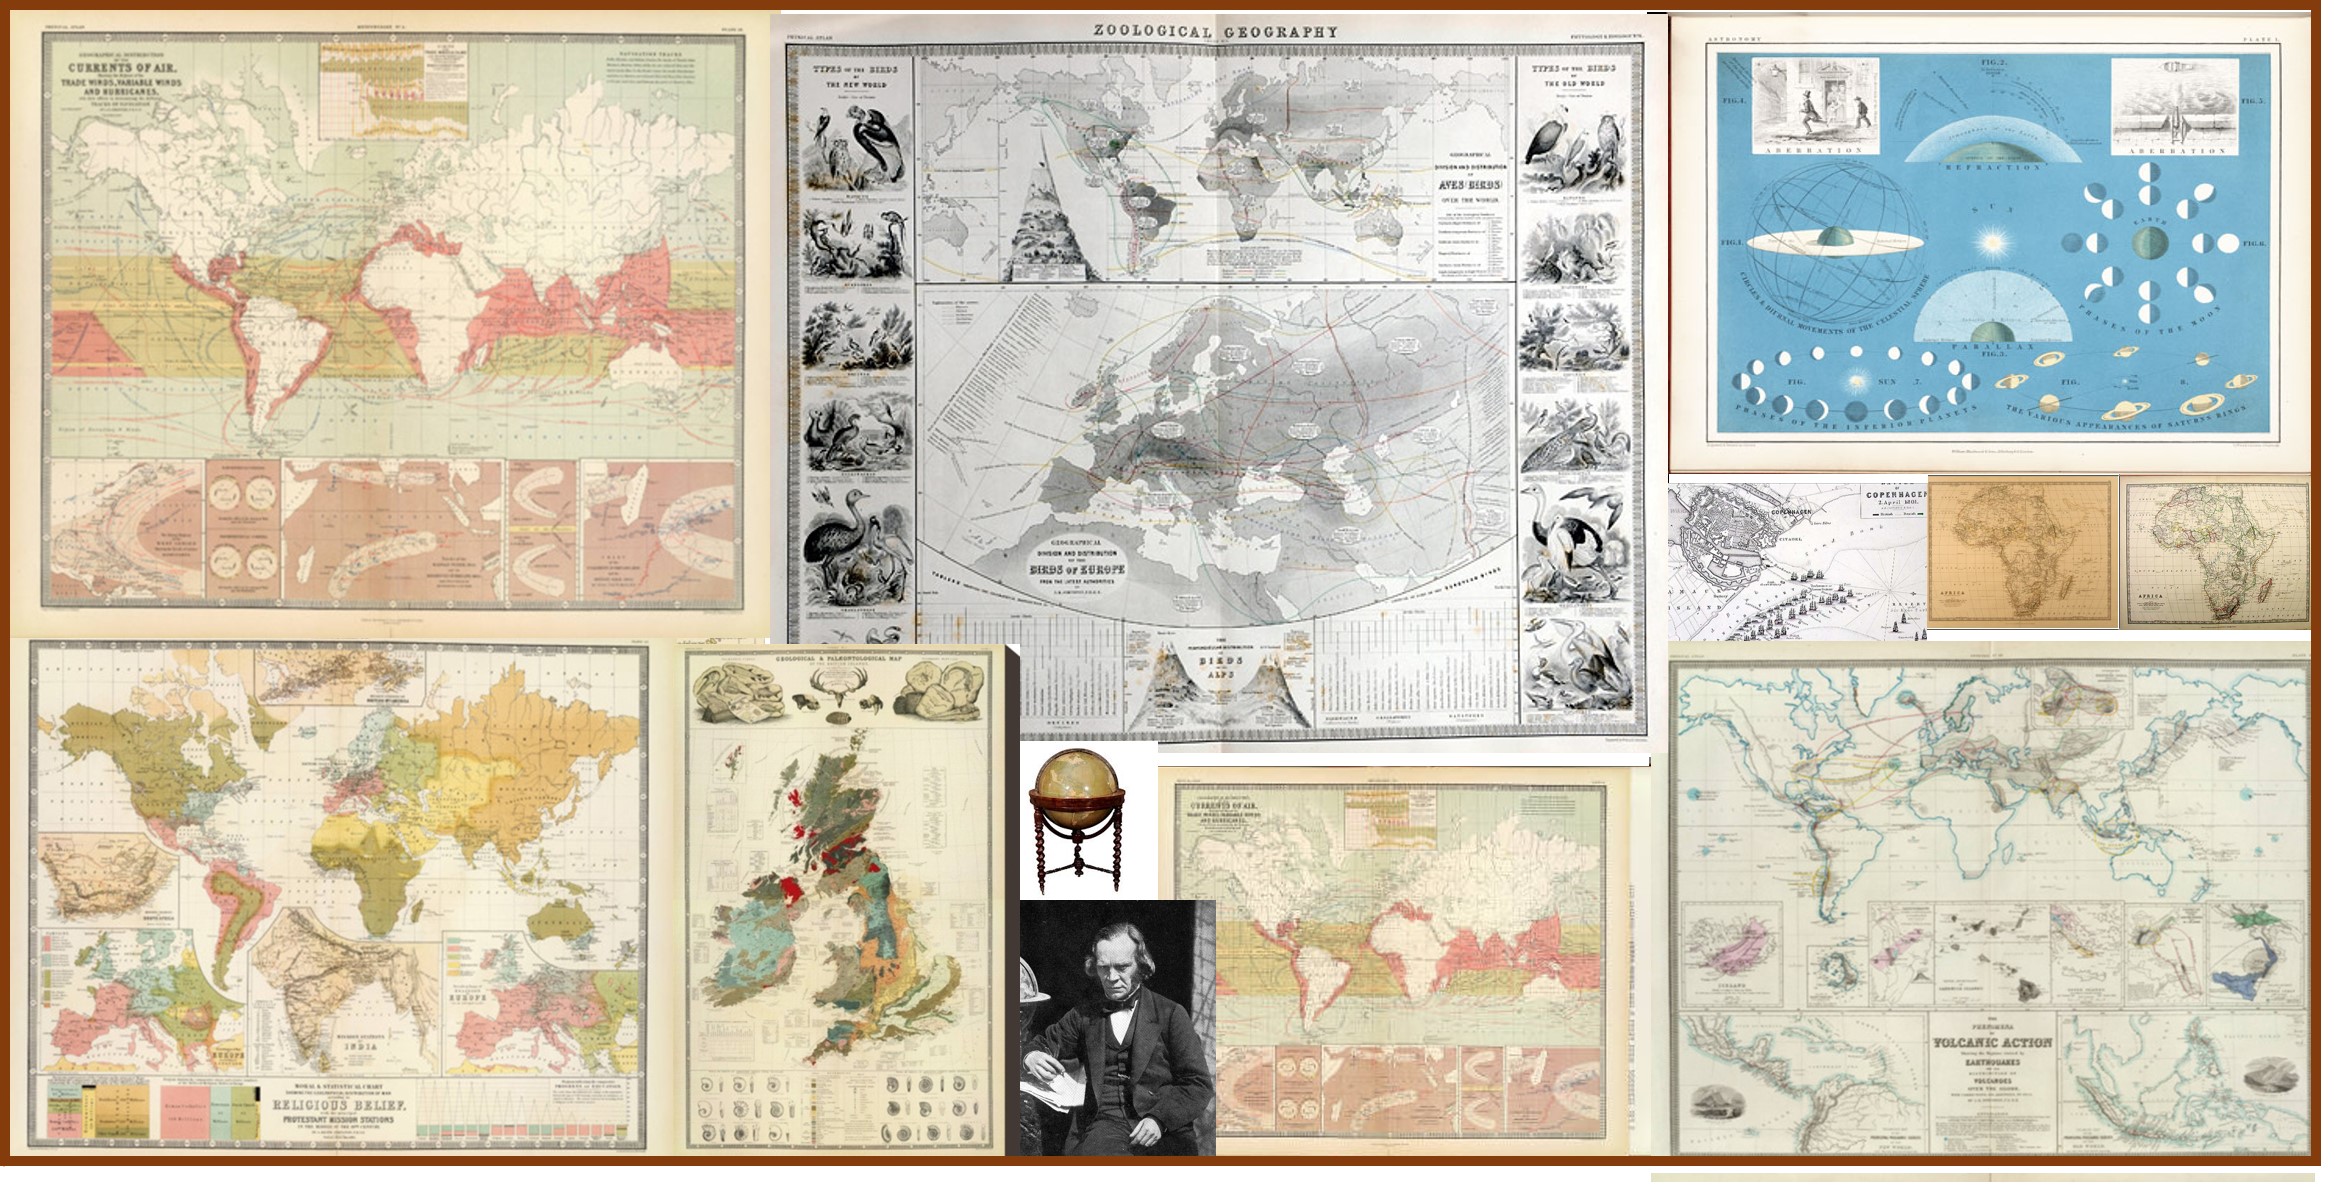
Alexander Keith Johnston (1804-1871)
.
Link to Original Article: 1856 – AKJohnston_Transactions of the Epidemiological Society of London
Notes: The North America portion of Johnston’s map has been reviewed on a separate page (LINK). A detailed review of Johnston’s entire map is in the works, but is still a few months away (2/2012). 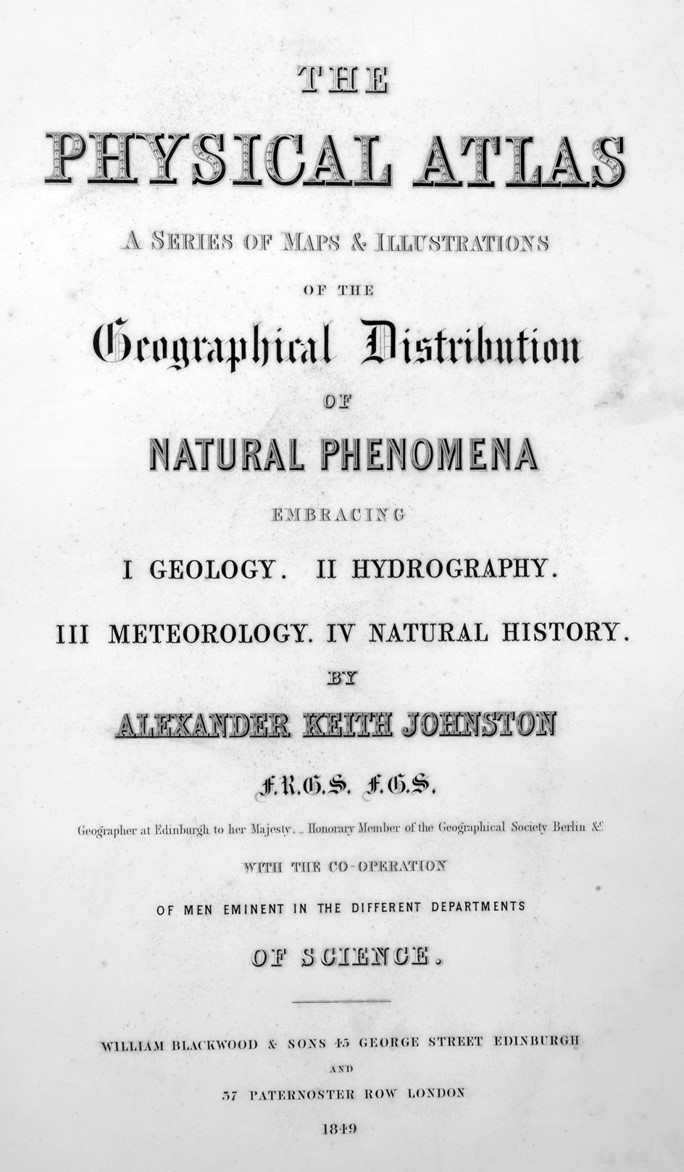 Introduction
On May 5th, 1856, Alexander Keith Johnston gave a speech to the Epidemiological Society of London at its annual meeting. The topic of his presentation was the geography of disease and its natural history. Well known for his books on the mapping of traditional world and political geography and natural phenomena, he produced some of the most impressive detailed maps of the world for his time, displaying its various physiographic, meteorologic, anthropologic, cultural and linguistic features. Johnston’s map on disease was the third such map to be produced on world epidemic and endemic disease patterns, and the first to be published and distributed in the English Language by a Western European country. Johnston’s work is preceded by two very important medical geographer’s impressions of the earth. The first geographer to map disease was Heinrich Berghaus, whose map depicted the most important endemic and epidemic disease patterns then known to exist as regional conditions. This was followed by Adolph Muhry’s book, which focused a lot more on climate in how it presented the behavior of diseases on the earth’s surface.
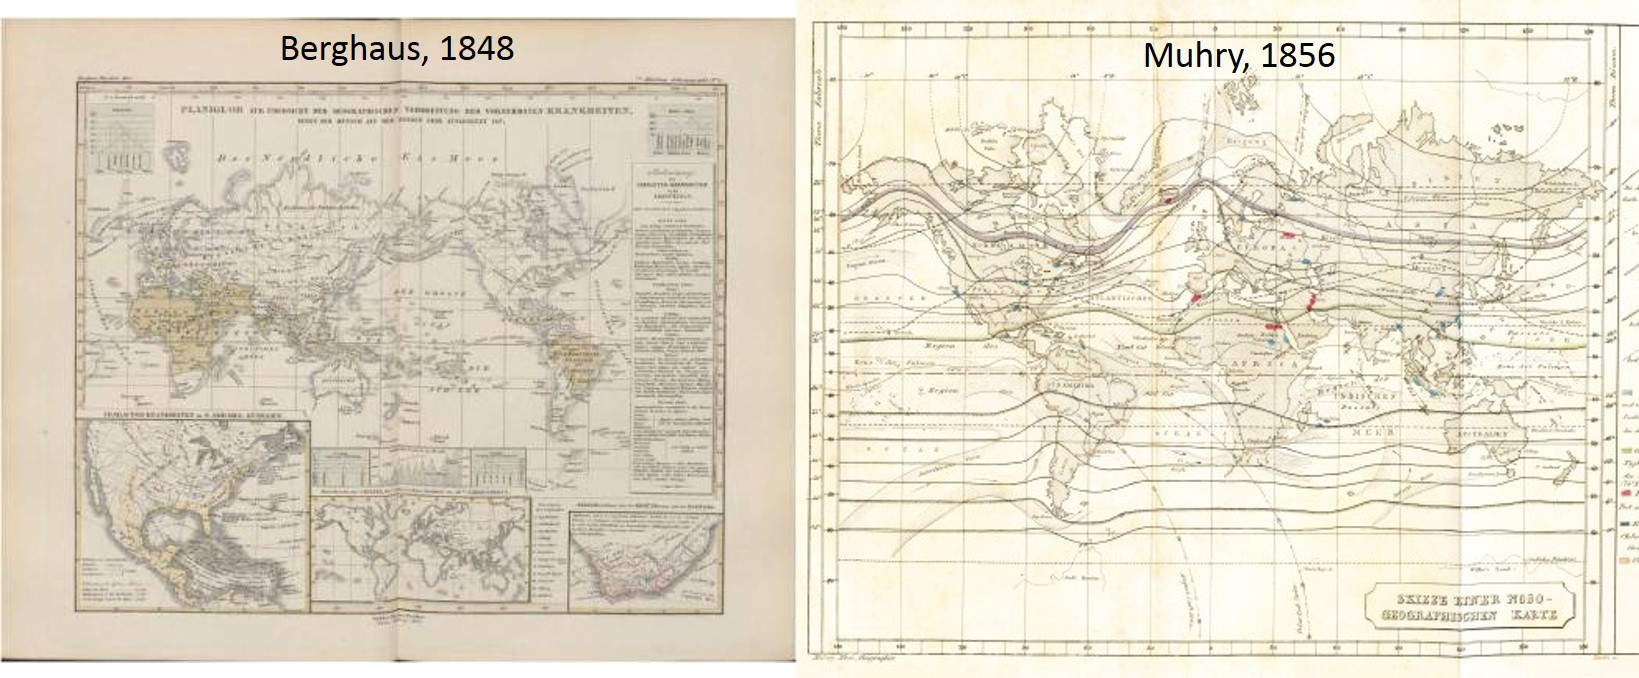
For the most part, these two maps depicted much the same knowledge already out there about disease patterns on the earth’s surface. The best known geographical features that each of these maps displayed included the impacts of latitude on the distribution of certain endemic disease patterns considered to be limited to the equatorial region, between the tropics of cancer and tropic of Capricorn, with the true northern and southern limits placed somewhere between 37 and 40 degrees in either direction, depending upon the ways in which these disease boundaries were defined. Next, there was an attempt to demonstrate the impacts of weather in relation to this boundary to the tropical or torrid zone of the earth, as it was termed in ancient Greek and Roman texts. The oceans formed a very definable boundary between each of the major land masses, with oceanic air and seasonal and latitude based prevailing wind patterns dictating how any health-influencing features of the atmosphere might effect the land and people below. With this method of visualizing disease patterns, geographers like Johnston and most of his predecessors were able to define the relationships that were felt to exist between certain classes of disease and the climate, the place of the earth in terms of latitude, and whether or not a region had much or very little to no exposure to the maritime climate, waters and wind patterns.
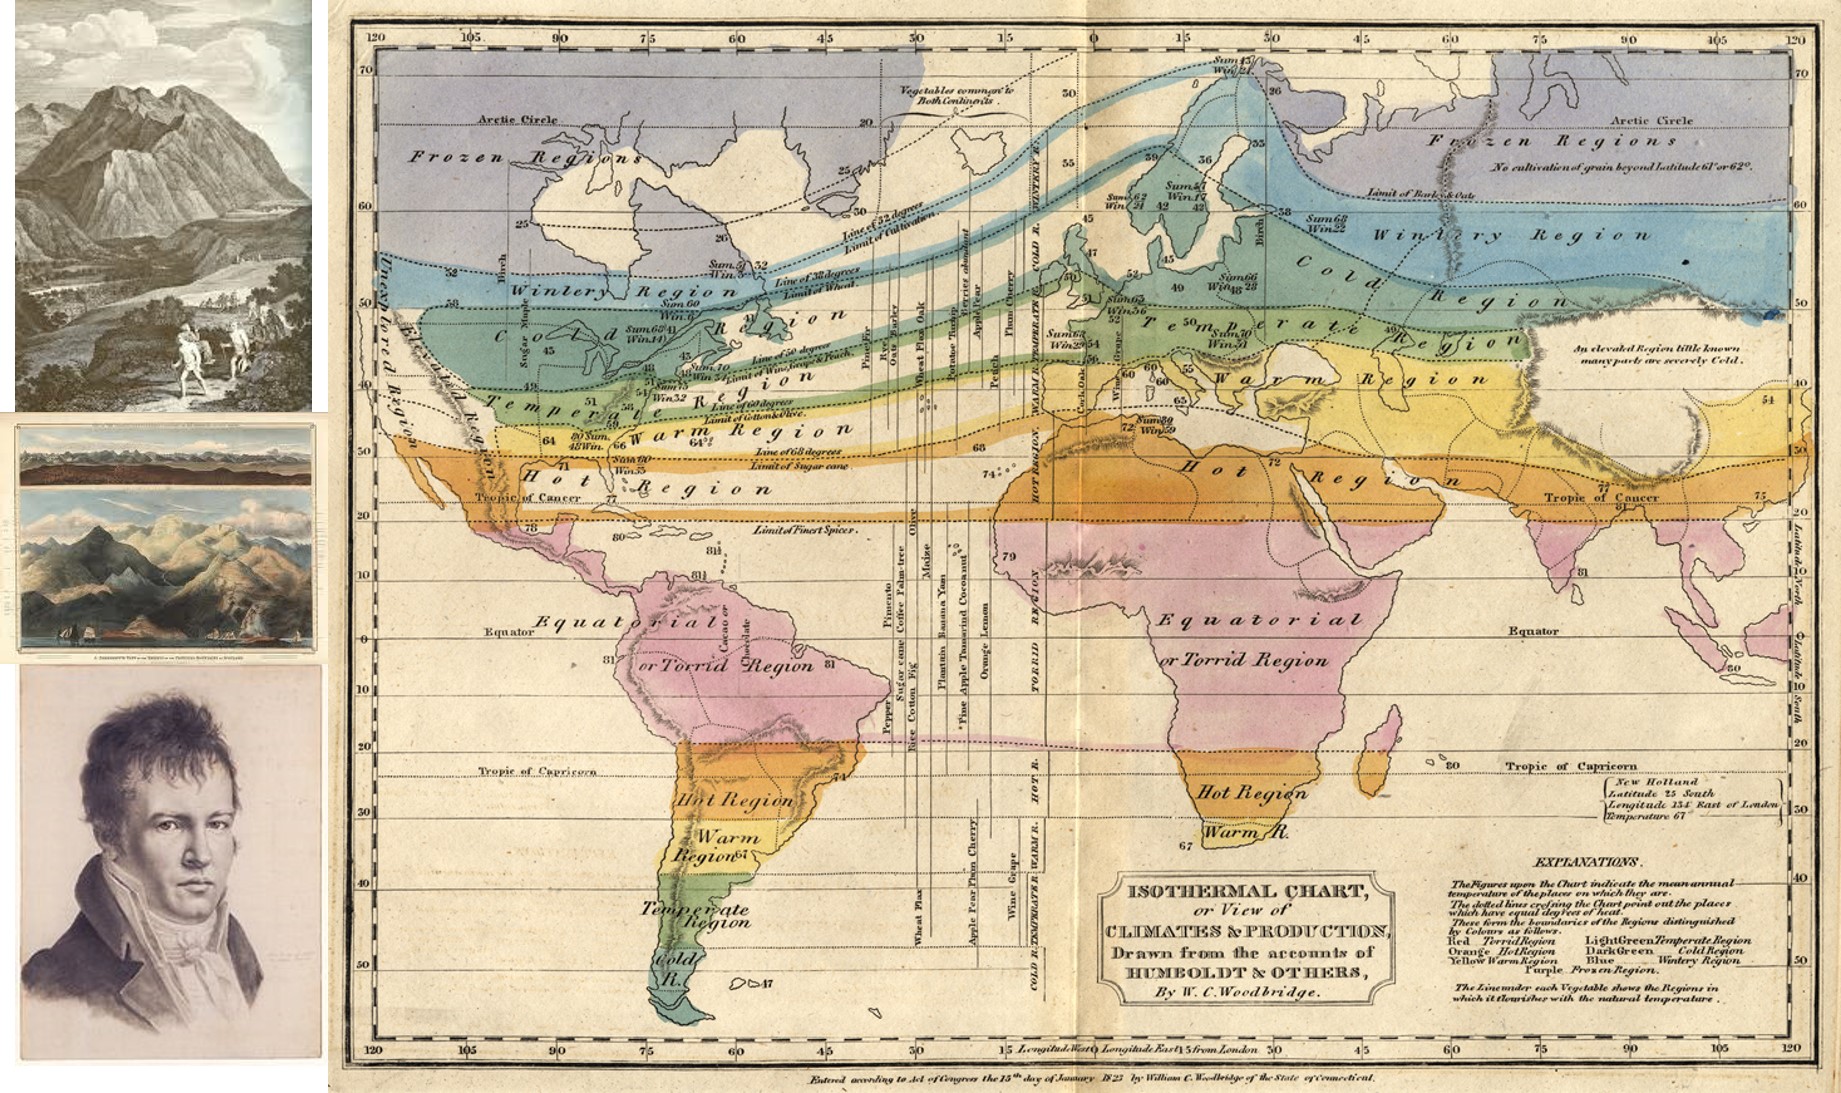
Alexander Humboldt’s Isotherms helped differentiate the unhealthy Torrid Region from other healthier settings
Geographers used this to define where the healthiest places to live were, and where one had to remove to were he/she taken on by a certain medical condition or disease state. Geographers used this same philosophy to define where diseases existed, how they came to be, and therefore, based on this philosophy, how to prevent them or treat them as if they were completely or almost completely environmentally induced. Observations from about 1790 onwards with the fevers and in particular yellow fever helped medical geographers further define their theories of place and disease, and begin to break these theories down into individual subsets of claims and discoveries. In this way the fevers were differentiated from each other due to their cyclical differences, with continuous fevers lacking periods of normal temperate noted to be primarily seasonal and weather related, and most other diseases found to be consequences of the environment, humidity, temperatures, place and time of the year. In this way the fevers could be broken down into remittent, intermittent and ague fevers, terms used to define the various forms of fever, later referred to as malaria, typhus, typhoid, spotted and yellow fever, and even later differentiated further through the discovery of their microbial causes and host-vector relationships.

The Torrid Zone was the source for Yellow Fever in the western hemisphere. This political cartoon of Jamaica places the symbol for Yellow Fever in the center; to the left in grey is “Sore Throat” and to the right in grey is “Dry Gripes”. Notice the sun symbolic of heat and solar apoplexy (sunstroke) above.
The next major symptom used to map diseases was diarrhea, its worse form dysentery, and its ultimate, very deadly forms cholera morbus, cholera infantum and cholera asiatica. The common forms of diarrhea had geological and zoological causes. The geologic or mineral causes for these were well known, such as the diarrhea induced by imbibing mineral spirits or sal Epsom and sal Glauber. Dysentery had two types of causes, both unknown at the time, the traditional amoebic form due to the organism entamoeba, which had well-defined organism-defined geographical boundaries, and the various opportunistic forms without geographic boundaries developed due to foods contaminated by shigella, listeria, salmonella, and numerous other bacteria.
When Asiatic cholera became the next global epidemic in 1832 (1817 events brought it to Europe, but not the rest of the world), replacing yellow fever as the most important disease to understand the geography for, we see geographers now fully applying the ideas the lessons that yellow fever, malaria, typhus and spotted fever provided them with. The differences between endemicity and epidemicity were now fully understood, and the idea of naming disease based on their geographic niduses and natural history was now its peak. Geographers devoted to the medical geography field like Johnston often ignored the animalcules throughout much of their discussions of the cause for illness. The role of human behaviors related to sanitation and tendency to reside in crowded living situations is what form much of the second half of the geographical theory for disease. A few more years were needed for ecology and animal life to become a part of the regional diseases paradigm. Johnston tried merging together the observations of those who believed in the climatic, meteorologic, meteoric (precipitation, comets, asteroids, etc.), volcanic, atmospheric (gases and air emitted by earth), electro-magnetic, telluric (earth magnetism), terrene (terrain-soil-earth), hydrologic, pedologic (soil), geologic, and topographic-physiographic theories for disease.
Important to note here–Johnston’s work and writings are focused on the geography of disease, setting aside the non-geographic theories that focus on people. Johnston does make mention of the spatial aspects of populations. By referring to “Jörg” in his text, he is most likely making reference to Eduard Jörg (Link to Google books by him; see esp. Nord-Amerika text). Jörg was a very popular German medical topographer. Johnston’s inference to Jörg provides us with insights into Johnston’s personality. We see very little inferences made to the famous German writers for the time by other disease geographers like Snow and Farr. We therefore have an important political statement about the undertones then existing academically between the German miasma nosologists (see my page on Carl Friedrich Canstatt) and the British Zymotic Nosologists which Farr was helping to develop.
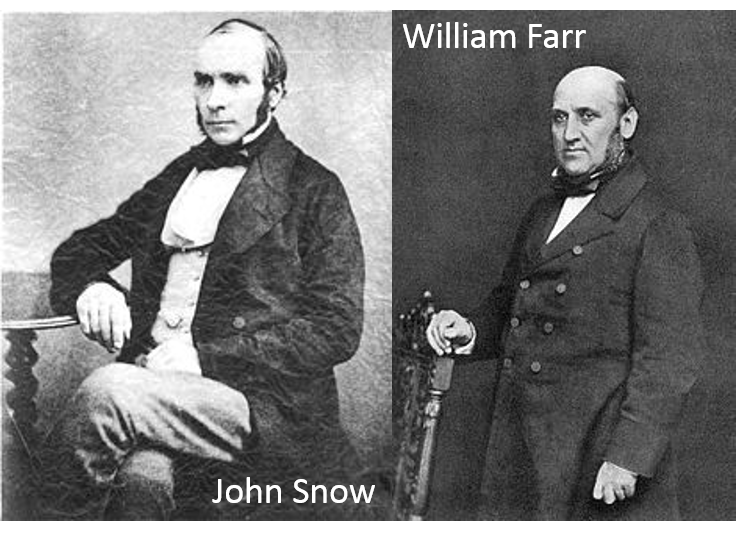 More than likely, as Johnston was finalizing his hypotheses about diseases around the world, other physicians like John Snow and William Farr were developing the details of their own hypotheses, which would not appear much in the literature during the next decade.
Snow focused on water, population density and contamination. Farr was replacing the miasma theory with his version of the zymotic theory first described around 1837. Farr’s theory drew attention away from the different roles that the earth and climate played in disease development. At times, these two theories very much seemed at odds with each other, for the supporter of one rarely went into the details about the other in his writings. We see more the acceptance of two overlapping theories in temporal sequence merged to form a distinct hybridized philosophy that two competing theories become merged together to form a more complex combined set of theories for diseases. Nevertheless we know that such was the case when we review the taxonomy or nosology of diseases published for the time. Those diseases that fit Johnston’s geographic paradigm are present in the nosology, but some are converted to certain zymotic subclasses (zymosis included the common immunizable and infectious, non-immunizable disease like cholera, yellow fever, etc.) and other diseases transferred to other non-zymotic classes and subclasses (for example, what are currently viral diseases and poison diseases were often merged together). Johnston’s diseases and his global disease map do not take any of Farr’s theory into account. One needn’t do so when place and the natural features of places are all that are needed to explain disease patterns. Johnston is detailing those diseases which he can assign places to in terms of their epidemic and endemic behaviors, at least according to his observations as a geographer, not as a physician.
. .
.
Johnston’s Article
Johnston’s speech was published by the Transactions of the Epidemiological Society of London and is 45 pages in length. A basic outline of its content follows:
- 25 – Introduction
- 27 – Regions of Disease corresponding with seasons and zones of climate
- 27 – I. Torrid Zone, or Belt
- 28 – II. Sub-Torrid or Temperate Zone, or Belt
- 29 – III. Sub-temperate, Sub-arctic, and arctic zone
- 29 – Sketch of the Climatology and Diseases of the Different Quarters of the Globe
- 29 – ASIA
- 29 – India
- 32 – Ceylon, Malacca
- 33 – Sumatra, Borneo, Philippines, China, New Guinea, Australia, Tasmania
- 34 – New Zealand
- 34 – AFRICA
- 35 – Algeria, west Coast of Africa, Slave Ships, Loango
- 36 – Cape Colony, Kaffraria, Natal, Madagascar, Mozambique, Egypt
- 37 – AMERICA, NORTH
- 38 – Oregon
- 39 – California, Mexico (incl. Matlazualhuatl) New Mexico
- 40 – Central America, West India Island, Cuba
- 41 – Porto Rico, Jamaica, Barbadoes, St. Lucia, St. Kitt’s, Tobago
- 42 – Trinidad, Bahamas, Bermuda, Canada, Newfoundland
- 43 – Nova Scotia, Cape Breton, Prince Edward Island
- 43 – SOUTH AMERICA
- 43 – Venezuela
- 44 – British Guiana, Brazil
- 45 – Paraguay, Buenos Ayres, Falkland Islands, New Grenada
- 46 – Peru, Bolivia, Chile, La Plata
- 47 – EPIDEMICS
- 47 – Yellow Fever
- 52 – Intermittent Fever
- 54 – Ague
- 55 – Cholera
- 58 – The Plague
- 60 – Typhus
- 61 – Phthisis (Tuberculosis)
- 62 – Cretinism
- 65 – Goitre, Leprosy
- 66 – Pellagra, Italian Leprosy or the Lombardo-Venetian Plague
- 66 – THE ARMY
- 70 – THE NAVY
The link to Johnston’s article appears in the beginning and at the end of this review.

Yellow Fever, from Johnston’s map
Important observations on Johnston’s article are as follows:
- Definition for Medical Geography: “The object of medical geography is to ascertain the laws by which disease is distributed, or the manner in which certain conditions inimicable to the health of the human frame are found to prevail in certain regions or localities.” (pp. 26-27)
- “Similarity of geological formation indicates a similarity in the diseases of a country as seen in the localities visited by malarial fevers.” (p. 26)
- He defined torrid zone diseases as dysentery, yellow fever, diarrhea, malarial fevers, and affections of the liver; subtorrid or temperate zone diseases as inflammatory diseases, represented by typhoid or typhus fevers (gastric, bilious and enteric fevers, typhus and typhoid were not yet distinguished); and subtemperate to arctic zone diseases as catarrhs and colds.
- Cretin and Goitre are closely related to elevation and topography, with the focus on montane settings.
- East and west (longitude) differences are noted for the Plague (in Europe presumably)
- Allusions to the Pacific Rim are made: India’s tendency to have frequent “earthquakes and violent hailstorms” in its tropical settings.
- Breezes from afar are very important, such as the Africa’s sirocco, monsoon winds, Madras’s sea breeze known as “the doctor” (presumably a health-giving wind), the simoon or hot wind from the desert of Algeria, the “smokes” vapor clouds of western Africa’s Sierra Leone area, the mirage and Khamsin of areas around the Nile.
- The deltaic environment is an important ecological requirement for cholera; Johnston links the India delta to dysentery.
- Sanitaria in the high elevations sub-Himalayas are noted.
- Specific regional diseases of local fame are noted, like “Maha Muree” at the base of the Snowy Mountains in Gurwhal and Mumaon and “the plague of Turkey”. (Identifications for each uncertain.)
- China is associated with intestinal worms, which may also related to liver flukes and other animal born worm diseases linked to the Orient.
- Regional, culturally-linked animalcule diseases are noted, such as Guinea worm, yaws, craw craw, leprosy.
- New Zealand experienced “Ngerengere” or lepra gangrenosa.
- Marshy districts are usually considered very unhealthy.
- Three characteristic winds are defined for North America: the northeaster that is damp and cold, the southwester from the Gulf of Mexico into the tablelands on up to St. Lawrence, and the continental wind crossing the continent from the northwest. The nor’easter is called the catarrh wind, and the southwester the malaria wind, capable also of “disturbing most of the functions of the liver.”
- In Louisiana: there is the “cold plague”, Breakbone fever is related to the 40 degree latitude line
- Milk sickness is noted in the great plains to the north. (I have two pages on this, ca. 1800 and 1830-50 approx.: Link1, Link2).
- Throughout this essay, most of the highly salubrious settings are noted to lack heavy populations. Johnston does not necessarily state or argue this with his presentation, but he makes enough notes about this to have probably realized the relationship that exists between population density and disease.
- The “Indian Summer” of Canada is noted to be a November experience, related to which are the onset of epidemics of ague and typhus fever. First defined by Hudson Valley Quaker Doctor Shadrach Ricketson around 1804/6, this relates to the Nantucket epidemic from 1763 reviewed elsewhere.)
- Elephantiasis or “Barbadoes Leg” is noted, assigning a place of fame or origination to this disease. The related elephantiasis Graecorum or tubercular elephantiasis is noted for Bahia, where a hospital specializing in Leprosy was built.
- New Grenada has a place called “Mompox”. Diseases for this small region/country have very specific niduses defined.
- Peru’s unique putrid fever is called “tobardillo”.
- Bolivia topography defines three regions, three climate types, suggesting three epidemiological regions.
- On page 48, in the section on Yellow Fever, Johnston notes the discovery by several medical geographers, but in particular Jörg (probably Eduard Jörg, see this google books LINK), claiming that “Among causes hitherto little adverted to, but which by some authors are held to be essential to the production of this fever, is a certain degree of density of the population.” Johnston adds to this environmental requirement, elevated temperatures.
- One page later, he mentions the elevation requirement for yellow fever in Xalapa. A common argument has been that the Aztec fever epidemic Matlazualhuatl is a yellow fever, but Johnston’s note suggests this is most likely not the case (see page 53 for more on fever and elevations)
- The other epidemic summaries for cholera, the plague and typhus review the history and provide a little more of an updated viewpoint on each of these diseases for this particular year; elevation plays an important role in preventing their overland diffusion. Latitude-related temperatures also serve as barriers, for example by preventing typhus from infecting the Hudson Bay forts.
- The Cretinism-Goiter discussions are interesting, to say the least. Leprosy and Pellagra, etc. have interesting geographic distributions, the causes for which were hard to describe, but probably due to different microbial causes which were then unknown to Johnston and most in the field of medicine.
- At the time Johnston wrote up this speech, military physicians and epidemiologists related to military activities were paying very close attention to the climate, place and disease. My page on Aitken’s work with disease mapping illustrates this quite well. His map was developed based on Johnston’s map and observations and was published about 15 years later. Johnston’s section on the Army and The Navy reiterate many of Aitken’s observations, which Aitkens probably made, interpreted and then published separately from any conclusions he knew about that were drawn by or published in the works of Johnston.
……………………………………………………………………………..
Link to Original Article: 1856 – AKJohnston_Transactions of the Epidemiological Society of London