November 2013
Monthly Archive
November 30, 2013
Posted by Brian Altonen, MPH, MS under Uncategorized
Comments Off on Two new ways of disease mapping using GIS are put to the test, 2003 and 2013
See on Scoop.it – Medical GIS Guide
(View) Persons reviewed
Brian Altonen‘s insight:
Ten years ago I produced the first effective series of maps documenting a probable nidus or nest for West Nile disease in New York. A cluster of positive testing hosts (crows) was identified and surveillance traps set to determine where the disease had become a part of the local ecology. This proved for the first time the ability of the local setting to support the vector for this disease, making it possible for a new series of cases to erupt the following spring.
These maps were produced using a combination of ArcView 3.2 and Idrisi32 software in order to intergrate DEMs, aerial photographs, Satellite Imagery, NDVI (AVHRR), and NLCDs into the typical land use GIS data sources that were available.
The above product of this work was demonstrated at a number of meetings and conferences during the next 4 years.
Recently I tested and evaluated the new zeemaps.com mapping program available as open source (free) on the web.
I recently used this tool to document much of the surveillance work I carried out during the earliest years of west nile surveillance (http://www.zeemaps.com/view?group=751431&x=-73.464156&y=41.710832&z=8).
This site is very easy to use and has the potential of being a valuable GIS for use by managed care programs trying to understand the potential applications of their Big Data.
Due to PHI and HIPAA, I recommend its use for evaluate the use of services, clinics, lab offices, providers, special service agencies and such. For surveillance/epidemiological purposes, it can be used to define culturally-specific high risk areas, or to monitor health around the region, to document and encode specific disease behaviors for use by peers, and for evaluating services and cost by region around particular primary care facilities.
Aside from the availability of ZeeMaps as freeware, the ease of its use and the possibility for adding any data ranging from public health information leaflets to self-defined datasets is what makes this GIS attractive. Individuals can use it to locate meeting places and schedules for self-help groups, or to chose their specialists by visualizing their office locations in relation to public transport.
As always, HIPAA and PHI have to be kept in mind when institutions are using this tool to advertise these qualities of their healthcare program.
Agencies currently testing this freeware are applying it mostly as an information source for use by patient populations. It is used to define the locations for meeting important personal health care needs and to locate allied healthcare service providers.
See on www.zeemaps.com
November 29, 2013
Posted by Brian Altonen, MPH, MS under Uncategorized
Comments Off on CLASP | Charting Progress for Babies in Child Care | 15 Policy Recommendations | Promote Access to Early, Regular and Comprehensive Screenings
See on Scoop.it – National Population Health Grid
Brian Altonen‘s insight:
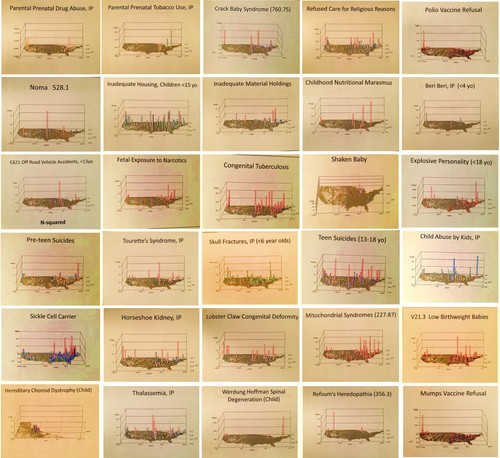
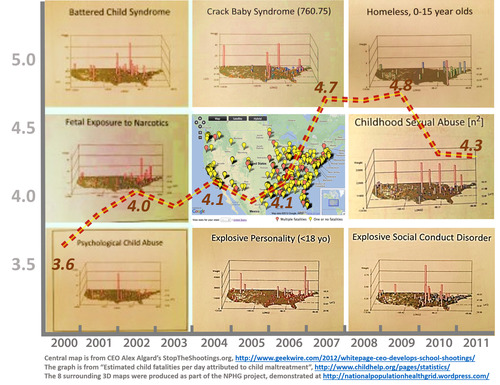
The most recent recommendations for improving childcare include a number of more aggressive prevention programs. With big data (EMR, EHR, etc.) underway to becoming an essential part of managed care, the newest options available to us now make it possible to identify and monitor hundreds of E- and V-codes, ICDs, HICLs, and CPTs important to child care and prevention on a regular basis.
This method of managing a large population of children enables us to initiate reviews of the most underrepresented childhood conditions, rarely evaluated over the years. Due to automated systems managing the frequent evaluation of data, the least researched, and infrequent to rarest of medical conditions can be monitored and mapped extensively for the first time.
See on www.clasp.org
November 26, 2013
Posted by Brian Altonen, MPH, MS under Uncategorized
Comments Off on Hexagonal Grid Analysis
See on Scoop.it – National Population Health Grid
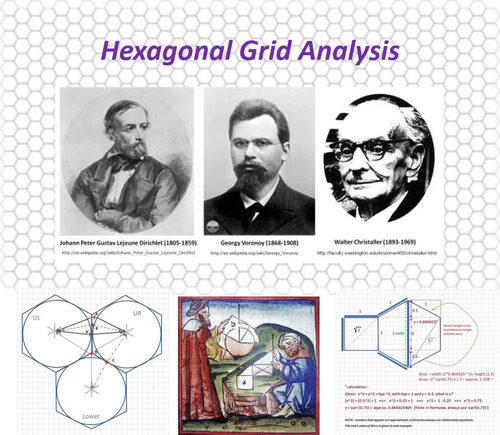
In terms of potential spatial errors, hexagonal grids are 26% less like to produce spatial error than the square grids we normally use to model disease and statistically analyze our rests. The reasons we continue using this less accurate technique relate mostly to our lack of understanding of the underlying math, and a lack of incentives for change.
When health and disease are being measured, accuracy is always one of the most important qualifiers or disqualifiers of our work. This change in paradigms will produce more accurate outcomes, and in the long run, result in more effective healthcare services.
Brian Altonen‘s insight:
The recommendations of grid mapping people and natural resources, and the use of Theissen polygons, extend back to the 1840s when they were promoted by German medical geographers. Russian and they British geographers added to these method, perfecting them by the early to mid 1900s.
Today, we are most familiar with square grid techniques. But the use of hexagonal (beehive) grids reduces the potential spatial error (mathematical misrepresentation) from approximately 43% to just 17%.
The NPHG methods I present utilize square grid mapping techniques. My hexgrid method, produced in 2003 for the Oregon Statewide Chemical Exposure and Risk Mapping project, is reviewed on the page I linked to the above illustration. It is my most frequently visited blog page, with the tools needed to understand this math downloaded by about 1/5th of the visitors.
See on brianaltonenmph.com
November 26, 2013
Posted by Brian Altonen, MPH, MS under Uncategorized
Comments Off on National Population Health Grid
See on Scoop.it – Episurveillance
Promotion of a New Disease Mapping Technique — Innovation at its Best.”
See on nationalpopulationhealthgrid.wordpress.com
November 25, 2013
Posted by Brian Altonen, MPH, MS under Uncategorized
Comments Off on Some West Nile Sites
See on Scoop.it – Episurveillance
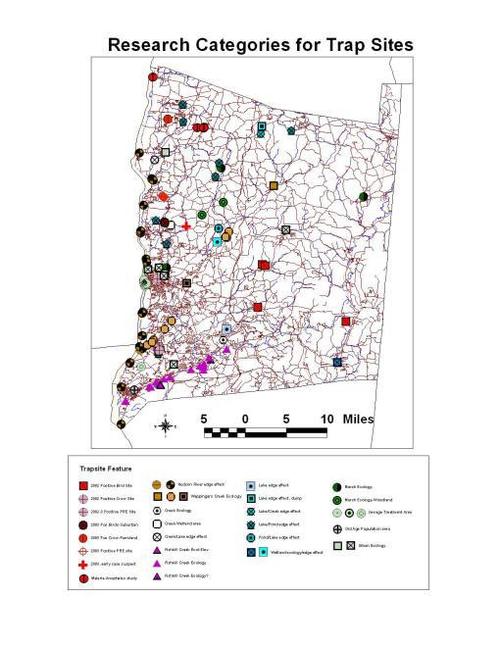
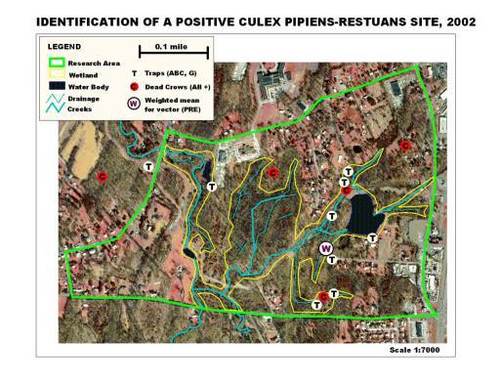
An impressive 3 year study of the ecology of West Nile Ecology using GIS for Spatial Disease Research and Surveillance
Brian Altonen‘s insight:
The various maps I produced for west nile research during its first 4 to 5 years of penetration into the U.S. are depicted by the following map’ The pins on this map serve as links to the images/maps provided about each of the points, areas or regions reviewed.
http://www.zeemaps.com/view?group=751431&x=-73.573955&y=41.991774&z=10;
Aside from standard ArcView basemaps and TIGER files, these maps utilized remote sensing, landsat imagery, NLCD, NDVI, DEMs, seamless government base maps, raster imagery, aerial photography, field mapping activities and surveillance, GPS and numerous ArcView Avenue extensions.
Field sampling techniques of point, grid and transect nature were used, including elevation base transect work. Grid analyses, density analyses, spatial analyses add-ons were employed. Ecological and population density reviews were developed. Host-vector spatial distributions/density were evaluated. Temporal trapping histories were reviewed. Species-vector relationships and trap types were documented, dead host birds positive and negative testing were evaluated.
A very large vector swarm late in the year (October) was evaluated.
A handheld photosensor was used to evaluate the relation of sunlight penetration through tree canopy cover to ground surface, in order to realte this to overall species types and densities captured at these traps.
late in 2002, aerial photos were used to predict/define positive testing site features and the likelihood for return of a positive testing vector the following Spring (it returned, which proved that local species carriers could exist and survive the overwinter).
Field analyses and GPSing were used to develop the site ecology, water, canopy and trap information for a positive testing human case of unknown origins. A DEM analysis of a creek floodplain and ravines was used to document species in relation to elevation.
The two major GIS options were used to produce both the vector and raster products.
This work later resulted in my receiving an award for this presentation of several of its components in 2006.
See on www.zeemaps.com
November 20, 2013
Posted by Brian Altonen, MPH, MS under Uncategorized
Comments Off on Using GIS for Administrative Decision-Making in a Local Public Health Setting – Europe PMC Article – Europe PubMed Central
See on Scoop.it – Medical GIS Guide
“Using GIS as a tool to determine where clinics can be placed to maximize access to care is particularly relevant for primary care services associated with ongoing changes to our health-care system, especially in light of the Patient Protection and Affordable Care Act of 2010. Therefore, GIS may serve as a tool to aid decision -makers in strategizing clinic placement and managing the forthcoming demand on health-care resources.”
Devon Taylor, Valerie Yeager, Claude Ouimet, and Nir Menachemi.
From article at http://europepmc.org/articles/PMC3314082/reload=0;jsessionid=Z4XdvuJoks8vnPUBUzlL.38)
Brian Altonen‘s insight:
GIS. New technologies, new resources, new methods.
How are Obamacare and GIS related to each other regarding the history of managed care?
See on europepmc.org
