See on Scoop.it – National Population Health Grid
In terms of potential spatial errors, hexagonal grids are 26% less like to produce spatial error than the square grids we normally use to model disease and statistically analyze our rests. The reasons we continue using this less accurate technique relate mostly to our lack of understanding of the underlying math, and a lack of incentives for change.
When health and disease are being measured, accuracy is always one of the most important qualifiers or disqualifiers of our work. This change in paradigms will produce more accurate outcomes, and in the long run, result in more effective healthcare services.
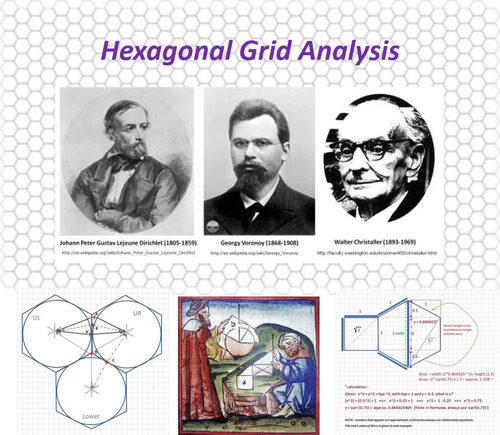
The recommendations of grid mapping people and natural resources, and the use of Theissen polygons, extend back to the 1840s when they were promoted by German medical geographers. Russian and they British geographers added to these method, perfecting them by the early to mid 1900s.
Today, we are most familiar with square grid techniques. But the use of hexagonal (beehive) grids reduces the potential spatial error (mathematical misrepresentation) from approximately 43% to just 17%.
The NPHG methods I present utilize square grid mapping techniques. My hexgrid method, produced in 2003 for the Oregon Statewide Chemical Exposure and Risk Mapping project, is reviewed on the page I linked to the above illustration. It is my most frequently visited blog page, with the tools needed to understand this math downloaded by about 1/5th of the visitors.
See on brianaltonenmph.com
