August 2015
Monthly Archive
August 31, 2015
Posted by Brian Altonen, MPH, MS under Uncategorized
Comments Off on GIS IN THE WORKPLACE FOR HEALTH & MEDICINE – A SURVEY

It has been nearly a year since I last pushed this survey I produced, focused on GIS and the health care profession. My focus is on managed care, and whether or not it can become a part of a big data population health enterprise program that I am a part of on the east coast.
As a PhD student, my dissertation planned focuses on the potential applications for GIS to Managed Care (MC), and what barriers have prevented GIS from becoming a strong part of the MC system, like it has for separate agencies devoted to population health, disease surveillance, even market analysis for healthcare facilities and agencies.
[REF: Survey Links]
Sourced through Scoop.it from: brianaltonenmph.com
Prior to my PhD enrollment several years ago, I developed these two surveys on Medical GIS. They are still active. If you are interested in GIS and Managed Care, please visit the following pages to take one or both of these surveys. The purpose is to see how leaders, management and staff are trying to implement spatial population health surveillance systems around the country.
The general survey is at https://www.surveymonkey.com/s/HZ7MH7Q
The MANAGED CARE [MC] version is at:
https://www.surveymonkey.com/s/V5THRFQ
See on Scoop.it – Medical GIS Guide
August 9, 2015
Posted by Brian Altonen, MPH, MS under Uncategorized
Comments Off on Record 108 contract Legionnaires disease in New York

The number of people diagnosed with Legionnaires disease has risen to 108 as America’s largest city suffers from a record outbreak of the form of pneumonia, authorities said Saturday. No new deaths have been reported on top of the 10 announced earlier in the week and officials say the outbreak is now on the decline. To date, 94 people have been admitted to the hospital with the infection since the outbreak began on July 10 in the south Bronx, the poorest section of New York state.
Sourced through Scoop.it from: news.yahoo.com
Working in the heart of New York City right now, some thoughts about the nature of what is happening with Legionnaires makes me wonder how the press and people are going to deal with this.
It is worth mentioning that I am perhaps two steps shy of feeling much concern for my developing this disease. First and foremost, I use my "sense" of health and especially immune health (mostly subjective assumptions) to keep these concerns at a minimum. Legionnaire’s erupted in my medical school during my first year there, in 1982; I did not catch it then why might I catch it now? May I add, this reasoning is identical to what I used to perform my field surveillance work around known houses with cases of West Nile inside; the purpose of being there was to map out the ecology of that setting and evaluate the species of vectors and determine if they were carriers. The second reason I had was even more pinpoint–all of the cases I investigated then involved people who were much older than me . . . and therefore textbook cases.
Everyday, I take a train past on of the hot spots for the most recent New York City Legionnaires outbreak, and may have even traveled to one or two of these sites as part of my work.
But seeing the big picture of what’s happening in the immediate one to two block area, around a potential outbreak nidus, and seeing how many people travel those streets and enter those buildings each and every hour, I find it amazing to think that anyone could actually design a model to accurate predict the diffusion activity down to the small area spatial level. That’s what makes spatial epidemiology as exciting as it is and formula writing the big brainteaser that it is.
Taking a break at lunch, I counted about ten thousand people coming in and leaving a less than one block area in lower Manhattan per hour. Therefore, it makes sense to guess that this is a place where an infectious disease could very easily come in.
But exactly where the infectious person goes once he lands on Water Street is a different story. He or she could head to a hospital in the Bronx by taxi or subway, the many local tourist sites, the 911 monument, to times square, or to a small clinic north of Harlem by bus or company transit because that is where he or she works. How and where a disease will actually diffuse away from the Old Slip is anyone’s guess.
What’s also important here is to realize that is how Valentine Seaman thought when he was trying to map yellow fever out in 1799 or 1800, following its repeated return in early October. Seaman thought his disease had to be either locally airborne or came in by crew and passenger and/or by rotten foodstuffs and stinky ballast water.
So, based upon Seaman’s observations, applying this same logic to Legionnaire’s makes no sense–or does it?
The large air conditioning facility is the suspected culprit in this case–aerosolized water particles being spread about a facility. But how can such an event commence almost simultaneously in multiple facilities? Is there another commonality to these places and their people, be it environmentally or ecologically (human ecology that is)?
Once again, that question has to be asked by modern New York epidemiologists–is the disease being spread by people or air-water effects. The locations point to people. The pattern suggests an aerosol nature. The nature of the facilities point to the role or human transportation in all of this.
Relating all of this back to GIS–with GIS, we cannot make as accurate prediction for the cause and spread of Legionnaire’s as we would like. We would have a hard time predicting this outbreak, had we the foresight to think about looking this up months ago. But once it is there, we have a place to begin our spatial prediction modelling routine.
Fortunately, we can develop a very accurate model on how a disease can behave once it has erupted, and in retrospect why it is where it is.
See on Scoop.it – Episurveillance
August 6, 2015
Posted by Brian Altonen, MPH, MS under Uncategorized
Comments Off on Applying GIS to Managed Care Quality Improvement Programs
Childhood Preventive Care Topics for utilizing a 2005 Medical GIS research methods, with examples of results for several 2009 to 2013 test runs The above is an example of how national population h…
Sourced through Scoop.it from: brianaltonenmph.com
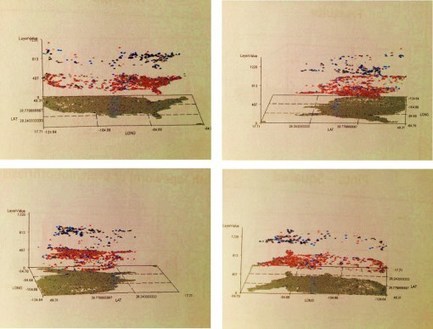
This three layer map I produced for my study of diseases amongst the elderly. On the top are parts of the US where two types of elderly care related mental health ICDs are found–one American and the other traditionally Asian. The middle layer depicts the Asian culturally linked illness on its own. The first layer depicts background mapping data overlain by the US case history of this mental health condition.
These three layer maps are easy to produce, and have the additional value of being useful for mapping a very unique three-dimensional dataset gathered only in urban settings–this can be used to depict people within buildings, with each layer depicting one of the floors of the building.
There are a few places in the country where this kind of mapping is powerful. The most obvious example for me is the outbreak of heat stroke and exhaustion cases several decades ago in Chicago. Another use pertains to V-code and E-code claims for such events as domestic abuse, crime and drug use for high rise buildings set up in low income areas. Occupancy of a building can be evaluated using this building. Outbreaks due to contagious disease may also be mapped.
The recent outbreak of Legionnaire’s reminded me of the value of this algorithm. In large bulding settings, where a disease is suspected to be generated by the local environment setting, you can use this procedure to illustrate in three dimensions the cases that are reported.
This type of mapping uses non-GIS software to be produced, and common formulas to generate the algorithm. The value of that algorithm is detailed more extensively at my site nationalpopulationhealthgrid.com.
See on Scoop.it – Medical GIS Guide
August 1, 2015
Posted by Brian Altonen, MPH, MS under Uncategorized
Comments Off on Human smuggling ring dismantled in South Texas
SAN ANTONIO (AP) — U.S. Homeland Security investigators dismantled a South Texas ring that illegally smuggled thousands of immigrants across the border from Mexico and on to other parts of the state — often tucked in small, dangerous truck crawl spaces.
Sourced through Scoop.it from: news.yahoo.com
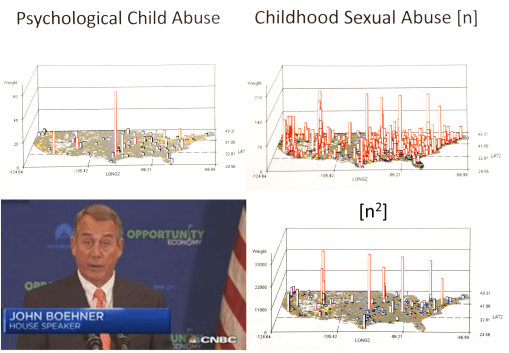
This is in fact the surface of a much greater social problem that exists in Texas. Some of the most useful findings that studies of V-codes, E-codes and ICDs demonstrate pertain to preventable human behavior and cultural and poverty-linked diseases and health issues. In this NPHG study, pathways leading form Mexico into Texas also brought into this country many other controversial health problems, such as communicable disease, zoonotic diseases, illegal drugs, and a host of very unique health related matters. In the n-squared image displayed here, notice the small town in Texas at the Tex-Mex border. It is very indicative of the main route taken by kids into this country. It is also where the greatest amount of physical and sexual abuse of teenagers prevails. This may be due to a number of reasons, but two of the most commonly cited ones are teen age prostitution and "domestic servant" contracts.
See on Scoop.it – Medical GIS Guide
