
INSTRUCTIONS
This Excel File contains one active worksheet with cell formulas for several different systems (50 x 50, etc.). These values were then pulled into ArcGIS/ArcView as a text or comma delimited file; once the points are generated you choose Select All, and then Save as ShapeFile.
[Please Note: Due to popularity of this spreadsheet and several requests, the SQL and SAS versions for this are in process of being tested and proofed for posting and should be completed in March 2012. Anyone looking for a Masters Thesis should consider writing the ArcGIS sql, avenue extension, or the likes for this and post it at ESRI’s site once you graduate.]
This spreadsheet was used to produce the x and y values for grids with predefined numbers of rows and columns (a process hard to regenerate or duplicate).
The charts display the layout of the points generated (for testing and trouble shooting formula problems).
Addition instructions and explanations will be developed later, and will probably be added to this page as well as included in the Excel File.
CAUTION IS ADVISED
- If you are good with interpreting excel cell formulas, download this file.
- Right click on filename then Download it or Select Open to new Windows and then Download.
- Downloading and then opening it for use on your PC is preferred of course.
- Make a back up copy before opening.
- Also, be sure to hit Enter or Return when clicking out of the cells on an Excel sheet with active formula cells, to avoid messing up the formulas.
- The 50×50 grid has a problem with the formula not yet identified and corrected–the cells, descending vertically in rows, appear twice as wide as they should be (damn all those “()” paragraphs!)
- There may be other versions of this Excel to later be added. (I recall developing a predefined cell area formula series, such as for 0.25 sq mi cells)
- These work best with equal area projection mapping with data bearing small length-area units, such as state-plane coordinate systems working in meters or feet
Hexagonal Grid Cell Excel File
Please leave some general descriptive information about yourself if you want (no personal names), such as institution, location, GIS background, student status, project this is being applied to, work or teaching responsibility, etc., in the comments box below.
For Downloading: Right Click over the following link, select Open in new window, then select download when the prompt appears. Or simply click on it and go through the same processes to Open on a New Windows Screen, and then save it onto your PC or laptop. (Try not to open it up directly on the screen while in the htmls, this could lock up your system.)
.
.
.
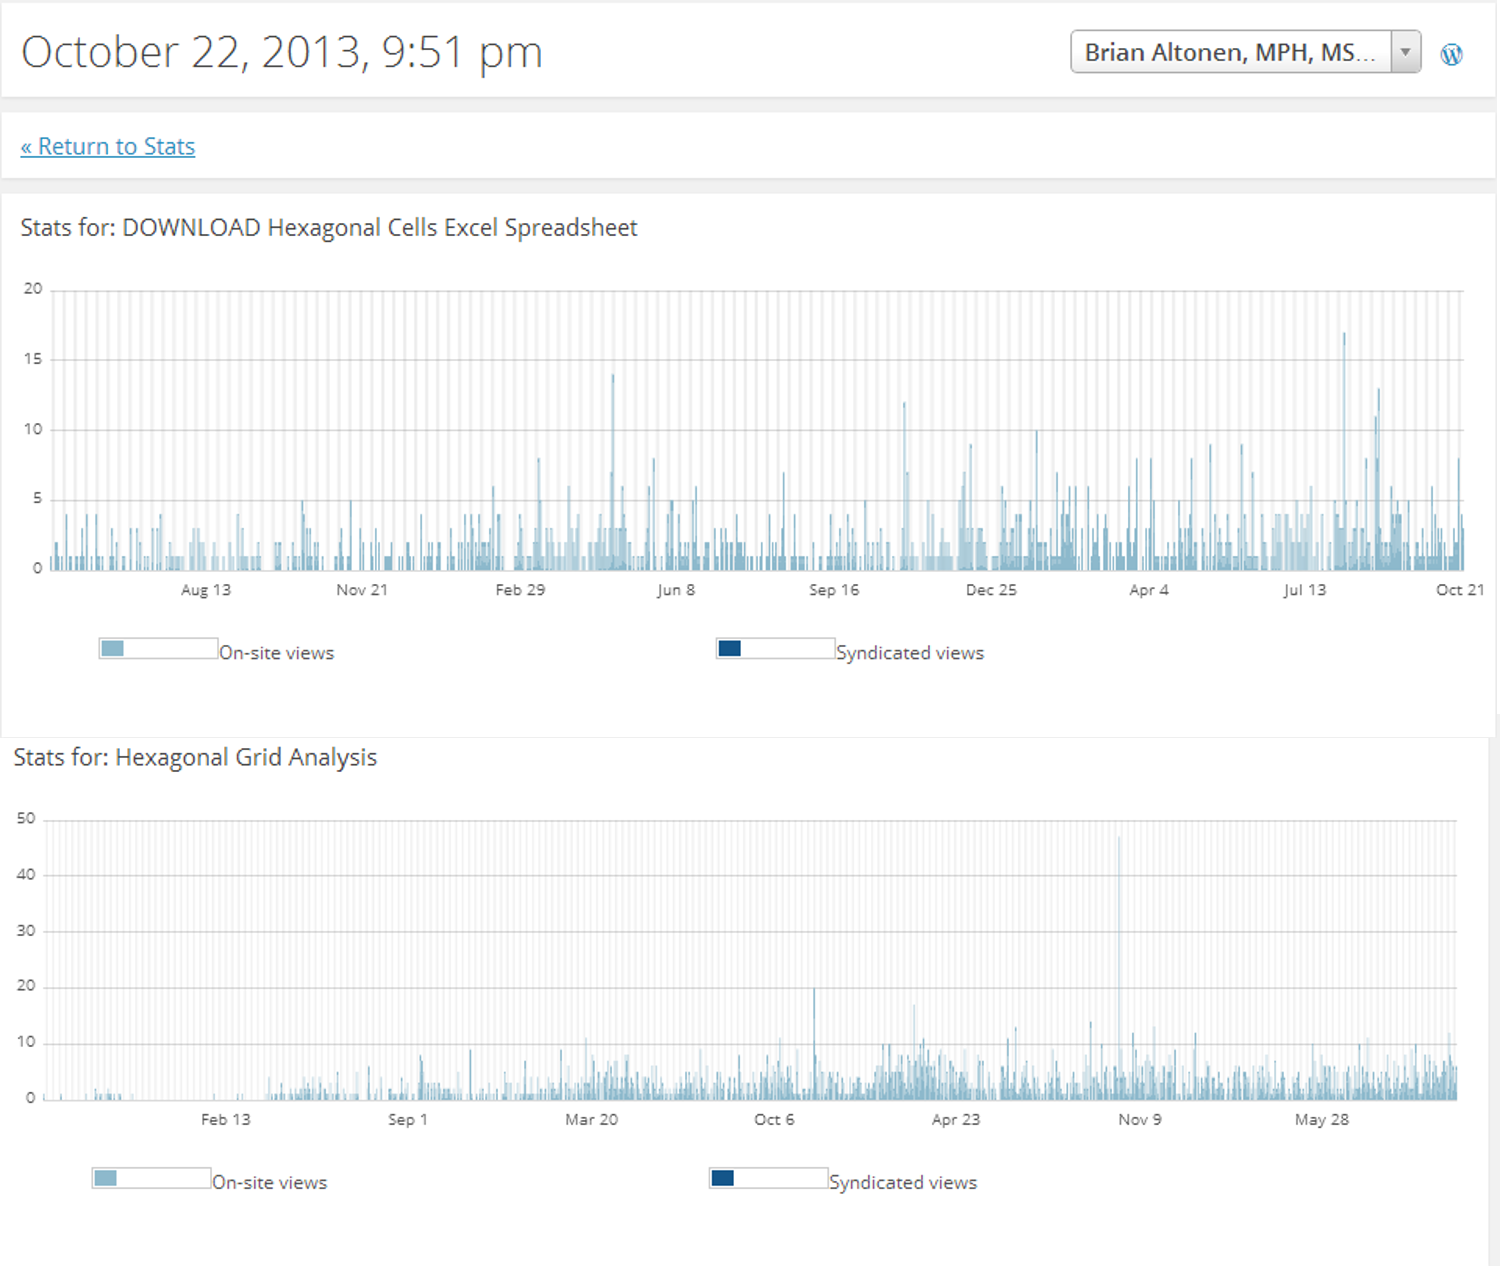
There has been a considerable amount of use of this excel file. One particular ESRI page that caught my interest is in the ArcGIS Forum, a page on Creating and “Moving Window” in ArcGIS. This page is http://forums.arcgis.com/threads/60238-Creating-a-quot-Moving-Window-quot-in-ArcGIS.
The following are the recent stats on the use of this page and the page which described the theory to my methodology.
If you experience any problems or have questions, feel free to voice them as well in the comments box below.

June 18, 2012 at 2:21 pm
The blog post was a great read, thank you so much for making the spreadsheet available to download. I’ve just graduated from Uni and am moving forward into a GIS post graduate course. I’m currently working for a Government Agency in Canada as a summer student.