The hierarchical diffusion of the 1832 Asiatic Cholera Epidemic, from Canada to Upper and then Lower New York
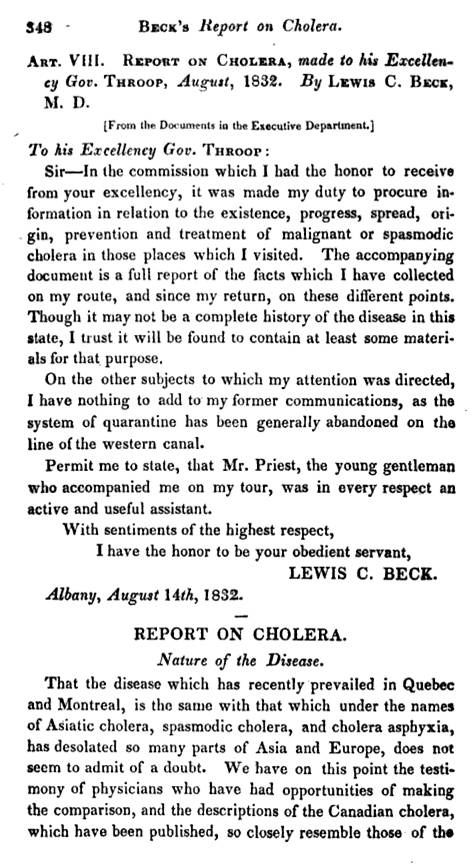
The following article about the 1832 Asiatic Cholera epidemic in New York by Lewis C. Beck, M.D., President of the New York Medical Society, was a formal report to the state regarding this highly fatal epidemic disease. This form of cholera demonstrated some behaviors that made it distinct from the older, more traditional forms of cholera noted throughout the medical books and journals. For one thing, it demonstrated seasonal behaviors that were unique. For another, it produced a different form of diarrhea that was very white, and rice-like. But its most important difference was its very high fatality, which more than likely spurred on the use of epidemiological statistics now with much more significance, comparing this new form of cholera with the more traditional forms of cholera more commonly seen.
The name usually given to this new cholera was malignant cholera. In the New York region it was differentiated with the name Cholera asphyxia. Previous forms of “cholera” such as cholera morbus and cholera infantum were debilitating and sometimes fatal, but only effected one to a few people at a time. They usually did not result in increasing numbers of deaths over the next few weeks day like the new cholera. In the severest cases, Asiatic cholera could cause dozens of deaths with a town of city, hundred of deaths within a large urban settings. The percentage of fatalities for Asiatic cholera was high, sometimes reaching thirty percent of those taken ill. A much more obvious observation about these cases was how many of the deaths could be linked to a single person who was the cause, an initial case or focus which in turn was often linked to a specific place that gave rise to the epidemic. But the most important observation about Asiatic cholera, this time made by Beck, was the tendency for this disease to cause the largest number of fatalities in the most densely population towns and cities before impacting the smaller communities. This important observation led Beck to write the following about malignant cholera.
Whenever it has prevailed to any extent, the infected city or village appears to become a centre from which the disease is communicated to different places in the vicinity.
What scientists, epidemiologists and physicians were able to conclude about Asiatic cholera in turn came as a direct result of their experiences with yellow fever years earlier. This first epidemic of Asiatic cholera reached the United States 7 years after the most recent in a series of recurring epidemics of yellow fever had taken place in 1821/1822. Like the yellow fever, this cholera showed a seasonality to its emergence in cities serving as important international shipping harbors, but Asiatic cholera tended to display its largest numbers much earlier in the year than the yellow fever, as early as April in the southern states like Louisiana and May or June across the Great Plains. Asiatic cholera’s peak tended to be around June, for yellow fever this peak was in late summer, early fall around September of October.
Unlike yellow fever, the disease did not remain close to the ocean shores and ports according to the disease maps being generated. Asiatic cholera was found to migrate quickly inland, deep within the interior of North America and the United States, impacting towns and cities previously untouched or minimally impacted by yellow fever epidemics. In part this was due to the improvements in the shipping industry, but more importantly this more rapid mechanism of spread was due to the direct association people had to the development of new victims. Yellow fever required a vector to be transmitted, an additional ecological requirement that medical topographers were not yet aware of. Asiatic cholera on the other hand only needed water to be spread, and denser amounts of people, for person to person transmission to take place. Like for yellow fever, water was an abundant natural resource, but in this case it did not have to be openly present so as to serve as a place for mosquitoes to survive. This water could be in any form, and in many different places, including water and earth closet (latrine) facilities and even places where groundwater gathered unexposed to the atmosphere, but rich in the Vibrio cholerae promoting alkaline water setting, where the organism could survive and even replicate perhaps between victims.
What is most important about Beck’s article is that he gave us important information about time and place for this event. His focus is on Canada and New York, to demonstrate the route this disease took to enter the United States. However, this entry by way of a northern route instead of a southern route worked against the seasonally based latitudinal theory for cholera, stating it should have been heading northward before making its way into the state by way of the big cities along the Atlantic shoreline like Savannah, Charleston, Washington D.C., Philadelphia and then finally New York and Boston. Such was not the case however, which we can tell as Beck provides us with details about place and date in his report. With Beck’s report, we can try to interpret this epidemic the way Beck and most other physicians for the time did, in terms of the temporal-spatial behaviors and flow patterns of the miasma that was causing these deaths.
In spite of effectively documenting the travel of cholera into New York via a north to south route, Beck remained strong convinced in the same theory that most other physicians believed in. Beck’s philosophy was that Asiatic cholera occurred due to local topographic and/or climate and population features. From what we know today this is completely wrong, and hard to believe was the case. It is hard to understand how and why physicians missed the message that the clues presented by Beck offered them regarding how cholera came into this country. Beck outwardly states that there is no likelihood the cholera could have been imported, using the mental map his provided by this article to prove his case.
Since Beck didn’t actually produce a map depicting his claims, the same is being done here instead. These maps tell me/us about the behavior of this disease spatially as physicians like Beck witnessed its march into and across this country for the first time. Some of Beck’s conclusions drawn in this article are real, the rest imaginative. This is a normal consequence of mapping diseases. When we draw up a map detailing a migration pattern, we unknowingly allow for some human bias to set in, some judgements to be made, some prejudices to influence how we formulate our conclusions. Another famous geographer who defined the contemporary hierarchical diffusion concept, Gordon Pyle, as he developed his way of analyzing and then describing epidemic disease profiles and behaviors. An obvious research question for this page thus follows: Do Beck’s findings comply or conflict with Pyle’s way of envisioning this disease’s various states of its behavior?
.
***********************************************************
TABLE OF LEWIS BECK’S FINDINGS
.
| Sequence
(work in process) |
1832 date | Location(UC=Upper Canada; LC = Lower Canada) | Description
c=cases, d=deaths or died |
| 01 | June 8 | Quebec, LC | |
| 02 | June9 | Montreal | Emigrant on steamboat Voyager, from Quebec |
| 02 | June 10 | Montreal | Another from the same vessel (Dr. reports earlier cases in April and June 1) |
| 03* | June 11 | La Prarie, 9 miles from Montreal | Lasted until the 27th; 55 cases, 24 d. |
| June 12 | St. Johns | Until July 6th; 59 c, 11 d | |
| 01a,02a | June 13 | Fort Miller | Emigrants from Quebec on June 8 and Montreal June 9; on canal boat; 35 Welsh immigrants, 3d. |
| 02a | Plattsburgh | Emigrant from Montreal June 8, arr. Plattsburgh June 9. Disx related to filthy part of village. | |
| 02b* | Burlington, Vt | Emigrant from Montreal; followed by 2 more | |
| 02c | June 14 | Lake Champlain | Lake Champlain Steamboat Phoenix, d.Whitehall June 15th; Was in Montreal June 12/13 and visited hospital. |
| 02c | June 15 | Whitehall | |
| 04 | Fort Ann | Along northern canal; on boat with Welsh immigrants | |
| June 16 | Prescott, UC | ||
| 02d | June 18 | Mechanicsville | d. after 18hrs; left Montreal June 11, d. 16th |
| Ogdensburgh | Canadian French inhabitant; leading several others to get ill | ||
| June 19 | Berthier, LC | ||
| La Chine, LC | |||
| June 20 | Brockville, UC | ||
| Kingston, UC | Lasted June 20-27th, 165 c, 52 d | ||
| 01b | June 21 | Rouse’s Point, on Lake Champlain | Emigrant from Quebec; died June 22 |
| Cornwall, UC | Several cases followed | ||
| June 24 | Chateagay River mouth | 12 d | |
| York, UC | Several cases | ||
| June 26 | Port Hope, UC | ||
| 02e | Erie, PA | Emigrants from Montreal | |
| June 27 | Cogbourg, UC | ||
| June 28 | Bradford, UC | ||
| June 29 | Chambly, UC | ||
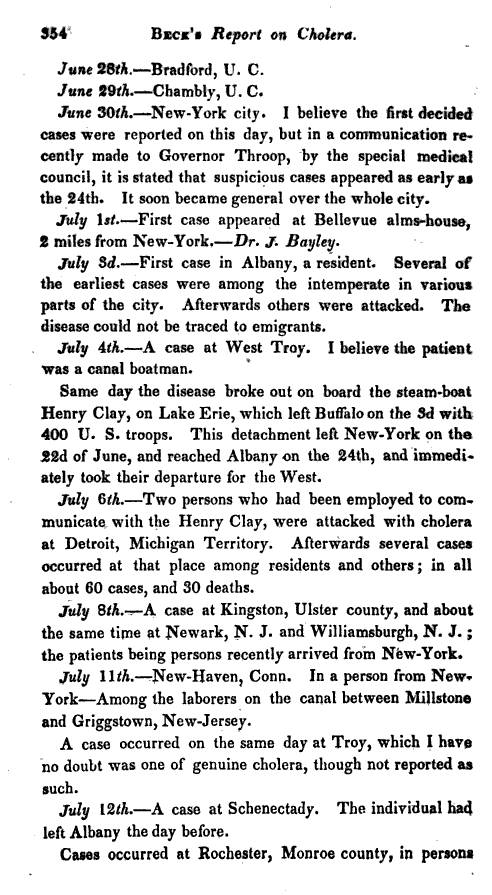
| 05 | June 30 | New York City | First cases (Suspicious cases as early as June 24th); impacted full city |
| July 1 | Bellevue Almshouse | Bellevue Almshouse, 2 miles from NYC | |
| 06 | July 3 | Albany, NY | No emigrants noted; followed by others |
| July 4 | West Troy canal boat | Canal boatsman | |
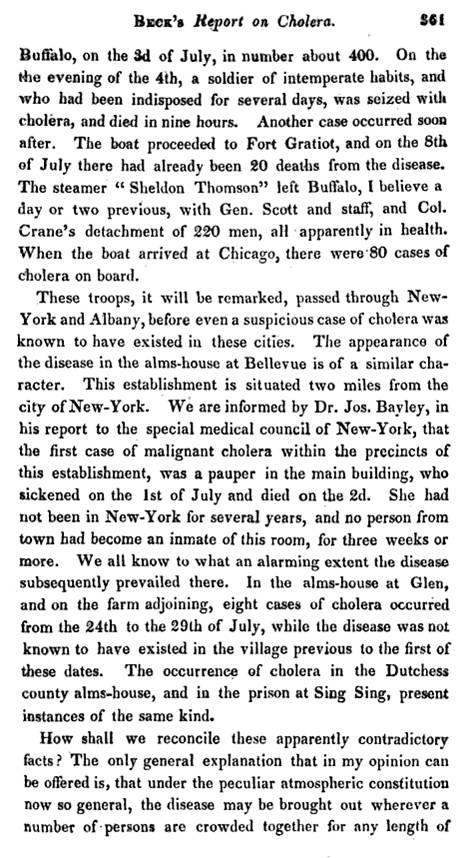
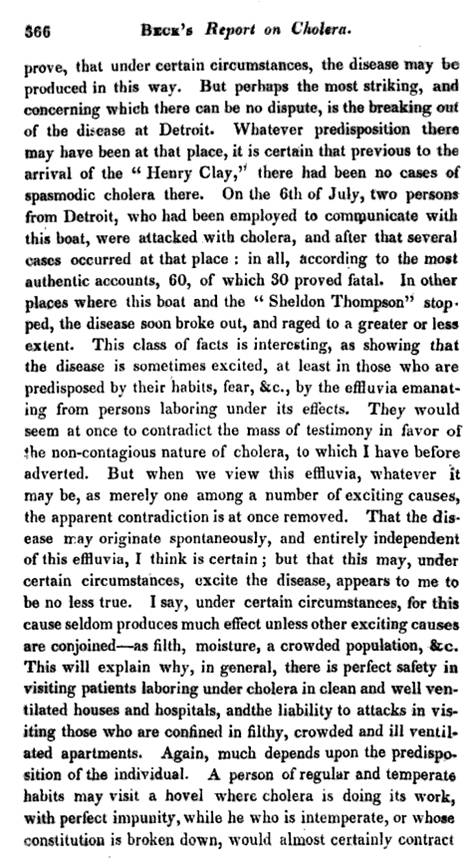
| 07 | Lake Erie | Steamboat Henry Clay, leaving Buffalo on 3rd with 400 troops; which came from NY on June 22, reaching Albany June 24, then headed west. | |
| 07a | July 6 | Detroit, Michigan Territory | 2 persons working on the Henry Clay; followed by several cases, totaling 60 c, 30d. |
| 05a | July 11 | New Haven, Ct | Person from New York; canal laborer working between Millstone and Griggstown NJ |
| 07? | Troy NY | Possible case | |
| 07b | July 12 | Schenectady | Individual from Albany, leaving July 11 |
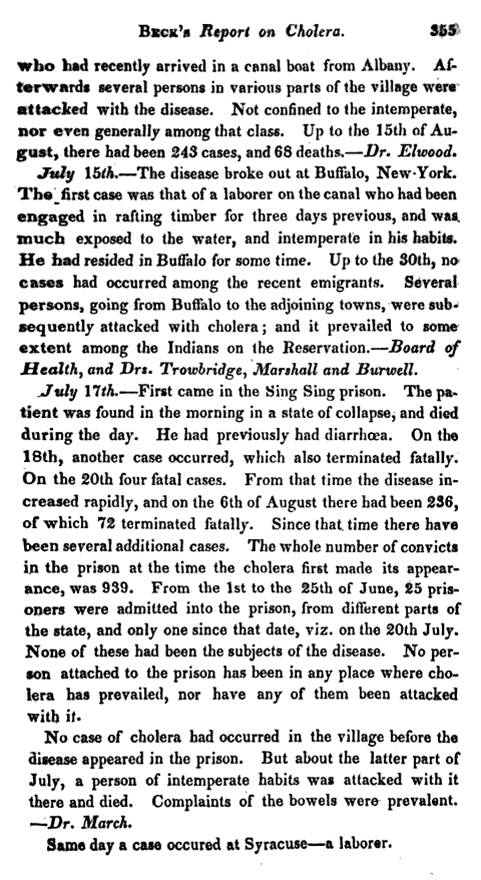
| 07c | Rochester, Monroe Co. | Individuals in canal boat from Albany; village residents then attacked; no parts of village stood out as high numbers; by August 15th, 243 c, 68 d | |
| 08? | July 15 | Buffalo, NY | Canal laborer, rafting timber for three days; was a Buffalo resident; no cases until 30th, then cases spread to adjoining towns, including an Indian reservation |
| 09 or 05/06b | July 17 | Sing Sing Prison | Patient/Prisoner died that day; Another case on July 18th, then 18th, then 20th, all fatal. By Aug. 6th, 236 c, 72 d, out of 939 convicts. June 1-25 had 25 admits from around the state; none also got the disease by July 20th; village cases ensued, with 1st death in late July |
| July 17 | Syracuse | laborer | |
| 05c | July 18 | Brooklyn | People had been in NYC |
| July 19 | Lockport, Niagara Co. | Child, followed by father; both died; a few cases followed | |
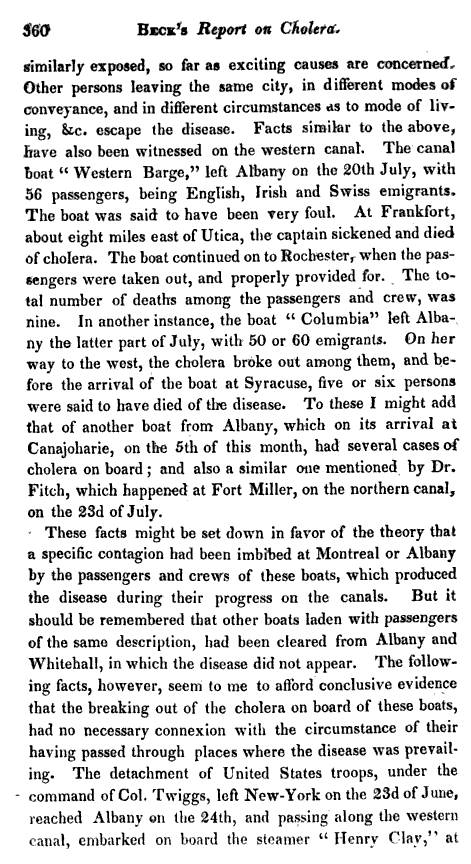
| July 22 | Frankfort, barge on canal | Western Barge on the canal, 8 miles east of Utica at Frankfort, disease broke out on board. Ship left Albany on 20th, 56 passengers (Engl, Irish, Swiss) Captain attacked first, who died; several others died. 9 fatal cases total. | |
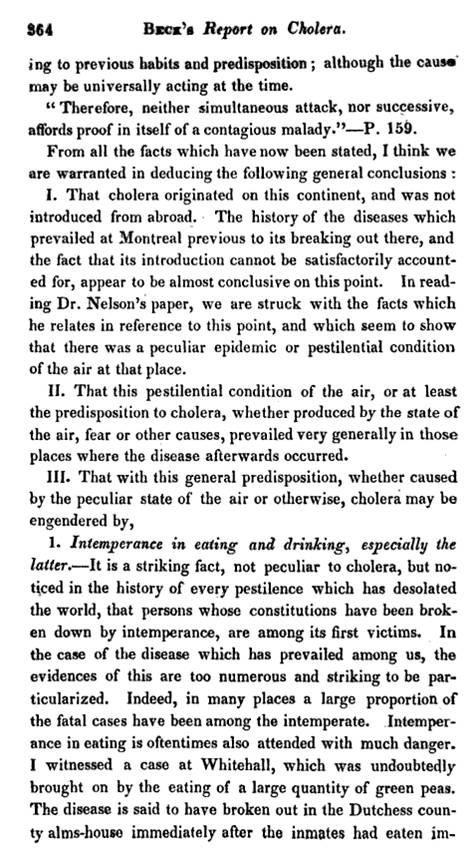
| July 24 | Johnstown almshouse, Montgomery Co. | Almshouse, then adjoining farm was attacked; |
.
Table of Beck’s Findings
**********************************************************
.
.
[MAPs]
Hierarchical diffusion defined!
Chances are, this is probably not the first time a medical cartographer mentioned something as basic as what we today refer to as hierarchical diffusion, an idea made popular by Gerald Pyle in the 1970s. With disease transmission studies, it is common sense to relate an illness to people and places to determine how that disease was spread and how fast it is capable of migrating to new places. Still, we have to give Pyle some credit for having found an application for the hierarchical diffusion concept that seems so basic to economic geography studies, but new in terms of how it can be related to medical geography and predicting disease patterns. As some recent writers on disease mapping have stated, without mentioning Pyle by name necessarily, such a model for predicting and mapping disease patterns can appear too subjective at times. Yet most of these writers still use it, and will usually acknowledge that the technique is still very important and useful for research. (Although what of medical geography and cartography, qualitatively and quantitatively, truly does not bear even a little bit of subjectivity or personal conclusion drawing?!)
However, it seems likely that, like many discoveries made in medical geography, we forget those earlier discoveries that were made with time. The same appeared to take place with the spatial relationships detailed by Beck in 1832, and redefined by Pyle nearly 150 years later. This follows a similar fate for Benjamin Rush 1786 version of the 1890s to 1960 sequent occupancy theory. Each of the original theories and its link to the theorists would soon be forgotten once the use of this way of modeling became no longer necessary. For Beck’s theory, it was the replacement of the zymotic theory for disease (coverage of this is work in process, on another page) by the bacterial theory around 1891 that led to the ultimate demise of his temporal-spatial interpretations of how certain diseases behaved. Once the bacterial theory came about, we no longer had to pay attention to the climate, weather, soil patterns, gelogical patterns, or hills, mountains and valleys when it came to interpreting a disease. We only had to know the patient and his/her physique and pathogenic microorganism.
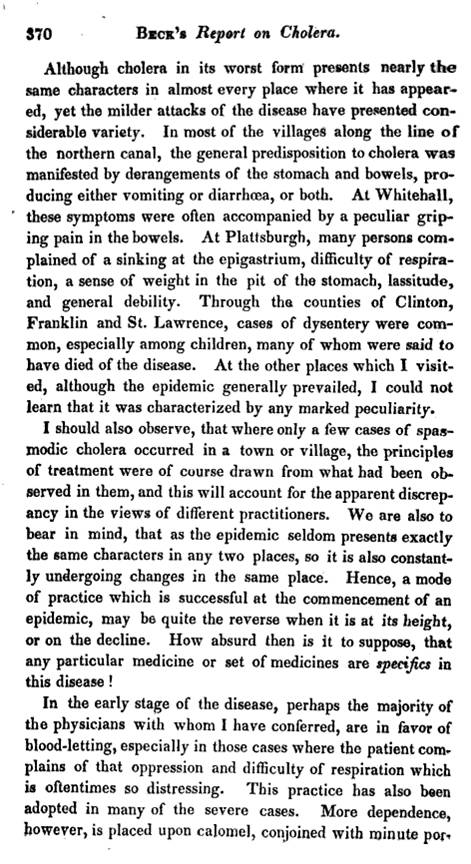
Unfortunately, it is also true that the bacterial disease set scholars and medical professors off on a path so far into another direction regarding disease ecology and microbiological research that many of the older skills of disease mapping were removed from the profession, and of course how we produce the modern maps of disease and medicine. Older disease maps are usually not simple, straight forward illustrations seen in today’s academic references. Older medical and disease geography maps appear more like a work of art that was designed to make a point, and facilitate your ability to clearly remember that point, even if that point appeared politically biased at times (like the 1832 miasma map of the Parish of Bethnal Green in the London area).
[Insert Bethnal map?]
It ends up that Lewis Beck wrote his article with the idea that we could mentally map his cases and share that map with his readers. With this mental map, Lewis Beck received confirmation of his philosophy for the time, even though today we interpret these points for places and dates very differently than he did, in retrospect, knowing the true behaviors of this disease pattern. Neverthless, Beck’s map enabled him to make an important, unique discovery–a diffusion process in which disease progresses from economic settings such as cities and from there is spread to smaller, more rural communities.
On page 256, following the July 24th, 1832 note, he makes two very important points:
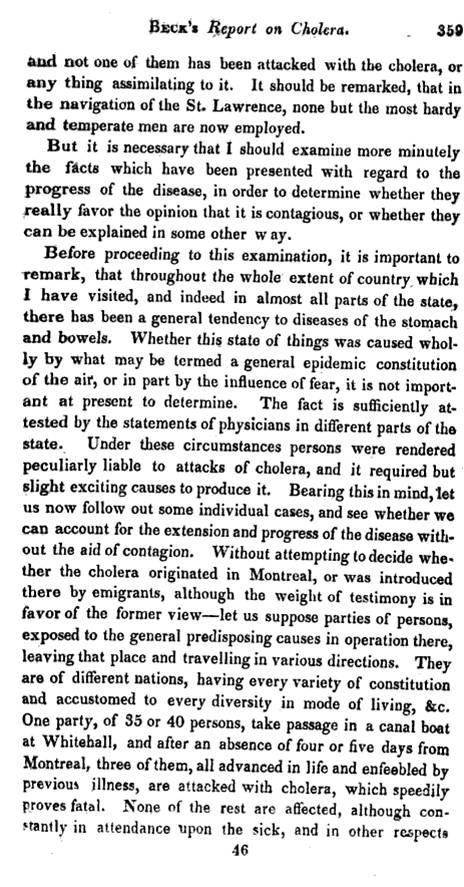
Whenever it has prevailed to any extent, the infected city or village appears to become a centre from which the disease is communicated to different places in the vicinity. Thus from Montreal and Quebec, as centres, it gradually spread into various parts of Canada, following the course of emigration. Cases also appeared on the line of our Northern Canal, and at different points on Lake Champlain. In most of the villages on the Canadian side of the St. Lawrence, and of Lake Ontario, where the tide of emigration has been uninterrupted, the cholera has occurred; while on the American side, where, since the breaking our of the disease at Montreal, all communication with the Canadas has been stopped, not a case has been reported except at Ogdensburgh, and one or two other points on the St. Lawrence, where the intercourse could not be so completely interrupted.
In the first sentence, Beck acknowledges hierarchical diffusion pattern of this disease diffusion process. This portion restated . . .
Whenever it has prevailed to any extent, the infected city or village appears to become a centre from which the disease is communicated to different places in the vicinity. Thus from Montreal and Quebec, as centres, it gradually spread into various parts of Canada, following the course of emigration.
He then notes the differences in cases that occurred on the two sides of the river, suggesting that the United States had taken more effective precautions than Canada by engaging in more effective surveillance and quarantine practices. This portion, restated:
. . . since the breaking our of the disease at Montreal, all communication with the Canadas has been stopped, not a case has been reported except at Ogdensburgh, and one or two other points on the St. Lawrence, where the intercourse could not be so completely interrupted.
Canada probably had just one major route of entry–the Saint Lawrence Seaway. The United States had several routes of entry, several along the St. Lawrence, as well as at least one from its southernmost port harbor in New York City. The isolated cases that pop up in the listing he provides us with infers this likely outcome.
Still, to Beck, Asiatic cholera did not come into this country by these two major shipping routes. Nor did it travel along the canals and other rivers or roadways due to immigration and emigrants related data. This mistake developed due to this attention to immigrants and emigrants in his definitions of cases. It seems likely that because several places lacked any cases develop that could be linked to in-migration, this entire theory about its cause had to be thrown out by Beck. This behavior is confirms by his text, and illustrated above in the table with the entry pertaining to Albany dated July 3rd. He was unable to find such a link for emigrants causing the disease in Albany, a highly populated town with many ships coming into the ports. This mistake is identical with mistakes made by two other famous writers in historical epidemiology–Benjamin Rush and Valentine Seaman, each regarding their perspective on the causes for yellow fever epidemics in 1793 and 1797. Both felt it was not due to foreign born causes, brought in by ships.
If we take a closer look at Beck’s notes in respect to the later maps produced for disease, we get a better idea of the differences in philosophy then prevailing for Asiatic cholera versus its predecessor Yellow Fever. The general impression about yellow fever is that it was diffusely distributed along the southern to mid-eastern coastline of the United States and along the shores of the Gulf of Mexico, including those if its island communities. The yellow fever pattern displays as a very unique region, with every small area possible within its narrow band of distribution potentially impacted by it. This is a very diffuse, miasmatic way of depicting the distribution of this disease, and demonstrates lack of human population requirements.
On the same map, there is no area at risk depicted for cholera. Just the migration routes it followed are noted. This implies a very direct link to people and populations, and as we see from the routes taken by migrating people and intercontinental ships, there is more of a hierarchical or Pyle’s Type II nature to the behavior of Asiatic cholera. Whereas yellow fever was transmitted by means of a yet-to-be discovered animal, the mosquito, at the time this map was made, the cause for Asiatic cholera was also not known and yet did not lead cartographers to define a clear and concise area of impact as seen for yellow fever.
[Johnston’s Map and others]
Why the difference?
Yellow fever was mostly blamed on the environment, such things as climate and weather, and the absence or presence of marshes and putrid water sources. Asiatic cholera was blamed on people, populations and human behaviors, and was mostly related to sanitation practices and living conditions. Thus on the maps published depicting these two diseases, yellow fever is presented as an areal epidemic feature and Asiatic cholera as a linear migration route. Close-ups published on Asiatic cholera behavior retain this linear diffusion pattern, like the map depicting the linear migration of cholera through Ireland in 1866.
[Map]
.
************************************************
ARTICLE
.
.

.
.

.

.
.
.

.
.
.
.
.
.
.
.

.
.

.
.
.
.

.
.

.
.
.
.
.
.
.
.
.

Leave a comment