
“. . . the solutions to our problems lie outside the box.”
Aviation Week & Space Technology, July 1975
.
What is profiling?
Profiling is comparing the shape and form of something, or in modern sociological terms, the behavior related ways and means of someone engaging in a particular activity or series of behaviors or living patterns. In the case of the individual, a physical use of this term refers to reviewing and analyzing the physical form.
Silhouette profiling is when you try to evaluate the form of a person’s face, or body. Measures are taken of the various features of a particular individual and then compared with some standard measure of the same. This may be used to identify someone passing through an airport for example, by comparisons the bumps and valleys in the facial profile with a known, documented and stored profile of the same individual. If the two match by a certain percentage, then the two individuals are considered the same or similar, though not necessarily identical.
It is these minute differences that we need to learn about. But how do we identify these minute differences?
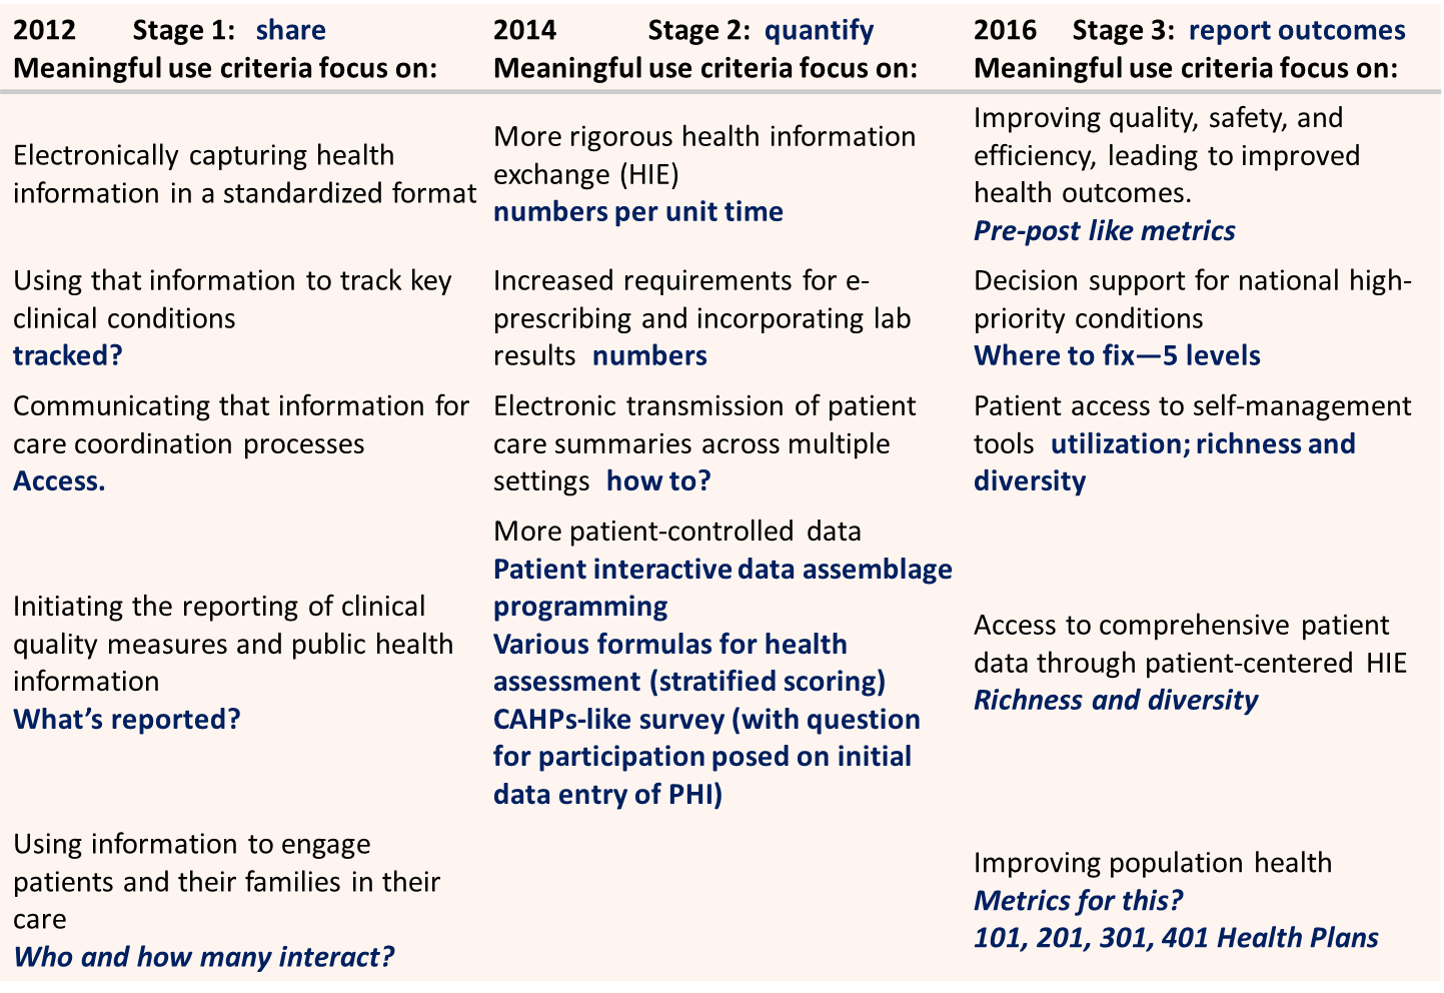
The Managed Care Plan and “Meaningful Use” Stages of Reassessment (Source: TMG advisory notes)
What is population health profiling?
Population health profiling is a technique I developed for analyzing large numbers of people. Population health profiling evaluates any of a number of health related factors for a given population, for a specific group of people and their subsets, and uses this to define future health care plans, target populations in need of change, and when and where these changes can be implemented. With population health profiling, the meaningful use criteria defined with the new managed care plan can be put into place long before requirements need to be set, and applied to incrementally changing the overall goals, procedures, testing, implementation, evaluation and success of the new program developed.
Currently (as of March 2013), very few managed care plans have specific goals in mind to meet these long term criteria. Managed Care plans tend to follow the bell curve in terms of self-imposed goals to reach and self-defined purposes for reaching those goals. When a Managed Care director is approached and asked about what goals have been established to demonstrate meaningful use, the chances are that director, along with most of the people in charge of making these decisions, have not actually sat down, had a discussion on meaningful use meaning and strategies, and come up with goals that should be set or plans that need to be put into place to demonstrate solid, undeniable proofs that meaningful use goals have been met.
In past years, the way goals have been met is by retrospective means. This method is very much like engaging in goal setting for the year, by defining these goals based on whatever accomplishments have been made during the past 12 months of activities. Companies sometimes use this technique to engage in end of the year reviews of employee performance. The employee reviews his work history, determines what the goals were or probably were at the time, describes how these were reached, and then the manager of that individual reviews this and if he/she agrees with the goal-action-outcomes defined, signs off on that particular accomplishment. A common way to define barriers in QIA/PIP reporting is to monitor the population performance, then look back at the past year’s meeting minutes, monthly newsletters sent to patients, past year’s program performances, complaint line reports, problems with patient compliance with office visits, lab activities and results, use these bad “behaviors” to define the barriers, and list out ways to try to eliminate them. Population health profiling tells you two things about a patient group that enables you to more specifically define the types of interventions that may need to be taken.
First, population health tells you where the masses exist with regard to demands for care, theoretical need for care, and any risk-defined need for care that might exist.
Second, population health defines your target before, instead of after, and even though it is used to define next year’s series of plans, is most likely to be an accurate predictor of whom your target population is due to the high unlikelihood for change in the population pyramid counts per age, in general. (This could change due to the new annual penalty fee program in place with the new health care system).

For the above pyramid, female is on the left; male is on the right
If we take a look at the above age-gender distribution of the insured and their dependents, we find several relationships that help to define programs for given programs. This population pyramid illustrates why the standard 5 year age group method fails to provide us with enough insight for the development of accurately targeted, highly efficient intervention programs.
The ages illustrate above are for a standard or “average” pre-Medicare population, each family of which has a family head who is fully employed and health insured. Notice the age peaks for everyone under 18 years of age–newborns, and 16-17 yo–and the “valley” at about 8 years of age, plus or minus one year. The next valleys, generally meaning insurance coverage, appear at 21-22 yo and perhaps around the mid 30s. Also notice male participation or case load is less than that for females in the 25+ yo age group, until 55 yo is reached. This is due to the traditional male-female spouse-child relationships that exist in our population: first, hired men who are married are more likely to include the spouse and children in their health insurance program paid for due to where they work; second, there are single parent parent-child relationships that have to be included in this distribution of male-female members, meaning there may also be slightly more females due to female employment coupled with that female lacking a spouse in need of coverage.
These two intergender relationships continue for the next two decades, resulting in many more women than men being noted in the medical records for an employed person/family until the age range of 50-54 is reached, as the two genders begin to equalize. We can visualize the approximately 2-3:1 relation of Female (left) to Male (right) as an indicator of types of services required at specific ages. Generally speaking, mother-child care needs have to be met as well as male spouse or father related health care needs, the latter often being compromised in order to better afford the first two family care requirements. The female needs during these decades include typical PCP visits as well as gynecology-obstetrics visits, certain quality of life specialty care visits (ocular, nutritionist, PT, etc.), and mother-child visits such as prenatal-postpartum care, well visits and immunization visits for the child, urgent/emergent care needs for the child, and preventive care visits for the child and mother, such as cancer or certain disease screenings. Of these activities or procedures, the male patients tend to engage only in periodic PCP related checkups (annuals, some even skipped), occasional chronic disease screening/early diagnostics visits (for family history concerns expressed by nuclear family/spouse), and urgent/emergent care visits (i.e. sports injuries, serious “cold”, flu or malaise, etc.)

Six older age diabetes complications (ICD9s): Neurological Complications of Diabetes (350.6), Diabetic Polyneuropathy (357.2), Diabetes Neurogenic Arthropathy (713.5), Peripheral Circulation Disorder (250.7), Diabetic Peripheral Angiopathy (443.81), Diabetic Gangrene (785.4)
At the age of 50, all of these activities begin equalizing between genders. Many physiological diseases with chronic disease forms of development history and behavior begin to kick in about this time, ranging from the very common obesity, hypertension, diabetes and heart disease conditions, to rheumatoid arthritis, COPD/asthma disorders, and complications brought on by lifelong illness. In the following illnesses, we see both the sex-based symmetry that some diseases display, versus the sex-related assymetry others display for obvious reasons.

Six unevenly distributed diagnoses, conditions, events by age/gender: Sarcoidosis (135.x), Psychogenic Constipation (306.4), Fibromyalgia (729.1), Finger Amputation (886.*), Non-compliance (V15.81), Organic Sleep Apnea (327.2)
.
Seeing the Elephant – Part 2
Evaluating health insurance businesses requires a detailed understanding of the population. This understanding has to be focused on the following aspects of a given population, for that insurance industry or industry type: age-gender one-year increments, small area/place specificity (neighborhood analysis for all members), and SIC grouping related comparisons. Companies not engaged in any of these three basic steps are simply not performing an sufficient HEOR (Health Economics Outcomes Research) type of program, and cannot use their data to perform accurate adjustments or make accurate predictions. Large area analyses (esp. states on up in size) are insufficient for these programs, which means that companies either have to either subcontract out their spatial analysis work or learn how to implement and adequate GIS as part of their HEOR/research program. To engage in the former places a company into a black box approach method, meaning the report from the subcontractor provide some useful information for engaging in interventions, but never details for companies to total picture, with the ability to easily go back and tweak the formulas and rerun them, several times a day even. Outside contracted work therefore is inadequate for time and cost efficiency when it comes to implementing a very detailed, highly focused HEOR program as part of the population health project.
This need for time-cost efficient GIS implementation is made even clearer by the use of the population metrics so far discussed on this page. Narrow age-gender bands of one-year increments enable one to target specific people at specific ages, and not result in financial losses accrued due to involving more people than was necessary, in an interventions mailing list for example. Narrow age-gender data also tells us the different age groups that might have to be handled for certain activities. There is one major age band for male smokers versus two major age bands for female smokers for example.
In the following reviews of working class with health insurance by the type of industries they are in, the following examples of a standard industrial classification [SIC] approach to comparing population groups came up with some very interesting results. SIC can be used to predict which industries are more likely to be in need of child care than others, and which are more likely to have larger amounts of chronic disease matters driving up the total costs. Some SICs have sizeable numbers of people who could udnergo preventive care activities, whereas other SICs lack people young enough to be so engaged, and so require palliative care and maintenance focused health improvement, quality of life events.

For the above, female is on the left and male is on the right.
Examples of questions that may be answered using the above method . . .
Question 1: Where does the most cost per patient exist in the above SIC examples?
(Highlight the area that follows using your mouse to read the answers)
[Answer: CSince cost usually increases exponentially with age, probably Oil/Mining, although Transportation and Utility are very close]
Question 2: Where are the greatest percent costs related to the health care of children anticipated?
[Answer: Food/Hospitality or Communications]
Question 3: Where are the greatest percent costs for spousal care (esp. wife) anticipated?
[Answer: Probably service industry]
In the course of my reviews of age-gender 1-year distributions, a number of research questions typically developed due to this methodology. The population pyramid approach to reviewing ICDs, V-codes, E codes all provide insights normally not seen in an evaluation of population health without mapping and pyramids being employed. The following examples of questions emerged following a simple review of symmetrical age-gender-patterns (some are more rhetorical in nature):

For the above, male is on the left and female on the right
.

The above renderings depict independent prevalence [IP] on the left (dark brown, goldenrod), and n of the right (male=blue, female=pink). The left slide series depicts chronic pulmonary disease distributions by age-gender, the right slide pneumonia, flu and avian flu. Intervention strategies are best planned with the age-gender differences in mind. Pneumonia risk and the need for vaccination for example continually increases with age after 45 yo, whereas the greatest risk for flu diminishes with age after 60 yo in terms of diagnosis, with greatest risk during last 10-15 years of working age.

Left Slide: Muscular dystrophy [MD] and cerebral palsy [CP] are two diseases with similar impact on quality of life, but with very different effects upon longevity. Older age patients with MD are in sizable numbers compared with younger age groups; the reason for the reduction in midlife cases n is uncertain. CP has obvious effects on longevity with patients reducing greatly in number after 40 years of age. A gender dyssymmetry appears on both: male cases and IP bear two peaks, one in the teens and one in the early twenties. Female MD patients have two childhood peaks, or no peaks at all. The recurring finding in degenerative cerebral function disorders, in particular mental retardation ICDs, is the male double peak-female one peak model. One reason for this universal patterns is culturally defined behaviors for care givers, resulting in delayed diagnosis with a goal of enabling social functioning to be test in younger boys who reach that self-dependent age or 18, with less of this sociocultural behavior involving younger women who reach 18.
Right Slide: Pulmonary Abscess is due to any of a number of causes, ranging from infectious disease history, to physical injury, to cancer, to adjacent tissue-organ related diagnoses. Pneumoconiosis is a disease of pulmonary function brought on by years of inhalation of solid matter, in particular asbestos and other sizeable dust particles; formally an occupational disease with middle age onset due to the work environment as a major cause and M>>F in terms of case counts, it is now mostly diagnosed in the later years of life due to domestic settings as its primary cause. Treatment protocols are very different for each due to these age differences. An evaluation for potential pneumoconiosis development carried out in the midlife to pre-retirement years may serve as a effective way to develop a cost prediction/cost reduction plan for dealing with this condition in the later care of these patients. Pulmonary Abscess management and prevention requires early age, mid age and older age programs focused on different disease causes, with a greater amount of focus placed on the young to mid-age population of males in the working class.

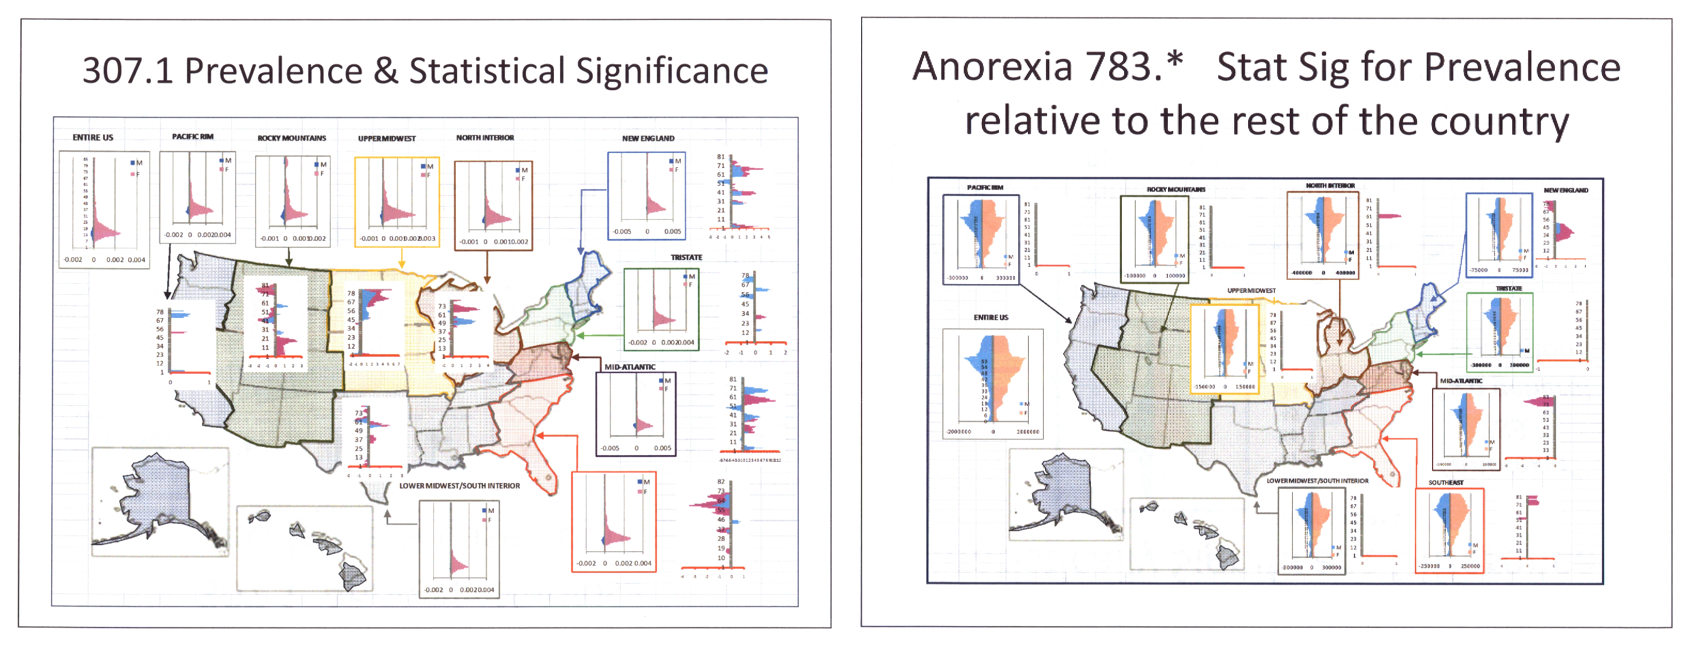
Counts and Independent Prevalence of two “Anorexia” diagnoses: Anorexia Nervosa, a cultural-social disease, and “Anorexia” or lack of hunger presenting as a secondary “symptom”.
.
Anorexia nervosa has a very unique age-gender-linked presentation. Its occurence peaks at a very specific age, mostly in females, pretty much ending in the mid-20s. The related diagnosis Bulemia then continues into the 20s and even 30s. The above regional map compares case distributions between regions. Based on the Statistical Significance peaks for Anorexia nervosa, the Rocky Mountains and perhaps Mid-Atlantic Regions depict peaks suggesting these two regions are more likely to experience more cases than the rest of the country. For Anorexia 783.*, stat sig suggests the peak region in the country for this condition is the New England area. In another study of chronic disease management in general, this region is also the “sickest” regarding the existence of higher IPs for most other prevalent chronic diseases in general (as an example, the ‘heart failure’ study outcome follows).


Leave a comment