December 2014
Monthly Archive
December 30, 2014
Posted by Brian Altonen, MPH, MS under Uncategorized
Comments Off on 2014 in review – and another great year!
The WordPress.com stats helper monkeys prepared a 2014 annual report for this blog.

Here’s an excerpt:
The Louvre Museum has 8.5 million visitors per year. This blog was viewed about 77,000 times in 2014. If it were an exhibit at the Louvre Museum, it would take about 3 days for that many people to see it.
Click here to see the complete report.
December 29, 2014
Posted by Brian Altonen, MPH, MS under Uncategorized
Comments Off on The Path of the Outbreak | Important New York Times Video
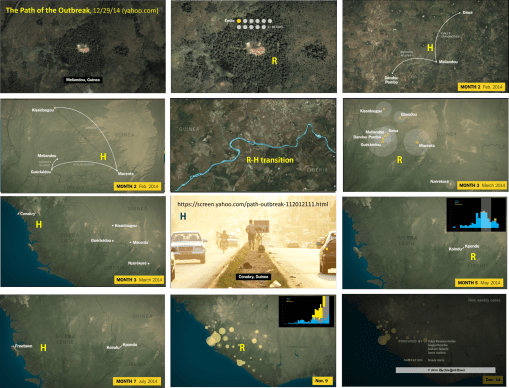
How Ebola spread during the first few months of the outbreak. R = radial diffusion pattern; H = hierarchical pattern or behavior.
Source: screen.yahoo.com
Using the mapping of Ebola provided by this NY Times overview of what has happened, we can see how radial and hierarchical diffusion behaviors effect disease diffusion patterns. This method of modeling also demonstrate how two other historical medical geography teachings–the sequent occupancy interpretation of a place, and transportation modeling–provide insights into predicting the disease pattern.
These events barely integrate any natural elements linked to Ebola diffusion once the disease erupts. These natural features may however remain present and active, although not predominant due to the epidemic outbreak process.
There is also the classical modeling of epidemics in Iceland produced about 50 years ago by British Geographers, that these notes can be related to. We see the Iceland outbreak events re-occurring on the maps provided in this NY Times video.
In medical geography, a important lesson I learned nearly 10 years ago from ESRI’s medical geography statistician was the role of area size in understanding a diffusion pattern.
Spatial analysis requires we repeat certain formulas over different levels of spatial resolution. We then determine at what are size the most sensible and useful prediction model can be developed. That critical spatial feature is defined by the transportation history and patterns of the people involved with an outbreak. Africa’s transportation process defines 30 miles as a limiter, noted in this NY Times video. For Ebola, this relates to when radial diffusion patterns (‘R’ in the above figures) end up being replaced by hierarchical patterns.
The transportation of the Ebola to towns and villages distanced from the nidus or nest is a product of these features, and represent early stage hierarchical diffusion behavior (‘H’ in the above figures). Like cholera and other diseases that erupt in communities due to poor sanitation, lower SES, poor living conditions, there can be this reversed hierarchical diffusion worth noting. The transportation of Ebola to local, regional hospitals is an example of this stage in "gearing up" the epidemic for a major outbreak. Transportation is the link in the change from radial to hierarchical diffusion patterns.
The first outbreak was expected to peak in March or April and then reduce to little or no more disease outbreaks. This didn’t happen however. Instead the early stage hierarchical diffusion processes had already taken place, setting up new regions for perpetuating the outbreak and keeping its organism alive and making the likelihood for continued diffusion possible. Small radial outbreaks ensued, involving neighbors and immediate family, and once again, hierarchical diffusion commenced, this time striking larger towns and cities (next step in the reversed hierarchical diffusion pattern).
As soon as larger cities are hit, and the rural/wilderness setting of Ebola has been left behind, this sets the stage for international travel. Due to the different forms of transportation and their potential speeds and distance of travel, introduction of any disease to a large urban setting makes it possible for hierarchical diffusion to commence to other countries on other continents. Thus Europe was stricken as well as North America, and larger economic centers were impacted.
Some other useful ways to look at this spatial behavior include the application of Christaller’s model, which focuses on economics patterns around major urban centers, and Theissen’s Polygon modeling, which when combined with transportation time-distance spatial relationships can be used to define the most susceptible regions to be attacked once a major urban center is impacted, such as Dallas, New York, Chicago, London, and Hong Kong. (I have some GIS pages posted on each of these two major spatial epidemiology topics.)
Again, it is also important to note that the US medical geographer and economist Gerald F. Pyle defined radial, hierarchical and mixed disease diffusion patterns based on this interpretation of disease spread as a by-product of commercial patterns and economic geography. I added to his model the notion of the reversed hierarchical pattern about 14 years ago, noting the role of SES, social inequity, poverty, and sanitation on disease diffusion patterns (the introduction of cholera into Irish settings in NY and IL, and into Kingston, Jamaica in 1849/50 were my lead examples).
Sequential Occupancy, a late 19th C geographic interpretation of how landuse changes when a region economically develops, relates to this in how it provides insight into transportation related impacts. (Sequential Occupancy is also my recommended replacement for epidemiological transition theory, since it is more precise in defining cause and effect.)
Earlier stages in regional economic development define the local technology, and as a result also impact how a disease can and will diffuse, and in which directions, at what speed. At the tricountry border of Guinea-Liberia-Sierra Leone, the use of early stage transportation (waterways) helped spread the Ebola, as noted in this video (‘R-H transition’ in the figures).
Parts of modeling disease spread are much like modeling water flow patterns along a river or traffic flow along the roadways heading towards urban regions. Spatial analytics makes it possible for specific routes to be predicted and then tested as soon as an outbreak happens.
Traditional epidemiological research focuses primarily on the natural human ecological events, but fails to fully take into account the economic geography like behaviors of disease outbreaks.
Every major transportation of this Ebola to a new location occurred due to hierarchical modelling human behaviors. The Reversed hierarchical diffusion behavior prevailed all throughout this past year of activities. Radial patterns defined mostly the local disease spread. Sequent Occupancy modeling shows us that diseases can follow a 125 year old economic geography way of modeling man and disease due to the lack of much change in human behavioral patterns, spatially or temporally.
This Ebola also behaved much like the Cholera of 1800 to 1873. With each new outbreak, it traveled much further in its diffusion process around the world, following Gerald F. Pyle’s diffusion model.
See on Scoop.it – Medical GIS Guide
December 27, 2014
Posted by Brian Altonen, MPH, MS under Uncategorized
Comments Off on An Argument for Earlier Ebola Outbreaks, ca. 1700
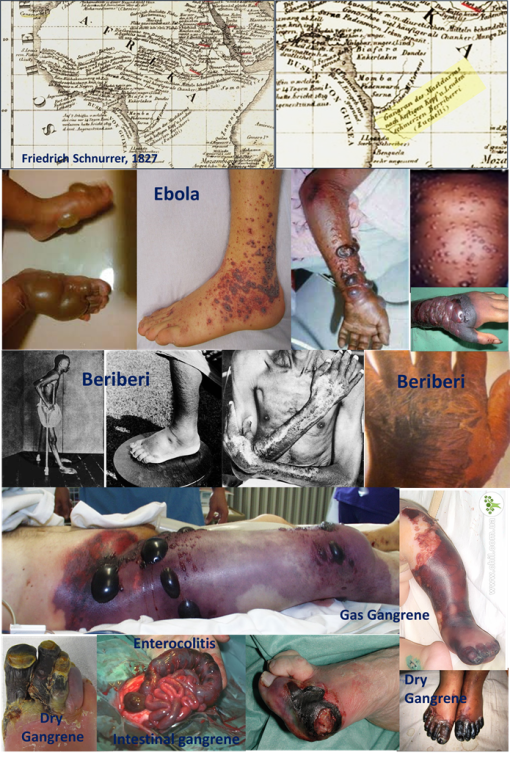
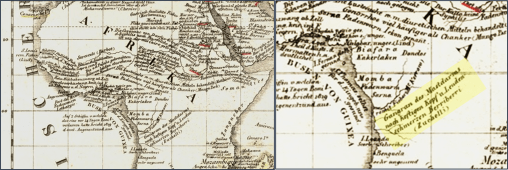
The sections of map are from the very first map of global diseases prduced in 1827 by Friedrich Schnurrer, professor in Oriental culture and history and headmaster of the theological faculty and chancellor of the University of Tübingen, Germany.
This section of Schnurrer’s map I extracted and enlarged is focused on the Congo River.
Along the right side of that waterway he scribed “Gangran des Mastdarms nach heftigen Kopf u lenden schmerzen Berriberri (Zuchelli)”–this roughly translates to
“Gangrene of the lower bowel (rectum/colon) after a violent or severe attack of pain to the head, loins & lower back [like] beriberi”
The account Schnurrer is referring to as “Gangran des Mastdarms nach heftigen Kopf u lenden schmerzen Berriberri (Zuchelli)” is an event first experienced by an early Protestant missionary in Africa, Antonio Zuchelli, who after a brief stop in Brazil in 1797 removed to Africa where he resided from 1698 to 1702 as part of the Protestant missions group (reference and links below).
He returned to Venice in late 1703, early 1704, and spent the next seven years writing about the experiences he had along the Congo River between 1698 to 1702. In 1712, these experiences were published as a popular "Viaggi e Relazioni . . . " (Travels and relations. . . ) account, entitled Relazioni del viaggio e missione di Congo nell’Etiopia inferiore occidentale, del P. Antonio Zucchelli da Gradisca, predicatore cappuccino della provincia di Stiria, e già missionario apostolico in detto regno ecc., consecrate alla sacra ces. reale maestà di Eleonora Maddalena Teresa, vedova del gran Leopoldo. (1712 ,a Venezia, presso Bartolomeo Giavarina, 4o, 438pp.)
This book covers Zuchelli’s missionary expeditions to five parts of the world. He traveled to Brazil and then Africa, making his way inland along the Congo, residing in what they called the Province of Sogno just south of Zaire (these missions go back quite a bit, see some of the links below).
Zucchelli remained at this place for several years, reported his experiences later in the ninth to thirteenth relations he published. Like most missionary reports, these writings were heavily devoted to the culture customs of the local inhabitants . Throughout this recounts are included descriptions of the nearby villages and kingdoms (countries) he traveled to and a description of the local economy and businesses utilizing natural resources, the local climate and ecology, and the various other cultures nearby with descriptions of their villages.
Zuchelli’s description of the people and the local health and disease matters wouldn’t again be matched in as much detail pertaining to Ebola-like outbreaks until the early 1800s, when a number of ships made it their goal to travel deep into the heart of Africa by way of the Congo River.
To understand the epidemiological history of these travels, it helps to understand how diseases were described and explained at the time. As much as possible due to the early Greek writings, climate was associated with disease, along with temperament, our physique, our activities, our diet and waters, the way we dress and follow our passions, the ways in which we keep our living and working conditions clean or not. On board ships, spending months on the waters, besides fever and occasional infectious diseases measles, our health depended upon our diet, and a poor diet resulted in scurvy and beri beri. But usually whenever a ship reaches land, these diseases pass due to an improved diet (fresh fruit and vegetables). Such was not the case at times along the Congo River, and the beri beri caused by poor diet and the body wasting away didn’t apparently ease completely upon landing. Instead, it re-erupted in its worst form, with the appearances of decaying skin and flesh, the forming of blisters, bleeding, and bubos worse than those of the plague.
The pictures in this set are of traditional, severe beri beri as well as the dry and wet gangrenes common to these settings, which to any physicians first seeing these outbreaks would resemble the other outbreaks he was already more familiar with. The Ebola of today resembles the beri beri and various forms of gangrene of the past (Zuchelli’s description is what led Schnurrer to classify it as a gangrene, following somewhat Erasmus Darwin’s disease classification tree of decades before).
Of course, there are many other forms of flesh destroying diseases in very wet and humid living settings. But what makes this condition unique is that it is just on the Congo River according to Schnurrer’s map, on the route to Zaire. Schnurrer fails to notes such a gangrene anywhere else on his map.
Later evidence for this claim based on Zuchelli’s writing and Schnurrer’s map can be found in the 19th century writings [next topic for this set or historical Ebola reviews].
There are two early 19th century voyages made by two British military captains that provide very convincing descriptions of the outbreak of this deadly disease. It would also be noted to emerge further north in the regions around Guinea, from where it is erupting today. This part of Africa was most important for slave trade of course, which may even describe how and why Ebolavrus managed to make its way across the central climate belt to parts of Africa well north of the Congo and the Equatorial Line.
Animal host migration can also be used to explain this migration, but whether or not such a trans-equator route was traveled back then remains uncertain at this point in the study.
*************************************************
For more:
see another of my blog pages on this– https://brianaltonenmph.com/2014/10/14/is-there-an-early-history-for-ebola-preliminary-review-says-yes/  ;).
See also: an NIH article and complete book chapter devoted to this map also available for review at: http://www.ncbi.nlm.nih.gov/pmc/articles/PMC2530995/ and https://www.academia.edu/909628/The_first_global_map_of_the_distribution_of_human_diseases_Friedrich_Schnurrers_Charte_%C3%BCber_die_geographische_Ausbreitung_der_Krankheiten_1827_
(For beginning reference, see in Google Books, https://books.google.com/books?id=ZS9xdc3IVrcC&pg=PA646 The encyclopedia of missions, by Rev. Edwin Munsell Bliss, — p, 646, listing of Protestant Missions writings, has Zuchelli, A[notonio]. Merkwurdige Missions- und Reisebe schreibung nach Congo. Aus dem Italienischen.
Frankf. a.M.. 1715.
For more on Antonio Zuchelli.
Antonio Zuchelli’s biography [in Italian] is at http://it.wikipedia.org/wiki/Antonio_Zucchelli
Relazioni del viaggio e missione di Congo nell’Etiopia inferiore occidentale by Antonio Zucchelli. 1 edition – first published in 1712 [openlibrary.org]
On the related missions in the Province of Sogno, see Black history writer John Coleman De Graft-Johnson’s important work from 1954. African Glory: The Story of Vanished Negro Civilizations. https://books.google.com/books?id=LY5Lmc-To7cC&pg=PA141
Early Missions
Hakluytus posthumus, or, Purchas his Pilgrimes: contayning a history of the Worlde in Sea Voyages and Land Travelles . . . By Samuel Purchas . ca. 1525 – . https://books.google.com/books?id=BAsWAAAAYAAJ&pg=PA456
The History of the Kingdom of Kongo. http://www.africafederation.net/Kongo_History.htm ("The Mani Sogno was the first Kongo nobleman to embrace the Christian faith.")
More contemporay renderings of this region: http://kwekudee-tripdownmemorylane.blogspot.com/2013/05/pre-colonial-african-kingdom-of-kongo.html
And on Google Maps: https://www.google.com/maps/place/Democratic+Republic+of+the+Congo/@-5.7565111,13.1358646,10z/data=!4m2!3m1!1s0x1979facf9a7546bd:0x4c63e5eac93f141
See on Scoop.it – Medical GIS Guide
December 26, 2014
Posted by Brian Altonen, MPH, MS under Uncategorized
Comments Off on Earlier outbreaks of Ebola?: Zaire/Congo River, 1816, Niger River, 1841
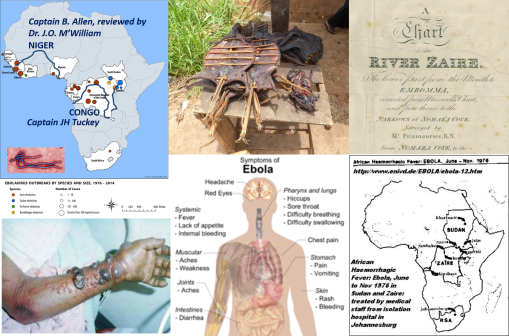
There are two important historical epidemics to note that are very similar to Ebola. The first took place in 1816 along the Zaire/Conga River. The second along the Niger River where it connects with Tschadda. These are both epidemic that began with fever outbreaks, but which led to a high fatality rate and had symptoms that demonstrate a unique form of internal organs deterioration that other fever epidemics do not normally present with. Fewer cases demonstrated the internal blood mass formations seen in the more contemporary outbreaks. The most resemblance between these two outbreaks are their dates of initiation, days until fever symptoms, speed of spread to their others in the teams, and time until death. Both were also colloquially termed “River Fever” These support my premise that the Ebola and some similar diseases have been around since they were first noted by the Portuguese missionaries in the 1690s. Both of these overlap with the geographic distribution that we currently are familiar with, and are consistent with the topography, ecology and human population features determining how this disease may be spread.
Two months ago I posted two pages in sequence about the possibility that Ebola struck Africa much earlier than first noted in current journal articles. This a re-posting of the first one of the two. (Expect more on this epidemic history research at a later date.)
The very first map of diseases of the world depicts a condition with all the symptomatology, appearances and high degree of fatality the current Ebola outbreaks now present us with. This map was produced by Friedrich Schnurrer, a professor in Oriental culture and history ( I review him extensively, with his biographies included, at https://brianaltonenmph.com/gis/historical-disease-maps/friedrich-schnurrers-charte-uber-die-geographische-ausbreitung-der-krankheiten-1827/ ).
Schnurrer’s map was dated 1827, and includes a description of a disease unique to the Congo, and no other parts of the world, described as “Gangran des Mastdarms nach heftigen Kopf u. lenden schmerzen Berriberri (Zuchelli)” (see also my own blog page with this– https://brianaltonenmph.com/2014/10/14/is-there-an-early-history-for-ebola-preliminary-review-says-yes/ ).
An NIH article and complete book chapter devoted to this map also available for review at: http://www.ncbi.nlm.nih.gov/pmc/articles/PMC2530995/ and https://www.academia.edu/909628/The_first_global_map_of_the_distribution_of_human_diseases_Friedrich_Schnurrers_Charte_%C3%BCber_die_geographische_Ausbreitung_der_Krankheiten_1827_
One of the issues or concerns about reviewing historical medical writings on epidemics is whether or not the researcher is able to accurately identify the diseases writers refer to, especially prior to the 1860s. This is when the differentiation of shared symptoms such fever, changes in skin color, and sweating were still questionable. Physicians often described these symptoms in relation to just their fever cycles, and the place where the disease happened. Topography and climate were just as important to identifying a disease as its exact symptomatology. A ten or fifteen year difference in the references selected to make these identifications can easily result in misidentifications.
Still, we are very fortunate when it comes to trying to define “Gangren des mastdarms” on Schnurrer’s map. Due to its uniquely deadly nature, and the symptoms it produced in its victims, Ebola can be differentiated from something as basic or simple as the various forms of malaria, yellow fever, and the flu. Ebola was deadly, and caused symptoms such as a blackening of the skin prior to death, ulcerations, a rotting away of flesh. Schnurrer’s map refers these symptoms for this disease (loose translation: Gangrene of the colon/rectum/lower intestine followed by heavy head & lumbar pain, beriberi), which occur only along the Congo River, that emaciating symptom, blistering with some resemblances to gangrene, the destruction of abdominal flesh, occurring over just a few days, leading to death.
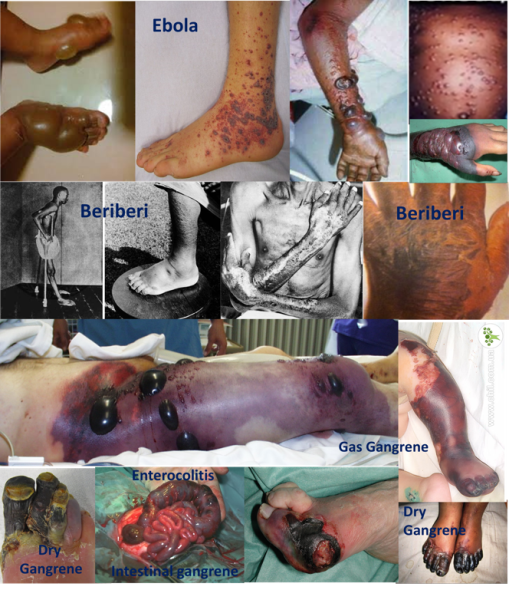
Ebola versus Beri Beri versus various sorts of Gangrene
To confirm this suspicion, I uncovered two very convincing accounts of Ebola outbreaks that involved one missions program and a British military team making their way along the Congo river. The earliest such epidemic occurred in the early colonial periods (see http://fr.wikipedia.org/wiki/Antonio_Zucchelli ), the second took place during the early 1800s as Africa was being explored much more deeply within its interior.
These two events, due to their symptoms and greater than 50% mortality, in very short time, and because of the descriptive information provided, are possibly early accounts of Ebola. If they are not exactly the Ebola we know of today, they are certainly a relative or precursor of the more recent genotypes being expressed. A common feature of the evolutionary theories of diseases states that less dangerous forms of the disease erupted prior to the current much more deadly outbreaks. When I defended my identification of the Oregon Trail “cholera” as not being Vibrio cholerae (V. comma). [One CDC microbiologist and geneticist then present suggested it might even be one of the contemporary E. Coli strains with a choleratoxic like effect].
Ebola is a disease that is ecological in nature. Chances are, it didn’t evolve recently in Africa, but instead presented itself several times before the 1960s. Each time we make new attempts to inhabit and further settle some of the most heavily forested parts of Africa, we expose ourselves to new ecological settings where we can come in contact with previous strains of Ebolavirus that we haven’t yet become infected by.
*********************************************************
For additional citations related to the above, see
Zeitrechnungs-Tafeln für den historischen Handatlas: Mit steter Rücksicht … By Friedrich Wilhelm Benicken . 1824.
http://books.google.com/books?id=P7lRAAAAcAAJ&pg=PA135
“Deo Pater-Merolla Reife nach Congo. 1696. Der Missionar Ant. Zuchelli bereifet Congo. – Die Portugifen werden vom Kuatenhandel verbrängt, behalten jedoeh Mazagan und die vier Guinea-Infeln.”
and my other ScoopIt! posting on this: http://www.scoop.it/t/an-episurveillance-researchers-guide/p/4029834704/2014/10/14/is-there-an-early-history-for-ebola-preliminary-review-says-yes
See on Scoop.it – Episurveillance
December 25, 2014
Posted by Brian Altonen, MPH, MS under Uncategorized
Comments Off on Two technologies meant for each other
When GIS was first promoted, it was very distinct from the similarly sounding technology term GPS. Skillsets for each of these two were taught as two unique training sessions. The GIS was slightly more adapted to research related work than GPS. But GPS was more applicable and true in terms of its presentability. These two technologies ultimately became somewhat dependent on each other.
The same was true for Remote Sensing and a host of other technologies that make use of distance to make their observations, over large areas of space, usually out of sight of whomever and whatever is being observed. Google Map and other public mapping software made RS/Aerial photography commonplace information sources.
The geographic information systems (GIS) now being popularized, ranging from simple modeling programs without the spatial mathematical capabilities, to truly complex GIS becoming quite popular in many fields.
Another form of spatial analytics made popular in the 1990s was grid analytics. With grid analysis, you can perform many of the same calculations made using GIS, in much less time depending upon how you program your analytics system.
Such is the case with NPHG.
NPHG is a unique polygon/grid analytics technique I developed that carries out the basic spatial analyses provided by GIS, but with less than 1/100th the required systems time and manpower that doing the same with GIS.
NPHG provides you the first insights into whatever topics you choose to researched. These insights can be automated and can be produced on a daily or weekly basis; for thousands to tens of thousands of metrics per year using just one system. This information can presented in "Atlas form", which in turn is useful for determining the next steps to take by applying a more traditional, time consuming, but visually impacting GIS analyses technique.
NPHG can also be used to produce results in video form, which in turn can be reviewed in the field. The resolution of these videos is unlimited; most are presented as national images. But the image resolution can be modified to as small an area as you want. A number of my earliest examples consisted of aerial fly-over surveillance tactics, with examples of zooming down on a region programmed in as well.
The benefits of NPHG is that it functions without GIS and has minimal software requirements. It can probably work in many data analysis and calculation work stations, but certain benefits from being on a more rapid, more effective parallel programming analytics setting such as Terabyte.
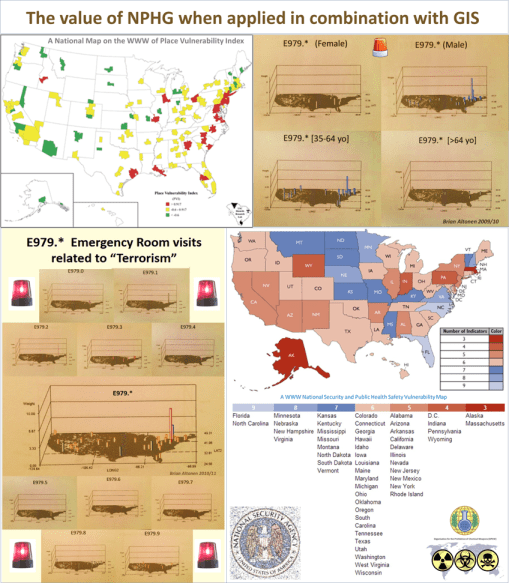
The figures here represent three styles for mapping the new public health problem, "bioterrorism." All three were produced by separate research teams, two of them at about the same time in post-9-11 history (the first map, and E979.*).
The upper left (first) map is a detailed review of risk areas in the U.S. based on various population density, sociological, economic, pop culture, and human ecological and behavioral study results. The lower right map is a lightly later summary of these findings generated at the state level. Both of these were developing using a traditional GIS, based on appearances, probably from two of the chief competitors.
The base maps and results each of these require using merged, recoded, combined, reclassified and reanalyzed spatial data. This process usually takes time to format and perfect the presentation for, not to mention the time to pull in the data and engage in whatever root analyses are necessary.
The two E979 series map sets were produced using the NPHG algorithms, and took less than an hour to make all of maps, from scratch. This mapped data was based on a review of data from about 0.5B EMR/EHR records for about 50M people. The datapull normally takes 5-15 minutes, the data crunch and mapping normally takes from 20 to 40 minutes. 75-100 separately analyses of E979 (total, by gender, by 4+ age groups, 10 E979 subgroups) can be completed in a day, producing just as many maps.
The overlap noted for the findings in the sociological study and the NPHG EMR/EHR study is truly remarkable.
NPHG may be used for rapid surveillance and detection of unexpected spatial changes. Any mathematical formula may be written to detect these changes (increased border differences, increased claims or diagnosis per 24 hr/per week, increased cost, significant changes in diagnosis rates over time and space). NPHG can be used for the surveillance process; the slower GIS processing technologies can be used to further break down those regions where new risks are found to exist.
See on Scoop.it – National Population Health Grid
December 25, 2014
Posted by Brian Altonen, MPH, MS under Uncategorized
Comments Off on Comparing Past and Present – applications to Public Health Surveillance
One of the most controversial topics I have promoted the use of GIS for is the surveillance of natural resources, people, disease and the most significant threats to public health, food and water supplies, and our natural resources. This is not a popular topic. In most medical settings, even when a disease as deadly as the current Ebola shows its face, delving too deeply into more topics is too much for some.
What Ebola points out to us, or reminds us about for those devoted to public health surveillance, is just how complex public health monitoring can be. Rapid assessment tools (like NPHG) are imperative to developing the best surveillance programs.
Still, to assist in surveillance, it helps to have insights into how other such events have happened.
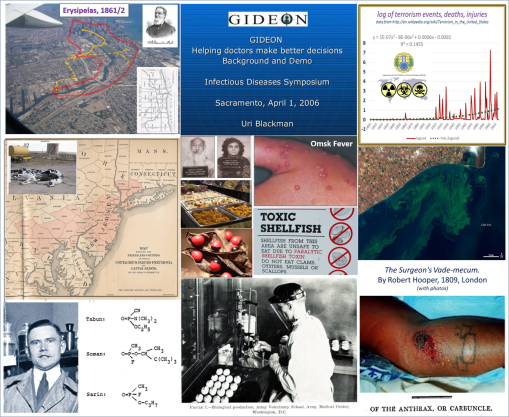
I produced this pinterest page, which is a collection of about 600 items that I developed and used to teach the past, present and future of terrorism/bioterrorism, epidemic outbreak patterns, disease diffusion patterns, and causative or related human behaviors. I also used spatial research methods to describe and define many these past disease patterns. One major advantage to this approach is that it helps me determine true causes for many of these events, even without direct microbiological evidence (i.e. my cholera thesis).
The 600 collages, pictures, documents, news items, also enable us to compare past events with those of today.
And they demonstrate why we need an effective spatial surveillance program.
This site– http://www.pinterest.com/altonenb/bioterrorism/ — reviews: past and current epidemics, disease patterns, spatial and ecological analyses of diseases, the history of terrorism, livestock disease diffusion, potentials for agriterrorism, foodways related emergent events, origins of the first chemical (biochemical) warfare in modern history, the contributions nations and industries have made to our programs, and what we should do to counter and defeat future events. About half of this information has not been published in or reviewed by other sources.
See on Scoop.it – Medical GIS Guide
December 21, 2014
Posted by Brian Altonen, MPH, MS under Uncategorized
Comments Off on Bullying at Schools – Can an effective Intervention Program for this ever be established?
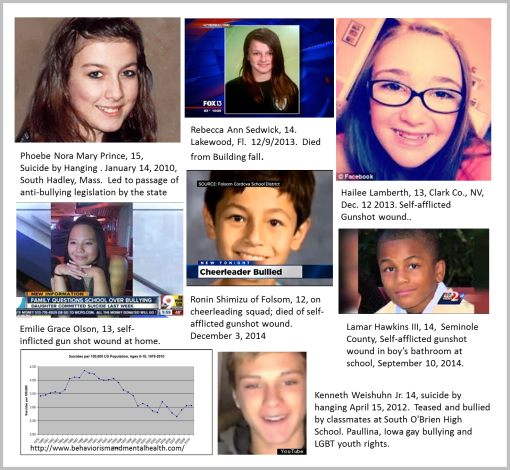
You wouldn’t know it, but there is this social epidemic spreading throughout this country faster than the flu, STDs, or Ebola – – – it has to deal with childhood, adolesecent and teen suicides that occur due to bullying.
The news travels about bullying-linked suicides spread faster than any lessons we are learning right now about why these events happen. And sometimes we tend to respond first, think later, producing news stories that result in more guttural responses than anything productive.
Sidetracked so much by the Ebola outbreak these past 6 months, another such event even in my own community led me to ask: How many news stories have been posed in this past week about bullying at schools? Are these stories more about the programs being developed to understand and manage bullying, or complaints about the system and how we are inadequately dealing with these bullying problems?
Well, there is a lot of evidence for the programs being developed right now. But just as much evidence for the ongoing complaints that exist for the recurring deaths of younger and younger children.
In view of the most recent news development, a new form of anti-culturalism has even developed, leading to yet more bullying cases and more demonstrations of underlying racism within the school settings. It ends up that social media is the main reason this behavior spreads.
Current counts in this new war seem to be 50:50 for either side.
Our typical reaction to a news story like this is to go all out trying to makes amends for this very social and culturally defined behavioral health problem repeated throughout this country.
But due to the events that just occurred, public frustration about about how to best deal with this public health problem is growing.
The following are examples the news posted about this problem in just the past month, followed by some links to the tales about the faces represented by the photos I assembled for this posting.
***********************************************
12/21/2014. Minnesota. Spring Lake Park school district revises bullying prohibition policy. By Sun Focus Editor, Olivia Alveshere. http://focus.mnsun.com/2014/12/21/spring-lake-park-school-district-revises-bullying-prohibition-policy/
12/21/2014. Students, parents seek bullying policies change. by Ed Richter. Ohio. Fairfield Journal-news. http://www.journal-news.com/news/news/students-parents-seek-bullying-policies-change/njXyP/ [life of Emilie Olsen]
12/21/2014. Human Rights Commission to sue Brunswick schools over bullying. Brunswick, Maine [VIDEO]. http://www.wcsh6.com/story/news/local/2014/12/19/brunswick-school-bullying-case-human-rights/20665619/
12/21/2014. Glastonberry CT. Glastonbury school combats bullying through song.
http://www.wfsb.com/story/27680186/glastonbury-school-combats-bullying-through-song
12/20/2014. Utah. Their Voice: Understanding the impact of bullying . by Monica Villar. http://www.heraldextra.com/news/community/their-voice-understanding-the-impact-of-bullying/article_54d92552-e9d0-5bb7-bb46-e3e17254efd2.html
12/19/2014. NJ. North Hunterdon-Voorhees tops county in 2013-14 violence, bullying reports, says DOE. By Christine Lee | Hunterdon County Democrat. http://www.nj.com/hunterdon-county-democrat/index.ssf/2014/12/north_hunterdon-voorhees_tops.html
12/19/2014. Pierce County, ND. The Tribune.
Beyond the Classroom: Addressing bullying is complex for schools. Robert Bubach – Leeds Superintendent , Pierce County Tribune. – See more at: http://www.thepiercecountytribune.com/page/content.detail/id/510337/Beyond-the-Classroom–Addressing-bullying-is-complex-for-schools.html?nav=5005#sthash.HiL9LBYx.dpuf
12/18/2014. Michigan. The Detroit News. Kolka: Parents and bullying. by Kurt J. Kolka . http://www.detroitnews.com/story/opinion/2014/12/18/kolka-parents-bullying/20555547/
12/18/2014. Ocean City, MD. Ocean City school board asked to do more about bullying. by Claire Lowe. http://www.shorenewstoday.com/snt/news/index.php/ocean-city-general-news/60474-ocean-city-school-board-asked-to-do-more-about-bullying.html
“Maliha Mahbub Chowdhury. A name that will forever be engraved in the minds and heart of the people she loved. Maliha was a beautiful talented young lady who was so full of live. She had so many different talent. Drawing, dancing, singing, and bringing a smile to everyones face. Yet Maliah didnt notice the positive things about herself, and bullying in school which brought her self-esteem down she got tired and decided she woud give up [sic],”
12/18/2014. Detroit. Dearborn Heights teen charges anti-Arab bullying at school. Niraj Warikoo, Detroit Free Press . http://www.freep.com/story/news/local/michigan/wayne/2014/12/18/arab-american-student-bullying-files-complaint/20615627/
12/18/2014. Students ‘Cross The Line’ To Stop Bullying In Schools. Eric Johnson, Move2Stand leader, engages eighth-graders with songs after a “Cross the Line” activity. By Emily R. West. The Greenville Sun, TN. http://www.greenevillesun.com/xml/nitf/article_4a75095c-b450-5425-b3fe-134e80c35f39.html
12/18/2014. Lehigh Valley, NJ. Express Times Staff.
How much violence, bullying was reported in your N.J. school?. http://www.lehighvalleylive.com/newjersey/2014/12/how_much_violence_bullying_was.html [Supports “declining” stats]
12/17/2014. Our daughter killed herself because of racist bullies, claims devastated father. Darren Boyle. DailyMail.com. Read more: http://www.dailymail.co.uk/news/article-2877278/Ohio-father-demands-know-racist-bullies-prompted-adopted-Chinese-daughter-life.html#ixzz3MY7PYN7a [Emilie Grace Olson]
12/17/2014. Las Vegas. KNPRnews.
Las Vegas Schools Challenged By Cyber Bullying, Threats. By CHRIS SIEROTY. http://knprnews.org/post/las-vegas-schools-challenged-cyber-bullying-threats [Preventive]
12/17/2014. East Grand Forks. Bullying: EGF Students Punched & Called Fat & Ugly. by Neil Carlson. http://www.valleynewslive.com/home/headlines/Bullying-EGF-Students-Punched–Called-Fat–Ugly–286127711.html
12/16/2014. Did racial bullying spur girl’s suicide? Dad thinks so
Michael D. Clark, mclark@enquirer.com. http://www.cincinnati.com/story/news/education/2014/12/16/suicide-girl/20485201/
12/11/2014. The Sacramento Bee. Folsom Cordova schools chief calls for stronger bullying response following suicide. BY LORETTA KALB AND DARRELL SMITH http://www.sacbee.com/news/local/education/article4435042.html#storylink=cpy
12/10/2014. Metro Detroit schools face lawsuit claiming transgender child was bullied
Author: Hank Winchester, http://www.clickondetroit.com/news/metro-detroit-schools-face-lawsuit-claiming-transgender-child-was-bullied/30120724
12/10/2014. Conestoga Public Schools promote anti-bullying policies . http://fremonttribune.com/cass-news/news/conestoga-public-schools-promote-anti-bullying-policies/article_f764198e-01d2-5aed-89ba-eec0c1ea2e86.html [Preventive]
12/9/2014. Armonk, NY. Stacey Sager, WABC Eyewitness News (Ch7). ‘BEAUTY BULLYING’ AT SCHOOL ON THE RISE DUE IN PART TO SOCIAL MEDIA. http://7online.com/education/beauty-bullying-at-school-on-the-rise-in-age-of-social-media/428892/
12/9/2014. Ohio. Students play role in reducing bullying in Lorain County schools. by Carol Harper. http://www.morningjournal.com/general-news/20141209/students-play-role-in-reducing-bullying-in-lorain-county-schools [Preventive]
12/5/2014. California boy, 12, on cheerleading squad tragically took his life. By Amy Graff on December 5, 2014 12:43 PM.
http://blog.sfgate.com/sfmoms/2014/12/05/california-boy-12-on-cheerleading-squad-tragically-took-his-life/
12/4/2014. Escambia warns parents about new cyber bullying app New App targets Middle and Highschool Students. http://www.pnj.com/story/news/education/2014/12/04/escambia-school-district-cyber-bullying-app/19892061/
12/4/2014. New Mexico. Schools seeing inroads on curbing bullying. By Thomas Garcia . http://www.cnjonline.com/2014/12/04/schools-seeing-inroads-on-curbing-bullying/
12/4/2014. Massena, NY. Watertown Daily Times.
Massena woman supports anti-bullying initiatives in Massena schools By BOB BECKSTEAD. http://www.watertowndailytimes.com/article/20141204/NEWS05/141209327
12/3/2014. Myrtle beach. 8 Socastee High School students arrested in bullying incident. BY CLAIRE BYUN . http://www.myrtlebeachonline.com/2014/12/03/4646029/8-socastee-high-school-students.html#storylink=cpy
12/3/2014. After School Is The Latest Anonymous App Resulting In Student Cyberbullying And School Threats. [Yik Yak After School App]. Matt Burns. http://techcrunch.com/2014/12/03/after-school-is-the-latest-anonymous-app-resulting-in-student-cyberbullying-and-school-threats/
12/3/2014. Unique Anti-Bullying Program Making a Difference in Worthington Schools by Elizabeth Faugl. http://abc6onyourside.com/news/features/top-stories/stories/Unique-Anti-Bullying-Program-Making-a-Difference-in-Worthington-Schools-61256.shtml#.VJbu-14CoM
11/24/2014. (Included because it is from the Huff Post.) Hundreds Of Students Protest Norman High School Over Alleged Bullying Of Rape Victims. The Huffington Post | By Rebecca Klein . http://www.huffingtonpost.com/2014/11/24/norman-high-school-protest_n_6214222.html
********************************************
More links for 2012-2014 VICTIMS (if not noted in above bibliography). — Fatalities brought on by Bullying.
4/17/12. Kenneth Weishuhn, Gay Iowa Teen, Commits Suicide After Allegedly Receiving Death Threats. http://www.huffingtonpost.com/2012/04/17/kenneth-weishuhn-gay-iowa-teen-suicide_n_1431442.html
9/13/2013. Florida. Rebecca Ann Sedwick Bullied For Months Before Suicide, Sheriff Says (VIDEO). [12 yo] Lakewood, FL. http://www.huffingtonpost.com/2013/09/13/rebecca-ann-sedwick_n_3922738.html?utm_hp_ref=school-bullying
12/12/2013. Hailee Lamberth. (Dec. 12, 2013 suicide event. http://www.reviewjournal.com/news/father-white-middle-school-student-s-suicide-related-bullying ; http://www.nydailynews.com/news/national/nev-school-didn-girl-parents-bullying-suicide-lawsuit-article-1.1984436
Emily Grace Olson. http://www.dailymail.co.uk/news/article-2877278/Ohio-father-demands-know-racist-bullies-prompted-adopted-Chinese-daughter-life.html
Lamar Hawkins. Family: Boy who committed suicide was ‘repeatedly attacked’ by bullies. Lamar Hawkins III’s mother addresses media . http://www.wesh.com/news/family-of-student-who-committed-suicide-at-greenwood-lakes-middle-school-to-address-bullying/28061180 ; http://www.nydailynews.com/news/national/bullies-won-son-killed-years-abuse-mom-article-1.1940725 ; http://newsone.com/3053647/lamar-hawkins-iii-florida-school-suicide/
*********************************************
HUFFINGTON POST SITE ON SCHOOL BULLYING
http://www.huffingtonpost.com/news/school-bullying/
*********************************************
BULLYING STATISTICS pages
http://www.stopbullying.gov/news/media/facts/
http://www.bullyingstatistics.org/content/bullying-and-suicide.html
http://www.meganmeierfoundation.org/statistics.html
CDC publication.
The Relationship Between Bullying and Suicide: What We Know and What it Means for Schools.
http://www.cdc.gov/violenceprevention/pdf/bullying-suicide-translation-final-a.pdf
See on Scoop.it – Episurveillance


