When GIS was first promoted, it was very distinct from the similarly sounding technology term GPS. Skillsets for each of these two were taught as two unique training sessions. The GIS was slightly more adapted to research related work than GPS. But GPS was more applicable and true in terms of its presentability. These two technologies ultimately became somewhat dependent on each other.
The same was true for Remote Sensing and a host of other technologies that make use of distance to make their observations, over large areas of space, usually out of sight of whomever and whatever is being observed. Google Map and other public mapping software made RS/Aerial photography commonplace information sources.
The geographic information systems (GIS) now being popularized, ranging from simple modeling programs without the spatial mathematical capabilities, to truly complex GIS becoming quite popular in many fields.
Another form of spatial analytics made popular in the 1990s was grid analytics. With grid analysis, you can perform many of the same calculations made using GIS, in much less time depending upon how you program your analytics system.
Such is the case with NPHG.
NPHG is a unique polygon/grid analytics technique I developed that carries out the basic spatial analyses provided by GIS, but with less than 1/100th the required systems time and manpower that doing the same with GIS.
NPHG provides you the first insights into whatever topics you choose to researched. These insights can be automated and can be produced on a daily or weekly basis; for thousands to tens of thousands of metrics per year using just one system. This information can presented in "Atlas form", which in turn is useful for determining the next steps to take by applying a more traditional, time consuming, but visually impacting GIS analyses technique.
NPHG can also be used to produce results in video form, which in turn can be reviewed in the field. The resolution of these videos is unlimited; most are presented as national images. But the image resolution can be modified to as small an area as you want. A number of my earliest examples consisted of aerial fly-over surveillance tactics, with examples of zooming down on a region programmed in as well.
The benefits of NPHG is that it functions without GIS and has minimal software requirements. It can probably work in many data analysis and calculation work stations, but certain benefits from being on a more rapid, more effective parallel programming analytics setting such as Terabyte.
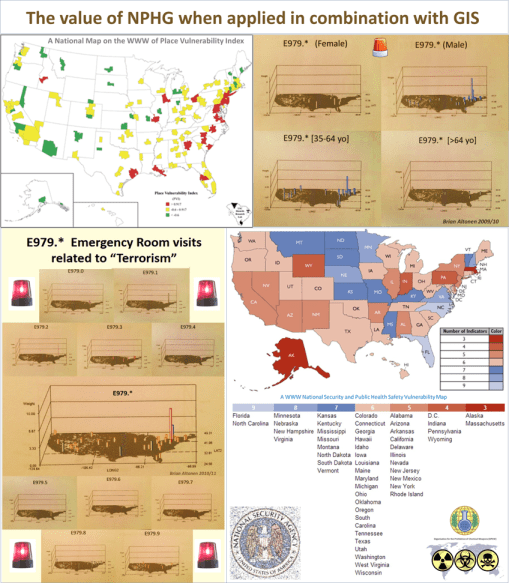
The figures here represent three styles for mapping the new public health problem, "bioterrorism." All three were produced by separate research teams, two of them at about the same time in post-9-11 history (the first map, and E979.*).
The upper left (first) map is a detailed review of risk areas in the U.S. based on various population density, sociological, economic, pop culture, and human ecological and behavioral study results. The lower right map is a lightly later summary of these findings generated at the state level. Both of these were developing using a traditional GIS, based on appearances, probably from two of the chief competitors.
The base maps and results each of these require using merged, recoded, combined, reclassified and reanalyzed spatial data. This process usually takes time to format and perfect the presentation for, not to mention the time to pull in the data and engage in whatever root analyses are necessary.
The two E979 series map sets were produced using the NPHG algorithms, and took less than an hour to make all of maps, from scratch. This mapped data was based on a review of data from about 0.5B EMR/EHR records for about 50M people. The datapull normally takes 5-15 minutes, the data crunch and mapping normally takes from 20 to 40 minutes. 75-100 separately analyses of E979 (total, by gender, by 4+ age groups, 10 E979 subgroups) can be completed in a day, producing just as many maps.
The overlap noted for the findings in the sociological study and the NPHG EMR/EHR study is truly remarkable.
NPHG may be used for rapid surveillance and detection of unexpected spatial changes. Any mathematical formula may be written to detect these changes (increased border differences, increased claims or diagnosis per 24 hr/per week, increased cost, significant changes in diagnosis rates over time and space). NPHG can be used for the surveillance process; the slower GIS processing technologies can be used to further break down those regions where new risks are found to exist.
See on Scoop.it – National Population Health Grid
