Hot Spots for Lead Poisoning over the past 10 years (produced in response to a local news release, in 2018)
.
The Newest Priorities in Health Care must become Spatial Modeling. But to advance to this levels within our current system, a number of major changes still need to be made.
The first of these changes in developing the knowledge based for successful spatial modeling to commence within health care. In nearly every aspect of health care and epidemiology taught in academia, spatial modeling takes second stage to standard 75 year old methods of dealing with public health and the improving health care within the system.
The businesses with the greatest potential for engaging in the more advanced method of analyzing population health–the insurance companies–have never taken on the task of implementing GIS into their day to day analytic processes. As a result, they remain dependent mostly upon older formulas and methods for improving programs. And they perform these tasks at very slow rates, so slow, that the progress made in health care practices is never a result of their engagement in health and disease monitoring. Most advances in health care come from the technological and chemical/pharmaceutical and treatment advances made by the businesses devote to medical equipment. In the meantime, insurance companies, the allies of health care industry, have done little to advance the quality of care we receive.


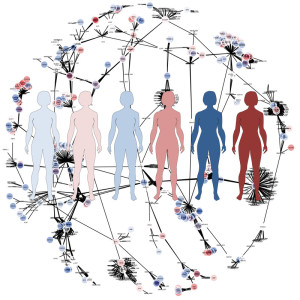
Based on ICDs and/or Lab results, Rare Diseases, Genetic Diseases, Genome and Congenital Disease mapping are standard parts of the new Disease and Diagnosis Tracking system
.
Now, some want to argue that their engagement in prevention and intervention programs is proof that my claim is wrong. However, most of these processes are required of the health insurance industry, not a product of their own creativity and design of new practices.
If insurance companies had taken on GIS when that was first possible, sometime around the Windows 3.1 to 3.2 period, ca. 1995, they would right now be completely engaged in spatial health analysis, and some of the more advanced companies be engaged in the 3D and prediction modeling of population health, at such levels that urbanization programs and programs designed to improve rural population health could have been established by now.

The Ranking of Medical GIS Implementation within a Care Setting
Back in 2012, I evaluated the levels at which health care businesses were engaged in spatial analysis. I designed a 1 through 10 scoring system for a program, using the various applications of spatial analysis processes and tools to the programs they provide.
Level 1, score 1 engagement was one step over doing nothing at all–it consisted of manually mapping, but mostly tabulating your data of health, much like the public health institutions and agencies have been doing since this process was first put into practice around 1840. Talk about being behind, this puts many insurance companies more 150 years behind their potential and analysts and inventors or new research processes,
Level 3 to 4 is about where many smaller businesses engaged in health insurance now work. They are probably trying to define high risk populations, income and race-ethnicity groups, and using census data to locate the highest risk areas, and then, developing intervention programs targeting these health issues. The most basic of these issues are the standard we always hear about–the ones that just won’t be reversed and go away–namely, the low income related poor health/high cost for care related problems, the simplest of unhealthy human behaviors like not engaging in preventive health care behaviors, like exercise, deciding to cease the use of drugs or engage in smoking, reducing your STD risk, developing early recognition programs that work for preventing breast and colon cancer.


But maybe the management of the most basic human behaviors is not the best route for health insurance companies and programs to take when trying to reduce the costs of disease and immediate and long term care.
Another problem the typical health care programs, companies and even leaders have in designing an better program, is broadening the focus of what they do. For decades, the same preventive health plans have been at the forefront=smoking, drugs, drinking, nutrition and diet, lack of exercise, work and unemployment related stress and their impacts upon domestic life and personal safety within the home settings.
But wait a minute, I was just talking about some of these earlier processes–ah yes–the major problem is not that these programs we design do not work; the main problem is that we have failed to redirect out focus into more diseases and broader programs for prevention that better fit many local population health needs, not just the same handful to dozen or two health problems.
Now, again, some are going to argue with how I am wording this criticism. Annual HEDIS reviews of most plans cover thousands of health care related statistics (if you accept the simple monitoring of an RX list as representing over a thousand metrics being monitored.) Similarly, annual reviews sponsored by NCQA, as an example, require successful program to engage in anywhere from a half dozen to two dozen or more monitoring-intervention focused health care, disease prevention programs.
BUT, (and yes that’s a big BUT!), these are pretty mush the same programs again and again. There were similar programs in place decades ago, like the annual anti-Tuberculosis campaign that took place nationwide around holiday season, or Jerry Lewis’s Easter Seals program, or the numerous cancer prevention programs that were developed. Some of these programs worked, others remain important to the national public health programs in place.
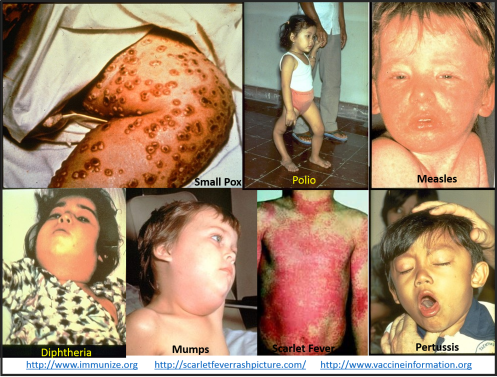
An example of Analytics is the Immunization Surveillance program. Case outbreaks are evaluated historically and monitored. Outbreaks lead to updates and reevaluation of prior GIS analyses performed. Both ICD related to the disease and refusal to vaccinate are monitored. Cluster analysis is performed and simple analysis of area by population features. Clustering and immunization refusal can be linked to local SES and/or cultural patterns. This helps to define the ranges and density in frequency of refusals required for critical levels to be reached, for an outbreak to begin, or the disease to most likely be spread to a new site. Risk factors can then be analyzed for regions, based upon outbreak numbers and risk.
Reaching Level 6 – Comprehensive Analytics
During the early 1900s, we had the excuse of lack of EMR and no GIS, for not engaging in super-active public health improvement programs nationwide. We don’t have that excuse today.
We need program that don’t just monitor some token (mostly symbolic and obviously linked to generations of ineffectiveness) public health problems, like the several highest cost programs nationwide devoted to asthma and diabetes prevention. In the 60’s, diabetes programs focused upon genetically produced Diabetes Type 1 patients; today this program has to serve tens to hundreds of thousands more people with the human behavior-induced (obesity-linked) form of diabetes onset.


In the 1960s, it looked as though epilepsy had a chance of being cured in a lifetime, according to Parke-Davis. Large contributions were made to the Epilepsy-Find a Cure campaigns. These campaigns are not longer common to the TV screen, which in part is due to more than 50 years of ineffectiveness. Sure, medications have improved, and some treatment-preventive methods make for safer long term outcomes. But, the unknown possibly gene-based reason for onset, has only delayed progress in treatment, or at least caused it to come to a standstill. So instead, those who have epilepsy, must deal with life in terms of two things–improved quality of life, including increased engagement in preventive self-administered care practices, improved interactions with friends and neighbors at the community level, and hopefully (but unlikely) reduced cultural based reactions to the person with the diagnosis of epilepsy (it is still to find a job that will allow for seizures to result in needed breaks or days off). By first hand experience (I dealt with this for easily twenty to thirty years, including the controversial surgery before its time), social knowledge and cultural definitions still remain a stumbling block in allowing epileptics to reach their fullest human potential.
So, it is up to any new programs now being developed to fully assess all of the health features of their populations, not just engage in the needed programs devoted to asthma treatment, mental health [programs, diabetes and lifestyle, or even programs that ensure patients remain devoted to whatever programs, activities and prescription products that are needed for them to stay healthy. Current programs speak about having these programs, but due to cost, knowledge base and staffing, only those select few examples exist.
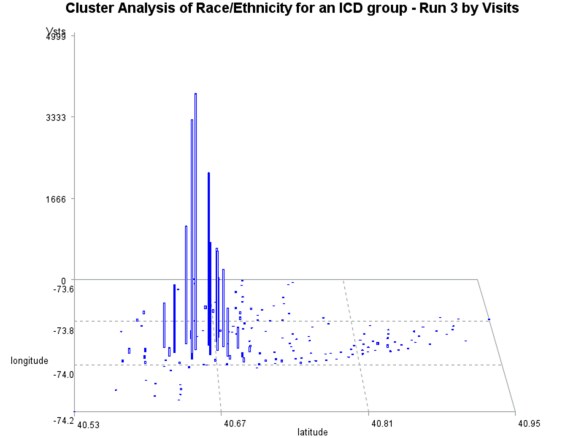
For a certain ICD, or medical condition such as a lab value, or count /prevalence of individuals with a certain risk, can be evaluated based upon: Number of Patients, Visits engaged in for the ICD or risk activity measure, and numbers of procedures (complexity of practice) a patient goes through to receive care for the problem. TB cases for example, evaluated for average number of visits per patient provides a more useful rendition of the Patient-Visit-Care data, about the clustering or patients and cases, relative to cost and demands upon the system. Plans can be made based on the small clusters of cases with the largest numbers of visits per case average, in other words–those regions and cases with the highest cost. To document the need for change, and later success, a thorough review of the total population for its top ICDs and cost/visit relationships are required. For example, when the epidemiological transition modeling of the ICD data is applied, as in the below figure, evidence showed us that TB patients demonstrated the highest visits per patient over time, but have also undergone one of the most successful reductions in visits per year, over the past 12 years.


To fully understand the health of its population, an insurance company or managed care system must produce complete reviews of its patient’s health status, annually, and to apply this same process retrospectively with patients that have been in their care for years. On many of my pages about spatial analysis of health, I defined these various processes.
For a company or business to go above that Level 3-4 that I claim they exist at, they can easily reach what I am calling that Level 5.5–which is characterized by full engagement in environmental and population health monitoring, and experimenting with spatial analysis and the applications of spatial mapping software to the program. To be a successful Spatial Analyst centered program, a company must have developed the knowledge base and programming needed to engage in spatial analysis of anything and everything within the EMR. That constitutes the level 6 position in my 1 to 10 scale scoring system.


Infibulation or Female Genital Cutting/Mutilation is the first Culturally-linked “health” practice analyzed across the system and mapped, before initiating a full scale monitoring program, which includes the development of a plan and policy or set of rules required to produce a HIPAA compliant database (5 levels of compliance or use were defined, from full internal to full external data sharing), the definition and use of different parts of that database: a) name and registry data, levels 1 and 2 use only, b) visit history (temporal data and visit type only, for analyzing counts, frequencies, and ratios), c) procedures history (lab procedures and all other events done in care ranging from education, to diagnostics, to treatment and rx, etc.), d) results/outcomes of special testing (in general), e) Special lab results, microbiology, etc., f) pharma hx and such, g) ICD primary research ICD and allied or related ICDs, h) lifespan ICDs (diagnostics, procs, before during and after the medical experience). Others are pulled based upon purpose and request.
Example of this I see at work every day, include:
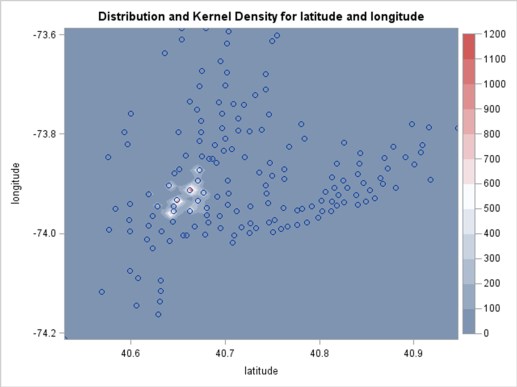
- Pulling and massaging the EMR data and then mapping this data (within a half-day or less), in order to see where possible risk areas or subpopulations exist, engaging in this in response to a query from a PCP or some news report (i.e. by development of lead exposure >20 maps, or the maps of kids whose parents refused immunization after the recent measles outbreak in Rockland County.)
- The development of standard base Population datasets, for immediately comparing and contrasting prevalence and incidence for a topic, again “on the fly”, or looking at recent changes in patient types in the ER due to a new flux of immigrants.
- Finding the hots spots for a given bacteria or disease type that demonstrates seasonal and cultural / SES related patterns of re-eruption, based upon the last ten years of EMR data, in response to the recent legionnaire’s clusters detected, or the new adenovirus outbreak, or concerns that medication resistant TB may still be able to re-emerge in the future due to certain immigrant-rich communities.


This is the model developed for testing all of the EMR data, which includes notes (open text) and is evaluated as a non-structured data NLP process, as a NLP-process merged with a structured data search and extraction process, and a purely structured data search and extraction process (the methods most often employed). NLP is show to increase the amounts of pulls of researchable data from two-fold to ten-fold, depending upon the research questions. Seven data mining and extraction sql searches were merged into a single data pull run to accomplish this task; the total process takes place typically in three to six queries placed around the initial raw data master query. The Data transformation process (deidentifying the data, making the dataset HIPAA compatible at one or more levels) includes a removal, change or recoding of name (removed), patient_id (replaced with a math equation defined fake_id), address (replaced by lat-long, if needed), zip code (may be lat-long instead), facility (unique letter or unique letter-number coded), provider (recoded and deidentified), certain dates (i.e. birth and death dates, may be substituted with age or replaced by just year, or year and month),specific rare ICDs (placed into clusters or groups).
In effect, there is no excuse for the current status of GIS implementation in health care. At the ESRI level, some changes were made administratively with this goal and the related tasks in mind. There are many examples of GIS implementation that can be produced. And the Health GIS news is always sharing examples of new programs being initiated. Yet, none of these programs demonstrate the level of sophistication I am talking about with amount and types of use for GIS.
GIS needs to be implemented as a preventive health tool, a prediction tool, a cost analysis tool, an administrative planning tool. It can be used to evaluate, routinely, patient-visit practices. It can be used to see if there are peaks in product use or whether a change in medical claims policies (such as defining a new ICD10 resulting in improved DMDD care, for Community A vs Community B) actually changes the practices that are happening.
With the programming and methodology for GIS use established, any program can transfer the data from ongoing research programs into the spatial analysis aspects of health care. In theory, annual reports can even be implemented, for monitoring just Hispanic or African American Care related needs , or evaluating if changes are happening at the Culturally-related, Culturally-linked vs. Culturally-bound disease patterns level (which I have explain in detail several times, elsewhere).

Most of the programming that is required for the spatial analysis of health exists in some form or fashion across the IT world. Yet, to date, most of the agencies functioning as part of the health care system have failed to develop programs that successfully analyze and report on all that we need to know about health.
In the recent past, a number of Medical GIS people have argued with this statement. In part, they are correct because for each of their systems, some part of an ideal Medical GIS program has been perfected and is ongoing.
But this statement is not about those successful parts of Medical GIS that are put into play. To produce a successful program, an agency or company or corporation has to be able to implement spatial analysis at all levels. This not only includes the basic descriptive analytics that many places are engaged in. It also includes full scale analysis of the population that is managed, its ICDs, its health habits, the Charlton, Elixhauser, and other standardized scores for evaluating patient health risk, the costs for care on an individual in relation to age, ICD, SES, and procedure basis, the frequency of use of the system at all clinical and administrative/preparatory levels, the changes in numbers that occur over time, the development of machine logic NLP review processes for physicians’ and patients’ notes designed to accompany CPT and diagnostic code generated output, prediction models for any or all of the above, the semi- to fully automated regression analysis methods.


The other concern of high priority has to relate to HIPAA and patient confidentiality. To deal with this, five tiers of data development and processing were designed, to make data compliant with internal, external, and combined internal-external EMR data users. This includes the design of algorithms that produce effective deidentifiers (fake ID substitutes), and recode certain data forms that otherwise could still the possible identification or a given individual. Degree of data change for each of these levels is focused on things like exact DOB/Deathdate, exact location information, even exact ICD identificiation in some cases (aggregates are used instead where appropriate).
Before implementing this new GIS, a number of alternative spatial analysis processes were developed and tested during the past three tears, using EMR data (examples of which I have posted), using SQL and SAS (non SAS GIS) to develop, utilize and test a variety of new spatial methods to extract data and transform it, making it HIPAA compliant, well before importing it into SAS or GIS. This new GIS demonstrates some of the benefits of still managing complex EMR data within the GIS Workstation and Reporting environment.


Lead Poisoning Cases, Children < 5 yo
Due to the recent reports published in the news about falsifying documents pertaining to health safety inspections performed in low income settings, a means for evaluating the results of Lead Exposure blood tests performed on children under 5 at the time of testing was developed. Only unsafe values above 20 were checked, and mapped for this first run.
This same process may now be used to evaluate any datum or binomial query about NLP evaluated contents of an EMR note, be it of structured or non-structured data form. Three queries were developed based upon structured data defined expectations, a combined structured-non-structured result that may be considered a “hit”, such as a procedure and note indicating the result, and a completely non-structured text entries based NLP data review.

The next level of this work is to design a standard way to report upon the entire histories of a given set of patients. Four key databases, which are independently analyzable, yet linkable, have been identified for this process. They define the patient and population (1 unit), the ICD history (5-7 units per patient avg), the Visits schedules and times (20:1 ratio, by type of visits as well), and the Procedures or Care Events (labs, imagery, educational steps taken, discussion types, interventions) linked to Visits type-time relationships (50-2000:1 patient ratio). In addition, special tests are identified as well to be of value in separate reporting, such as microbial/infectious disease history, psychological/and mental health history, etc.
The ultimate goal of any Medical GIS program, implemented by an institution or healthcare plan, should be the development of an effective combined intervention-prediction modeling healthcare analytics program, designed to complement and add to the other analytic programs you may already have in place.


