October 2014
Monthly Archive
October 31, 2014
Posted by Brian Altonen, MPH, MS under Uncategorized
Comments Off on Reactivation of HOT for the Ebola epidemic | Humanitarian OpenStreetMap Team
News in the first weeks:
“
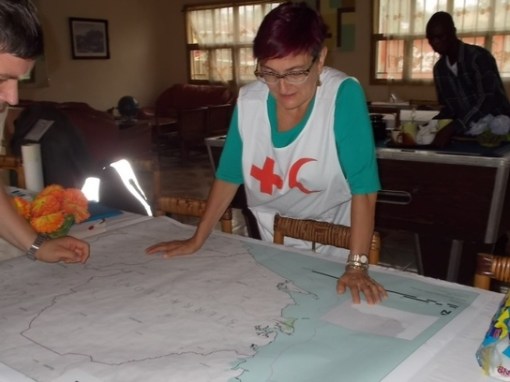
Following the second wave of the Ebola outbreak marked by a jump in the number of deaths, teams from Red Cross and MSF are currently deployed in Sierra Leone and have asked for a re-activation of HOT. GIS specialist CartONG has been deployed on the ground again and is liaising with MSF.
According to the latest report of WHO on Tuesday July 1st, the Ebola outbreak killed 467 people, with about 759 cases of hemorrhagic fever identified in the three affected countries, Sierra Leone, Guinea and Liberia. This is 129 more deaths than the previous record from a week ago, an increase of more than a third, a sign that the epidemic is spreading after a lull in April.
“
Source: hot.openstreetmap.org
Two weeks ago I reviewed the press, news, etc. for GIS and Ebola related postings. I first published the social media response at the general public level, the chats out there, the events that happened before the WHO and other major agencies reacted to this impending outbreak.
I then posted some of the popular news and popular culture impressions pertaining to Ebola, with reference to GIS, as a measure of how much the public, media and medical profession in general understood the value of GIS in monitoring these outbreaks, and why a global program needs to be implemented that monitors disease activity effectively, outside the closed quarters of Homeland Security, WHO and CDC establishments.
The following are the refereed professional articles on the value of GIS in Ebola and a number of pages detailing the importance of IT, RS and other advancements in disease surveillance. These may have been to our benefit, had they been implemented by the time this last Ebola outbreak began.
*********************************************
SATELLITE IMAGERY – PUBLIC RELATIONS
Satellite imagery is naturally a related hot topic for this field. We haven’t seen as much “new” or even articles on the use of these services. But these services no doubt exist. The following are prime examples of these pages.
afrol News, 23 December 2013 – European satellite to assist solving the Ebola enigma. http://www.afrol.com/articles/10731
Solving The Ebola Enigma: Satellites Will Provide Clues . http://www.sciencedaily.com/releases/2003/12/031223062412.htm
*******************************************
NON-REFERREED PRESS (Opinion papers, company white papers, etc.)
September 2004. Dr. James Deutsch, Director, Africa Program, Wildlife Conservation Society To intervene or not? Implications of models of ebola spread in African apes (apes and Ebola). http://www.oneworldonehealth.org/sept2004/pdfs/jamesdeutsch.pdf
GIS Support for the MSF Ebola response in Guinea in 2014. 1st Edition. Jul 2014. Operational Center, Geneva. http://cartong.org/sites/cartong/files/GIS%20Support%20for%20the%20MSF%20Ebola%20Response%20in%20Guinea_Case%20Study.pdf
A review of this is at http://reliefweb.int/report/world/gis-support-msf-ebola-response-guinea-2014-case-study
Dated July 15, 2014.
*******************************************
MOSTLY SCHOLARLY WRITINGS — ACADEMIC PAPERS (Term papers, Thesis, dissertation)
[COURSE DESCRIPTION/ESSAY] Role of GIS in Tracking and Controlling Spread of Diseases. Final Draft. By Syed Imran Quadri , ID # 220560 , For CRP 514: Introduction to GIS , Term 041 – 11th Offer. Course Instructor: Dr. Baqer Al-Ramadan . Date: 12, 19, 2004.
http://faculty.kfupm.edu.sa/crp/bramadan/crp514/Termpapers/Term041/7%20-%20Term041%20-%20Report%20-%20Imran%20Quadri.pdf
*****************************************
ACADEMIA
[INTERESTING STUDENT’S TERMPAPER] http://faculty.kfupm.edu.sa/crp/bramadan/crp514/Termpapers/Term041/7%20-%20Term041%20-%20Report%20-%20Imran%20Quadri.pdf
[TERMPAPER? THESIS?] Anumba Joseph Uche. Scientific Officer,national Arbovirus and Vectors Research Centre, Enugu-Nigeria, Integrating GIS and Remote Sensing Technology In Contact Tracing Of Ebola Virus Disease Cases In Nigeria. Downloadable from academia.edu.
http://www.academia.edu/8151525/Integrating_GIS_and_Remote_Sensing_Technology_In_Contact_Tracing_Of_Ebola_Virus_Disease_Cases_In_Nigeria
[THESIS] Rahel Dubiwak Gemmeda (2012). EMERGING INFECTIOUS DISEASES WITH LIMITED TREATMENT OPTIONS: THE CASE OF EBOLA HEMORRHAGIC FEVER IN UGANDA AND SHIGA TOXIN PRODUCING ESCHERICHIA COLI IN THE UNITED STATES .
A Paper Submitted to the Graduate Faculty of the North Dakota State University of Agriculture and Applied Science . By Rahel Dubiwak Gemmeda In Partial Fulfilment for the Degree of MASTER OF SCIENCE. Major Program: International Infectious Disease Management and Biosecurity , August 2012 Fargo, North Dakota.
http://library.ndsu.edu/tools/dspace/load/?file=/repository/bitstream/handle/10365/22293/Rahel%20Dubiwak%20Gemmeda.pdf?sequence=1
[DISSERTATION] Gerardo Chowell-Puente. (2005). MATHEMATICAL MODELS OF EMERGENT AND RE-EMERGENT INFECTIOUS DISEASES: ASSESSING THE EFFECTS OF PUBLIC HEALTH INTERVENTIONS ON DISEASE SPREAD. A Dissertation Presented to the Faculty of the Graduate School of Cornell University in Partial Fulfillment of the Requirements for the Degree of Doctor of Philosophy. January 2005. Accessed at http://math.lanl.gov/~gchowell/publications/GCHOWELL.pdf
*************************************************
ARTICLES
Jessica Hughes. 2010. GIS-Based Interoperability System Alters How Virginia Manages Emergencies. An information-sharing system provides the state with a common operating picture during disasters while aiding a national pilot to capitalize on the power of GIS data. October 25, 2010. Emergency Management. http://www.emergencymgmt.com/disaster/Virginia-Interoperability-Picture-Emergency-Response.html
Tambo, E., Emmanuel Chidiebere Ugwu and Jeane Yonkeu Ngogang (2014). Need of surveillance response systems to combat Ebola outbreaks and other emerging infectious diseases in African countries. Infectious Diseases of Poverty. 3:29.
http://www.idpjournal.com/content/pdf/2049-9957-3-29.pdf
Peterson AT, Bauer JT, Mills JN. Ecologic and geographic distribution of filovirus disease. Emerg Infect Dis [serial online] 2004 Jan [date cited]. DOI: 10.3201/eid1001.030125 Available from: URL: http://wwwnc.cdc.gov/eid/article/10/1/03-0125
************************************
BOOKS
(I know that over the last two decades, many more pop culture books are out there discussing the past present and future of global health and disease outbreaks; they are not mentioned here.)
George Korte. The GIS Book. http://books.google.com/books?id=_C6oPvJ5S_EC&pg=PA15
See on Scoop.it – Medical GIS Guide
October 31, 2014
Posted by Brian Altonen, MPH, MS under Uncategorized
[2] Comments
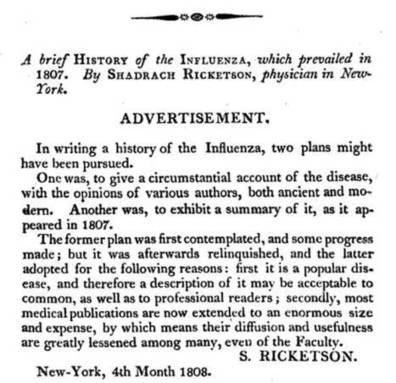
Influenza When the Influenza epidemics struck New York and Ricketson’s immediate community, it occurred at a time of the year that was persistent, but very different from the more common febrile ep…
Source: brianaltonenmph.com
How did we come to learn the uses for epidemiology and disease mapping?
Yellow Fever certainly had its influence, as demonstrated by the first ever map of cases produced by New York’s physician, Valentine Seaman. Seaman’s purpose was to determine if the yellow fever came from the ships landing in the ports nearby, following their arrival from Jamaica and other warmer climate settings, or if it was due to local climate and wind patterns.
But the months of late summer and early fall weren’t the only time that doctors were trying to map particular disease. The Influenza, sometimes referred to as a severe catarrh or ’bout with the cold’, was an upper respiratory disease that often struck New Yorkers about the same time of the year, right after the Yellow Fever season was over.
Quaker physician Shadrach Ricketson wrote about these seasonal disease events and their semi-predictability numerous times, most of these items published in the Medical Repository.
His most famous, most commonly used term for this sometimes warmer spells of November into December was "Indian Summer." Indian Summer meant that autumnal fevers could re-emerge.
There is one particular research project Ricketson initiated which was quite unique. He sent hundreds of letters (by the slower horseback and wagoneer mail delivery to postal offices back then). They were addressed to his medical colleagues around the state of New York.
Dr. Ricketson asked these physician s about the influenza and how it behaved by the seasons, changes in weather and other natural events. Most of the physicians of the state had responded, representing most of the state. He then published his essay on this study, a first of its kind.
This same procedure for analyzing disease pattern geography became the standards over the next several decades, and became a regular activity engaged in several times per year by regional and state medical boards by the 1870s.
See on Scoop.it – Medical GIS Guide
October 26, 2014
Posted by Brian Altonen, MPH, MS under Uncategorized
Comments Off on Cuba’s war on Ebola – Stage 1. Treatment and Prevention in Africa
With free universal health care, Cuba has already racked up impressive medical achievements – why not take on the globe?
Source: www.aljazeera.com
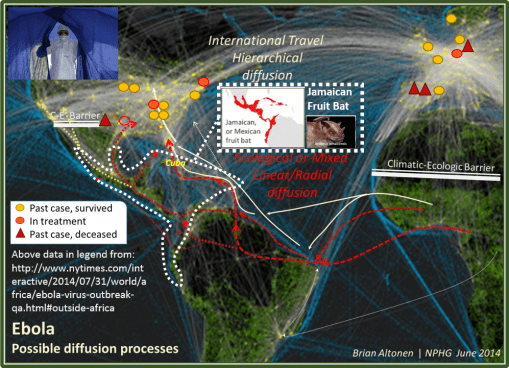
Back in June, I posted a map of the possible diffusion patterns for Ebola. At the time, a few other ecologists and disease ecologists soon posted notes on the internet expressing similar concerns.
The Jamaican Fruit Bat (Artibeus jamaicensis; white area on the map) is the ecological link between African Ebola and the potential for North and Central American neotropical Ebola or Ebola-prone ecological, environmental domains. Russian disease ecologists E.N. Pavlovsky (b. 1884, most important impact 1937, 47 – 1965), D. K. Zabolotny, and A.G. Voronov (1970 – ) perfected this macroecological interpretation of zoonotic related disease patterns. (see https://brianaltonenmph.com/gis/historical-disease-maps/zoonoses/ 😉
We can use the distribution of this species to define our first boundaries for a natural ecological diffusion pattern for Ebola, assuming this Artibeus is a sufficient animal host or carrrier.
If we superimpose on this map some of the newest data on cases that have escaped the African region (approximations given here, not exact lat-long), and we relate these to another historical map depicting travel routes abroad (light blue lines), we see expected and unexpected travel patterns behind the few cases that have erupted in Europe and the United States.
These are the essential human travel/migration/diffusion disease patterns.
The article on Cuban physicians active in the anti-Ebola campaign, even before the current eruption, brings up some important issues. Most certainly they must be thinking about this same series of observations on their own.
As noted in a number of my postings, there is this latitude effect that limits Ebola activities at the natural versus human ecological levels. In terms of natural ecology, Ebola prefers its native tropical settings; in the U.S., the Caribbean and per-Gulf of Mexico regions are prime neotropical vegetation and animal settings. Cuba is the center of where Artibeus prevails as well. Cuba is also close enough to the U.S. to interact with the Gulf of Mexico shoreline setting with their neotropical animal habitats.
Cuba is at the heart of the setting for where a nidus could most easily develop. Population density defines next how the disease might influence the environment. Most of the cases that penetrated the U.S. are well within the temperate zone borders, with the exception of the Houston events. But even the Houston area is well above the natural Artibeus domain.
Regarding westward versus eastward diffusion of Ebola along the Artibeus migration paths following both coastlines of Mexico, there is a Climate-Environmental Barrier (C-E Barrier) on my map that I defined in June, suggesting it would be hard for the disease to strike southern California, except through human transportation involvement. An Ebola specimen that did reach southern California still has some ecological requirements lacking, although other wildlife may serve as reservoirs as well (the "armadillo" effect for western Texas, as mentioned elsewhere by Lane Decamp, LinkedIn discussion).
The possibility of a northnortheastward migration from Mexico into the U.S. cannot be easily ruled out, in terms of environment. But other parts of the macroecology are also lacking (again, excluding "the armadillo").
So this leaves Cuba still a very good candidate for providing a route for Ebola migration into the U.S. and other parts of the Americas.
Other Caribbean Island routes are possible as well. But, due to its engagement in Ebola health care activities, any Cuban healthcare providers engaged in Ebola work in the field add a human ecological effect to this natural disease diffusion model.
Were Ebola to naturalize to the tropical Americas, the expectation is that it would behave much like other African-borne tropical zoonotic diseases with large animal resources, hosts and vectors.
It could also in theory impact the western shoreline countries of South America, tagging behind the cholera diffusion that ensued along the Peruvian shores following its naturalization off the coast of Lima (for US areas like this, see my El Tor video–https://www.youtube.com/watch?v=m5tccQopKFE ; also AA Franco et al., 1997. Cholera in Lima, Peru, Correlates with Prior Isolation of Vibrio cholerae from the Environment, article at — http://aje.oxfordjournals.org/content/146/12/1067.full.pdf ). This diffusion pattern also follows the distribution of the frugivore bat.
A naturalized Ebola is expected to demonstrate outbreaks in human population areas where sanitation practices are a concern, accompanied by eating practices that make use of certain wildlife-based foodways (how they prepare and keep the meat). The right ecological settings along the entire shoreline of South America, east and west, and through Middle America, are at risk.
In terms of latitudes–the 10, 15 and 20 degrees latitude line rules I discussed previously hold true for this region. On the western shore (including both sides of the Isthmus), I expect 12south-0-12north distribution; along the eastern shore, 12n-0-4s. The Brazilian population densities below 4s could bear some of the same risk as US temperate zone populations.
See on Scoop.it – Medical GIS Guide
October 25, 2014
Posted by Brian Altonen, MPH, MS under Uncategorized
Comments Off on Curare, Sarin and now Ebola: was a Genetically Modified Organism developed in US Biowarfare?
As I read this notice from ClinicalTrials.gov, a service of the US National Institutes of Health, the US Government and Pharmaceutical corporations have been conducting ebola tests on humans. http…
Source: www.globalresearch.ca
let me begin with the following: I don’t know the answer to this question.
There are more parallels to science, medicine and history than we typically imagine. The discovery and documentation of the use of African toxins like Curare first came to light in the medical journals in the mid-1800s. They were rediscovered several times by scientists who accompanied the British Explorers in the 1870s to 1890s. Each scientist then envisioned them for use as chemical weapons.
Chemical weapons didn’t become an official venture of the United States, by way of engineering schools (Carnegie) and chemical industries (no naming companies here), until the 1910s or 1920s (Carnegie’s American Chemical Warfare Team, 1917).
The invention of a highly selective and toxic neurochemical turned chemical warfare into the industry we related it to today. The very deadly neurotoxin, sarin, first came to market as an agricultural pesticide. Its inventor, Dr. Gerhard Schrader, of Bayer AG, first invented the pesticide E 605 (parathion) (http://www.pinterest.com/pin/568790627909181638/ ).
So, does Ebola represent one of several examples of the next generation or period in weaponry research? I say, ‘Yes AND No.’
There are two major ways to "interpret" Ebola based on biology and chemistry.
A traditional historic epidemiology theory might state that it was a natural organism, that for some reason evolved into the vicious and deadly form it has become since the mid 1970s.
The conspiracists’ theory states that it was a by product of some scientific lab in Africa, as early as the 1970s, but more likely an organism that was developed over time into the highly deadly version infecting us now.
One argument in favor of the conspiracists’ theory is the fact that it seems against the laws of nature for an organism to evolve into a very deadly form. The reason here is that it requires a certain amount of time, alive in the human body, and it it becomes superdeadly, the body dies and could in turn work against the ability of the organism to find new victims. Of course, countering this theory is the notion that the ebolavirus benefits spatially, temporally, and genetically, by undergoing rapid reproduction and producing a template upon which it can thrive and be picked up for redistribution by other animals that thrive on dead flesh.
In favor of the traditional natural ecology, historical epidemiological theory is the notion that the organism evolved naturally, and naturally produced its current, more vicious form as well.
Circumstantial and even debatable evidence which I put out there for the latter are the two postings on early Ebola like diseases found in early 1800s disease maps and writings. Each of these two initial "proofs" have separate details about the "River Fever" they are related to, each on an Ebola related River–the Congo and the Niger. What is convincing at the researcher’s end is that discovering these two cases did not require extensive searching–it wasn’t a case in which dozens to hundreds of examples had to be evaluated before a match for Ebola could be located.
Instead, this evidence came from the 1827 German Disease Topography and Climate map by Friedrich Schnurrer. It was immediate apparent that the Congo River disease was like none other described on this map, in both its taxonomic nomenclature (a very common tool for naming everything in nature then, see Erasmus Darwin) and the symptomatology.
One possible argument is that, naturally, the ebolavirus was developed in a bioweapons lab in Africa, through natural reproductive means more than through genetic manipulation methods. The goal was then to test each version that came out, striving to find the most deadly organism. [In my typical way, I cover this history of biological warfare and bioterrorism extensively at http://www.pinterest.com/altonenb/bioterrorism/ ]
As noted earlier, on another posting, 1982-4 marks the transition from evaluating AT-CG ratios to nucleic acid sequencing in molecular biology. Some of the first genetically modified organisms became genetically engineered products around 1984-5 (Agrobacterium tumefaciens, and frost-free bacteria); the industrialization of bioengineering a product was developed in the late 1980s by a Japanese producer of amino acids, for sale as supplements (this is what caused the tryptophan tragedy).
The natural evolution of Ebola was the primary reason for its persistence up until the molecular genetics period in modern science. The human evolution of Ebola, induced by genetic modification and/or by simple selective breeding and differentiation, does fit into the time sequence given in this article for post 1987 events. This note, in addition to the genetically engineered, patented Ebola in possession of the CDC for pharmaceutical manufacturing, suggests that there is now a double edged sword related to everything we do in pharmacogenetics.
"Survival of the fittest" is being replaced by "Survival of the Best", at least "the best" based on certain cultural definitions.
[QUOTE:]
Two Scientists Say Ebola Originated In US Bio-warfare Lab
Experts have brought to the public’s attention that ebola is a genetically modified organism developed in US biowarfare laboratories in Africa.
In the two articles below reproduced from Tom Feeley’s Information Clearing House (a good site worthy of your support), Dr. Francis Boyle of the University of Illinois and
Dr. Cyril Broderick of the University of Liberia and the University of Delaware provide their fact-based assessments. Dr. Boyle drafted the Biological Weapons Anti-Terrorism Act of 1989, the US implementing legislation for the 1972 Biological Weapons Convention.
For speaking out, both Boyle and Broderick will be viciously attacked by the US print and TV media. Remember the case of Gary Webb who exposed the CIA’s drug-running that supported the Contras in Nicaragua. The cocaine that launched the War on Drugs was brought in by the CIA. http://www.opednews.com/articles/WPost-s-Slimy-Assault-on-G-by-Robert-Parry-CIA_Cocaine_Gary-Webb_Journalism-141018-836.html
[End QUOTE]
See on Scoop.it – Global∑os® (GlobalEOS)
October 22, 2014
Posted by Brian Altonen, MPH, MS under Uncategorized
Comments Off on CDC admitted disease imported as states data reveals illegal immigrant links
In straightforward defiance against the White House position of non-transparency, previous communication from the Center of Disease Control discovered Tuesday a
Source: www.examiner.com
I mapped immunization refusals, demonstrating the peak in the Pacific Northwest, and the distribution of outbreaks of diseases, as noted in claims, that we should be immunized against.
These pages and videos (some of the first such videos I produced and presented) are at the following sites.
In general: https://brianaltonenmph.com/gis/population-health-surveillance/production-examples/childhood-immunization-refusals/ .
As a Pacific NW issue: https://brianaltonenmph.com/gis/population-health-surveillance/production-examples/regions-and-health/part-v/ .
The Pacific NW cluster, up close, NPHG video– https://www.youtube.com/watch?v=YHH32Oq_obs .
My insights at the time Measles struck NY: https://brianaltonenmph.com/2014/02/14/population-density-immunization-refusal-potential-outbreak/ .
The controversy I caused by first posting these projections, which unexpectedly turned in my favor over a weekend. https://www.linkedin.com/groups/Will-Polio-ever-be-Eliminated-120372.S.5842778018094813185 .
Applications of GIS to MANAGED CARE based on my study of well visits and immunization rates, Medicaid population in Denver, 2005-6. This and more reviewed at : https://brianaltonenmph.com/gis/populations-and-managed-care/applying-gis-to-managed-care/
See on Scoop.it – Medical GIS Guide
October 22, 2014
Posted by Brian Altonen, MPH, MS under Uncategorized
Comments Off on Monkey Meat and the Ebola Outbreak in Liberia – YouTube
https://www.youtube.com/v/XasTcDsDfMg?fs=1&hl=fr_FR
VICE News Exclusive: Part 1 of “The Fight Against Ebola” – http://bit.ly/Ebola-Part-1 West Africa is being plagued by a new outbreak of Ebola — a terrifying …
Source: www.youtube.com
VIDEO: What is "bushmeat"? [18 minutes]
See on Scoop.it – Global Health Care
October 20, 2014
Posted by Brian Altonen, MPH, MS under Uncategorized
Comments Off on The Latitude and Longitude of Ebola
The patterns are in general for Ebola spread somewhat predictable.
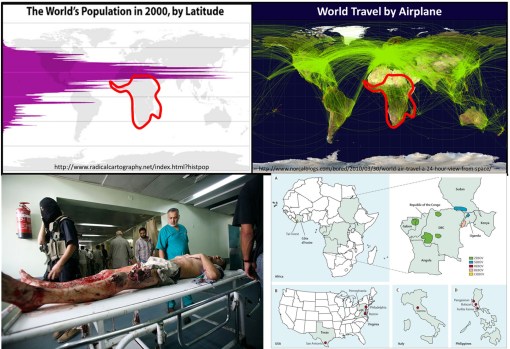
When viewed in a global sense, we get a better perspective as to why foreign born diseases inevitably go northward as the season progresses.
Population density and clustering in relation to the latitude is the reason diseases diffuse from the tropics to the northern temperate zones where more people reside. Any one looking at the above map with population density displayed relative to latitude can figure this out.
But the above basic display of latitude and people relationship took centuries to develop, still longer to make sense in terms of diffusion processes and the importance of spatial epidemiological research.
Source: news.yahoo.com
Today’s vision of how a disease spreads was not to obvious to people during the 17th and 18th centuries. Through observations made over time and distance, doctors and scientists developed what they referred to as "The Latitude of Pestilence Law" in 1814. This law explained epidemics and the migration of diseases as a consequence of global climate differences across the earth’s surface and as a consequence of seasonal changes making of section of the earth resemble another climatologically, and in particular in terms of amounts of rain, daily temperature levels, humidity, and the health attached to each.
This relationship was first described by geographers trying to describe how and why yellow fever behaved the way it did. It did not infect Europe much at all, but created a devastating impact on North America, progressing from the south to the north. At first this was taken to be the consequences of slave trade, that is until England came into the path of yellow fever as well.
The seasonal and recurring behaviors of yellow fever resulted in the first global warming theory to ever be made in the literature, by the now infamous Noah Webster (originator of the Webster Dictionary). But much more was soon to be learned about yellow fever as medical climatologists and medical topographers combined their theories and produced a number of novel geographic theories for yellow fever. (see this Global Warming review at http://wp.me/Puh6r-3Z1 😉
Two of the most important of these theories became popular in the young United States throughout the early to mid-19th century (https://brianaltonenmph.com/gis/historical-medical-geography/1814-the-latitude-of-pestilence/ ). One of these theories stated that the destruction of forests was causing this "black plague" through global climate change, induced by noneother than God Himself. But quite soon, as quarantine practices were perfected, this theological explanation was dropped and most people began adhering to the preachings of physicians and scientists instead.
Quite early in this period of the use of climate and topography to explain disease, latitude worked very well in helping us understand the relationship between particular diseases and the time of the year, seasons and climate. During this time, medical geography reached its peak in performance both as a medical profession and as a natural science study.
The realization that sanitation was important is certain diseases developed took center stage between 1850 and 1860, by the end of which the earliest organism or animalcule and sanitation theories developed. It was during this time that physics impacted medicine as well, in particular the physics and laws used to describe and explain the earth’s magnetic fields. In the 1860s, the popular culture aspect of this claim led British military physician and geographer Robert Lawson to go one step further with the theory by trying to explain the remaining observations about latitudinal behaviors of disease based on a new rendering of the earth’s magnetic fields, in turn creating a new longitudinal disease theory.
Lawson used the recently discovered global magnetic field flux behaviors made by Faraday to explain how changed in disease patterns happened (some might even call this an early predecessor to today’s El Nino theory). By following a north-south pole route, as magnetism fluctuated to the east and west due to surface feature differences, it changed local climates, local energies, and made certain regions more susceptible to natural events than others. He used this to explain the deviations seen in certain disease patterns (https://brianaltonenmph.com/gis/historical-disease-maps/robert-lawsons-pandemic-waves-theory-and-map-ca-1864-1875/ ). He then duplicated Faraday’s map renderings of these terrestrial magnetism lines, and re-named them "Pandemic Isoclines" on his disease map, which was subsequently published and thereby popularized.
Like any popular culture, Lawson’s theory died out, and his historically important map forgotten (but posted on my site just noted).
For several centuries now, scientists and doctors have observed diseases travel from the tropics to the temperate zones of the world. These earliest reasons given for this migration based temperatures and climate during the 1700s and 1800s were transformed into a host-vector-pathogen theory and a sanitation theory by the 1880s.
In either case, the migration of certain diseases remained south to north, beginning at or below the equator, and initiating in less developed tropical and southern temperate zone developing countries. Today we define this to be due to an ecological theory involving all of the carriers and initiators of these illnesses.
The distribution of global population and population density patterns in the upper left map, displayed here, demonstrates how and why this migration happens, and shows us that it is in fact inevitable in a sense. There are less people to be impacted by a disease that travels south, much more to the north. Thus the survival of the pathogen and its end product for us–vectored and non-vectored viral and bacterial diseases. Transportation of hosts and vectors, by air, water, ship, plane, or infected humans, defines the changes in longitudinal distributions for these public health concerns.
See on Scoop.it – Medical GIS Guide
October 19, 2014
Posted by Brian Altonen, MPH, MS under Uncategorized
Comments Off on Medical Geography and Disease Surveillance
To best understand the variety of applications of GIS in public health maintenance and surveillance, there are numerous sites worth visiting. To see all of these applications in one place, from past to present, I produced a site that is now passing the decade mark. Many of the topics here have have never been covered extensively before. This site receives between 200 and 300 visitors per day.
Source: brianaltonenmph.com
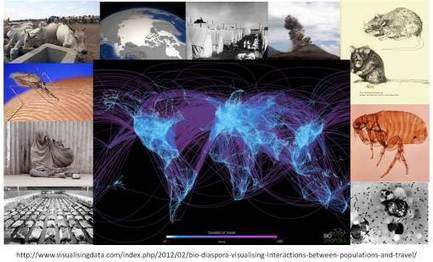
An important thing about African disease outbreak and migration is understanding how it travels, where it travels to and why. Contemporary epidemiologists tend to believe they have the diffusion process down, as a transportation related feature. There are several hundred analyses I performed on the different disease migration patterns. Over the past decade I posted hundreds of links to about half of these maps and videos, fully posted, but not indexed, on my YouTube site. —– Three of these stand out as sources for lessons about Ebola’s possibly diffusion pattern. —– The monkey pox comes from a similar region, is viral, and shows hierarchical peaks around the U.S. Where in migration has defined it potential new misuses around the country. These misuses are also possible for ebola outbreak as a human population density-travel event. —– The Plague IP map is plague diffusion normalized to population density. It demonstrates the peaks we are more expecting of. —– The third map depicts ebola claims, based not on the disease, but on where individuals underwent rule outs, exams, blood testing and the like. —– The remaining information consists of links to numerous pages on the the Monkey Pox itself, the African disease in-migration issue, and the background on my NationalPopulationHealthGrid project. —– Monkey Pox. http://m.youtube.com/watch?v=1amd_QP3YHU Plague, independent (non-krigged) prevalence http://m.youtube.com/watch?v=A78AZDxO0II. Ebola claims in the past: http://m.youtube.com/watch?v=RfvUQfYLlvM. CDC page on Monkey Pox http://www.cdc.gov/ncidod/monkeypox/. WHO page on monkey pox: http://www.who.int/mediacentre/factsheets/fs161/en/. MedicineNet info page: http://www.medicinenet.com/script/main/mobileart.asp?articlekey=23611. MedScape info page: http://emedicine.medscape.com/article/1134714-overview. Emerging diseases from Africa: Emerging Infectious Diseases from the Global to the Local Perspective: A Summary of a Workshop of the Forum on Emerging Infections. http://www.ncbi.nlm.nih.gov/books/NBK99567/. Morens DM, Fauci AS (2013) Emerging Infectious Diseases: Threats to Human Health and Global Stability. PLoS Pathog 9(7): e1003467. doi:10.1371/journal.ppat.1003467. http://journals.plos.org/plospathogens/article?id=10.1371/journal.ppat.1003467 Anthony S. Fauci. January 2006. 2005 Robert H. Ebert Memorial Lecture Emerging and Re-emerging Infectious Diseases: The Perpetual Challenge. http://www.milbank.org/uploads/documents/0601fauci/0601fauci.html National Geographic. BOOK TALK Every Newly Emerging Disease Like Ebola Begins With a Mystery. One crucial factor in the epidemic spread of Ebola is poverty, says author of a new book about the disease. http://news.nationalgeographic.com/news/2014/10/141005-ebola-quammen-west-africa-dallas-gates-foundation/ Social and societal health issues in Pacific Northwest. https://brianaltonenmph.com/gis/population-health-surveillance/production-examples/regions-and-health/part-v/ Medical Geography and Disease Surveillance. https://brianaltonenmph.com/gis/ Extensive coverage of my exceptionally fast mapping technique for national and regional stats on public health issues, at http://nationalpopulationhealthgrid.com/author/altonenb/.
See on Scoop.it – Medical GIS Guide
October 17, 2014
Posted by Brian Altonen, MPH, MS under Uncategorized
Comments Off on Two “River fever” outbreaks (Ebola?): Zaire/Congo River, 1816, Niger River, 1841
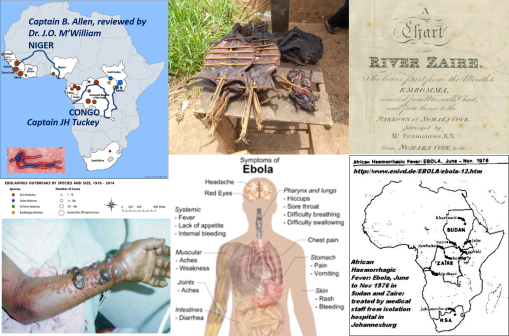
There are two important historical epidemics to note that are very similar to Ebola. The first took place in 1816 along the Zaire/Conga River. The second along the Niger River where it connects with Tschadda. These are both epidemics that began with fever outbreaks, but which led to a high fatality rate and had symptoms that demonstrate a unique form of internal organs deterioration that other fever epidemics do not normally present with. Fewer cases demonstrated the internal blood mass formations seen in the more contemporary outbreaks. The most resemblance between these two outbreaks are their dates of initiation, days until fever symptoms, speed of spread to their others in the teams, and time until death. Both were also colloquially termed “River Fever” These support my premise that the Ebola and some similar diseases have been around since they were first noted by the Portuguese missionaries in the 1690s. Both of these overlap with the geographic distribution that we currently are familiar with, and are consistent with the topography, ecology and human population features determining how this disease may be spread.
In a related posting, I provided the map depicting German medical cartographer Friedrich Schnurrer’s interpretation of what he learned about the Congo River epidemic documented by a Portuguese missionary leader Fr. Anton Zuchelli (1696). (see https://brianaltonenmph.com/2014/10/14/is-there-an-early-history-for-ebola-preliminary-review-says-yes/ )
The following are the notes contained in reviews of the two writings pertaining to the above mentioned Ebola-like experiences.
CAPTAIN JAMES HINGSTON TUCKEY, 1816
The first is regarding the September to October 1816 Congo or African Fever epidemic experienced by Captain James Hingston [Kingston] Tuckey:
[QUOTE]
“The crew consisted of eight petty officers, six artificers, fourteen able seamen, a serjeant, a corporal and twelve privates of marines making in all fifty six persons, of whom twenty one were doomed never to return. ‘Never’, says the editor, ‘was an expedition of discovery sent out with more flattering hopes of success, yet, by a fatality almost inexplicable, never were the results of an expedition more melancholy and disastrous.’ Captain Tuckey Lieutenant Hawkey Mr Eyre (purser) and ten (eleven) of the Congo’s crew — Professor Smith, Mr Cranch, Mr Tudor, and Mr Galwey, (a volunteer), in all eighteen persons, died in the short space of three months! Two had died in the passage outwards and the serjeant of marines survived only till the vessels reached Bahia.”
[END QUOTE]
Note: Captain Tuckey was taken ill September 17, died October 4, 1816.
Source: Art IV. Narrative of an Expedition to explore the River Zaire usually called the Congo in South Africa in 1816 under the Direction of Captain JH Tuckey . . . to which are added, the Journal of Professor Smith, some General Observations on the Country and its Inhabitants, and an Appendix containing the Natural History of that Part of the Kingdom of Congo through which the Zaire flows. Published by permission of the Lords Commissioners of the Admiralty 4to London 1818. Book review in ‘The Quarterly review (London)’, January 1818. See http://books.google.com/books?id=y3i1-YybvCAC&pg=PA335
***************************************************
CAPTAIN B. ALLEN, 1841
This is regarding the Deaths from September to October 1841, at the confluence of the Niger and Tchadda, where Captain B. Allen and the crew were heavily infected, one third deceased, reviewed by Dr. J.O. McWilliam [M’William].
[QUOTE]
“Of the one hundred and forty five white men, only fifteen escaped the river fever; while of the one hundred and fifty-eight blacks, only eleven were attacked. The number of deaths is not clearly shown; but what from fever and other casualties, the tables appended show a total of fifty-three, among whom were Captain B. Allen, Lieutenant Stenhouse, Dr. Vogel, Mr. Kingdon, Mr. Willie. Mr. Wilmett, and two of the assistant surgeons.”
[END QUOTE]
Source: Chambers’ Edinburgh Journal, Volume 12, Sept. 9, 1843.
http://books.google.com/books?id=G7MaAQAAMAAJ&pg=PA265
(Note: this Ebola is not as deadly as the current).
For the next several years, “Niger Fever” was a terms used to defines these unique cases presenting along the Niger. Eleven major publications refer to this term for the diagnosis,, including The Lancet, British and Foreign Medical Review or Quarterly, Medico-Chirurgical review, and Edinburgh Med Surg Jl. It is also contained in Robley Dunglison’s 185 Medical Lexicon. See also John Forbes (ed.) book review in Brit. For. Med. Rev. Q., July 1843, at http://books.google.com/books?id=B_AEAAAAQAAJ&pg=PA259 😉
Supporting documents for these fevers being quite different from yellow fever, malaria, and numerous other more common fevers are contained in McWilliam’s Autopsy notes, details of which were published in his book and as part of the combined book review found in the Edinburgh Med. Surg Jl., 1845, v 63). Link: http://books.google.com/books?id=t_8aAQAAMAAJ&pg=PA432 ; another version http://books.google.com/books?id=-Vo9AQAAMAAJ&pg=PA392
See on Scoop.it – Medical GIS Guide
October 14, 2014
Posted by Brian Altonen, MPH, MS under Uncategorized
Comments Off on Is there an Early History for Ebola? Preliminary review says ‘Yes.’
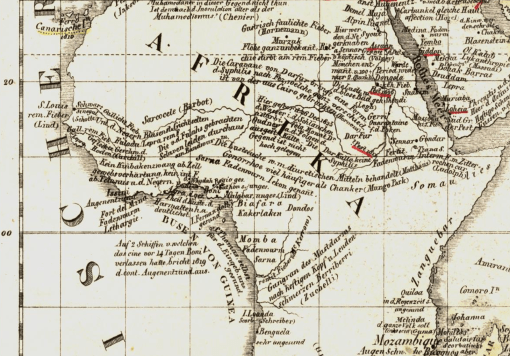
A section of the first disease map of the world. From Friedrich Schnurrer’s ‘Charte über die geographische Ausbreitung der Krankheiten: vorgelegt der Versammlung Deutscher Aerzte und Naturforscher zu München’, Published 1827.
In 1827, Friedrich Schnurrer’s ‘Charte Uber die geographische Ausbreitung der Krankheiten’ was published detailing his summary of diseases around the world. Schnurrer wasn’t the first to study disease patterns globally, he was simply the first to place all of his notes on the world diseases and epidemics he know and read about onto a single map.
One of the earliest essays on disease and place, in terms of the planet, was the work of Johanne Christophor Homann, with his Medicinae Cum Geosophia Nexu [the Medical-Geography Connection], 1720. (see my page – http://wp.me/Puh6r-7MS 😉
The next massive tome published on disease patterns was by the famous author and printer of a very young United States, Noah Webster, who wrote a compendium on the history of the outbreaks around the world, all in an attempt to define geographic and climatic reasons for their recurrences (link below). His book served to explain how and why the United States was experiencing numerous, deadly yellow fever epidemics, which were referred to as the "black plague" at the turn of the century. Webster’s have a natural explanation for all of these events ensuing around the world, blaming the diseases on volcanoes, massive storm patterns, earthquakes, increased global heating by the sun, and yes, environmental and climate change (for a review of Webster’s theory of weather change patterns, deforestation, and climate change, see: Deforestation and Global Cooling: A New Theory for Disease by Noah Webster, 1810, at http://wp.me/Puh6r-3JA (2012); and http://www.smithsonianmag.com/ist/?next=/history/americas-first-great-global-warming-debate-31911494/ (2011)).
in 1813, Schnurrer wrote ‘Geographische Nosologie oder di lehre von den Veränderungen der Krankheiten’ , that is to say, with brevity, knowing the geography of certain disease types.
which set the stage for his next important publication, the map of world diseases published in the 1828 Das Auslan (full citation with link to scanned copy at the end).
My purpose for reviewing this map and Schnurrer’s earlier work was to determine if there was any evidence for Ebola found on the map, and/or in the earlier writings by Schnurrer on the global disease patterns documented in explorers’, settlers’ and travelers’ writings.
The way Schnurrer and others for the time defined disease patterns was by their place of natural existence, known as the nest or nidus for a disease, and by their placement on the earth in relation to its latitudinal patterns, used to describe airflow and climate, the weather associated with the disease patterns documented for the time, and the local topography and natural ecological settings that the authors linked to these disease pattern observations.
Only the map will be reviewed for the moment.
The current behavior of Ebola shows that it is staying north of the equatorial line. If we review the diseases of this region, we find thirty nine distinct disease descriptions given for illnesses common to Africa between 0 and 30 degrees north. That part of African between the 0 and 20 degrees latitude line is for the most part equatorial in nature. Two attacks of "pestilence" are noted in this "torrid" or tropical zone (as later medical geographers referred to it), one epidemic each for the years 1696 and 1811. Since both of these are along the eastern end of upper Africa, they are rule out as Ebola possible ebola events for now, even without reviewing their symptomatology .
Throughout the north torrid region, there are numerous disease types defined symptomatically by Schnurrer as fevers, bearing the word fiber in their categorical name assignments ("Fieber", abbrev. as "Fieb.", "f" or "F."). The Pox is also noted ("Poken", with a brief reference to the "Quarantaine" performed). Numerous forms of venereal disease are displayed (abbrev. "v.d." or identified by their namesakes–syphilis and gonorrhea).
To differentiate the large number of fevers that appear on this map, the related symptoms noted are helpful. Galliche Fieber is yellow fever, that by Senegal is "common to the Negroes. . . ). Galliche rem[ittent] fever is possibly yellow fever, but also possibly malaria (remittence refers to cycling). A number of intestinal worm or "animalcule" diseases are also worth noting ("Faden ~~").
Just south of the equator is Gangran des Mastdarms nach heftigen Kopf u. lenden schmerzen Berriberri (Zuchelli). It is displayed along and south of the Congo River. From its name we know that it could be called the "Gangrene de Mastarms", a necrosis or gangrene of the entire intestinal tract commonly linked to some form of diphtheria by the late 1800s (see Semple, 1879). The descriptive portion of this disease name is "hestigen Kopf u Lenden schmerzen Berriberri", which translates to "vehement head & lumbar pain beriberi", the last section implying an appearance of beriberi–appearing cyanotic and about to die. (see http://renovatingyourmind.com/2013/03/25/renovating-your-minds-makes-a-social-call-to-the-first-member-of-the-b-complex-family-b1-thiamine/beriberi-alcoholism-thiamine1-deficiency/ 😉
This is possibly the first documentation of Ebola as a disease native to the Congo River on a map, by Missionary Father Antonio Zuchella in 1696 (Benicken, 1824), in what it now the DR Congo.
*******************************************************
REFERENCES (if not in the above text).
A BRIEF HISTORY OF EPIDEMIC AND PESTILENTIAL DISEASES ; WITH THE PRINCIPAL PHENOMENA OF THE PHYSICAL WORLD, WHICH PRECEDE AND ACCOMPANY THEM, AND OBSERVATIONS DEDUCED FROM THE FACTS STATED. IN TWO VOLUMES. BY NOAH WEBSTER,
At http://english.byu.edu/facultysyllabi/KLawrence/WEBSTER.briefhistory.pdf
Geographische Nosologie oder die Lehre von den Veränderungen der Krankheiten … 1813. By Friedrich Schnurrer. http://books.google.com/books?id=W84UWCIi3qMC
1824. Das Auslan. Ein Tagblatt fur Kunde des geistigen und sittlichen Lebens der Volker mit besonderer Rucksicht auf verwandte Erscheinungen in Deutschland. Erster Jahrgang. Bd. 1-2. Munchen der Literarisch-Artistischen Anstalt der J. G. Cotta’schen Buchhandlung. 1828 / /
Der Verleger Johann Friedrich Cotta …, Volume 1, Issues 1787-1814,
edited by Deutsches Literaturarchiv / /
Nr. 90, volume 30. 22 Sept 1827, S. 357-359. Die geographische Vertheilung der Krankheiten, vorgelsesen in der Versammlung Deutscher Aertze und naturfirscher zu Munschen den 22 Sept 1827 (S. 3570359). Charte uber die Georgraphische Ausbreitung der Krankheiten von Frid. Schnirrer Med. Doc. Vorgelegt der Versammlung Deutscher und Naturfischer zu Munchen den 22 September 27. Lithographie. 1 gefalt. Bl. 2).
Title: Charte über die geographische Ausbreitung der Krankheiten: vorgelegt der Versammlung Deutscher Aerzte und Naturforscher zu München
The map is available for viewing and download at:
http://archive.thulb.uni-jena.de/hisbest/receive/HisBest_cbu_00025637
Robert Hunter Semple. 1879. On diphtheria
http://books.google.com/books?id=5RkDAAAAQAAJ&pg=PA59
Zeitrechnungs-Tafeln für den historischen Handatlas: Mit steter Rücksicht …
By Friedrich Wilhelm Benicken . 1824.
http://books.google.com/books?id=P7lRAAAAcAAJ&pg=PA135
Reference noted in the book (sic): "Deo Pater-Merolla Reife nach Congo. 1696. Der Miffionar Ant. Zuchelli bereifet Congo. – Die Portugifen werden vom Kuatenhandel verbrängt, behalten jedoeh Mazagan und die vier Guinea-Infeln."
See on Scoop.it – Medical GIS Guide
Next Page »
