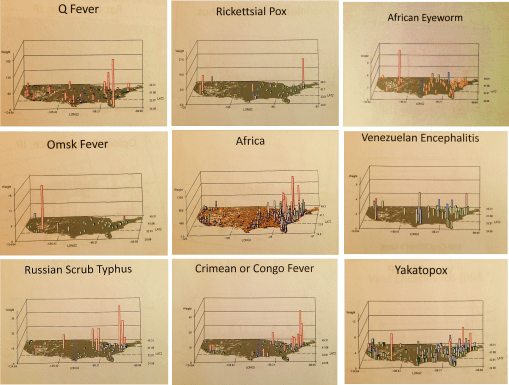
African-U.S. Disease patterns, from NPHG (the National Population Health Grid mapping project)
Source: news.yahoo.com
We COULD, or is it SHOULD, already have the answer to this question!
No doubt the CDC, NIH and WHO have some of the best people and tools in use to evaluate this potential epidemic problem.
At the public health level, if no such programs are in place regionally or within urban-metropolitan regions, the hubs of international commerce and travel, it is probably way too late to get anything started for this season. When asked how long it takes for me to establish a workstation from scratch, my guestimates based on experience are several weeks to, unfortunately, up to a year to develop and test, assuming the agency has a fairly poor infrastructure in place.
The infrastructure requirements for mapping a serious disease migration like that of Ebola requires more than just a basic demographics, transportation, and overall health patterns geographic information systems. Ecological data has to be completely included with this Integrative Disease Management (IDM) geographic information system. I favor phytoecological mapping due to correlations that can be drawn between vegetation regions and host-vector patterns. The skills of Pavlovski and Voronov of the Russian fields of study in human ecology, macroecology and disease geography drew together some of the most important ideas in spatial zoonotic disease patterns that have yet to be made a part of a daily system in most U.S. surveillance systems (see https://brianaltonenmph.com/gis/historical-disease-maps/zoonoses/ ).
The essential skills of mapping required for preparing for Ebola or any other in-migrating disease pattern, requires a complete and extensive review of these natural events, both in the natural setting and within the human ecological setting. Studies of lyme and west nile in the U.S. for example, using NLCDs, remote sensing and climate analyses, show these techniques could provide important insights into certain types of disease patterns. The mapping of all of the rare to infrequent zoonotic disease patterns for the U.S. (like some of those pictured above), yellow fever (https://www.youtube.com/watch?v=qH_cWGT8QbE&feature=youtu.be ), the distribution of diseases that logically came in by airline such as internationally induced elevation sickness (https://www.youtube.com/watch?v=PPeiDkhrgkI&feature=youtu.be ), and something as seemingly unrelated as hurricanes and tornadoes, produce findings that can be applied this work as well. [See sections of my extensive Pacific NW coverage as well– https://brianaltonenmph.com/gis/population-health-surveillance/production-examples/regions-and-health/part-iv/ ]. Could it enter via Mexico? Another disease evolved natural to that region could provide us with insights into how extensive in-migration travel is for the U.S. (https://www.youtube.com/watch?v=fcDTC-fXhg0&feature=youtu.be  ;).
At one point I produced a series of international migration maps using two types of formulas, one focused on the basic migration patterns ecologically and environmentally defined, the other inclusive of diseases from other countries that are primarily people related, not necessarily vector or animal related. The latter provided insights into how people travel from Africa (and other main regions or continents) to the US, and probably who upon arrival had to be assessed for something they may have brought in with them (recognizing “rule outs” as an important part of claims related behaviors in EMR is important to know).
My NPHG 3D map video on Ebola demonstrates the “rule out” effect in the claims contained in EMR: https://www.youtube.com/watch?v=RfvUQfYLlvM
More of this In-migration Disease series of NPHG videos, using several unique areal and grid mapping algorithms I developed, is at:
https://www.youtube.com/playlist?list=PLWrApErk5bybFfsOWTXWjlwvIM7D4d6-h
So, at the risk of repeating myself too much, I recommend the following [NOTE: at this site, the non-Youtube sites with my name attached, already on this page, may not open depending on your device; so scroll down or hit HOME above to see all of them]:
The Latitude and Longitude of Ebola.
https://brianaltonenmph.com/2014/06/24/the-latitude-and-longitude-of-ebola/  (seen on this page, below);
Current Ebola Outbreak Is Now The Worst In History And ‘Totally Out Of Control’. http://www.scoop.it/t/global-health-care/p/4023600494/2014/06/25/current-ebola-outbreak-is-now-the-worst-in-history-and-totally-out-of-control
http://www.pinterest.com/altonenb/epidemics/
. . . and concerning dozens more vectored and non vectored diseases out of Africa, such as Chikungunya (if link is disabled or blocked, see June 9th entry below):
The behavior of such a disease were it to come in through Chicago like MERS did (again, see below):
And “the methods to my madness”:
https://brianaltonenmph.com/about/grid-economics-and-population-health-work-experience/
But if you don’t want to listen to me, see:
‘outbreak’ at Tumblr. http://www.tumblr.com/search/outbreak/recent?language=en_US
Mapping Ebola’s Deadly Spread (Huffington Post). http://www.huffingtonpost.com/2014/06/20/ebola-map_n_5516406.html
Brief General History of Ebola.
https://web.stanford.edu/group/virus/filo/history.html
