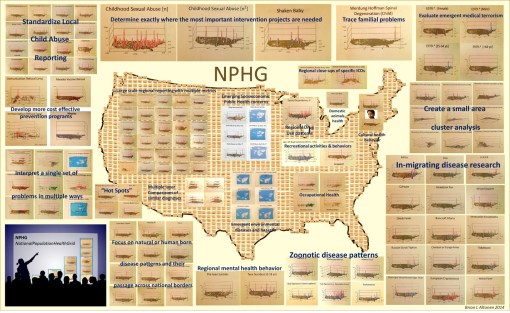
These are examples of a number of programs/HIT-GIS projects I developed and implemented as part of my National Population Health Grid (NPHG) program. The purpose of NPHG was to demonstrate potential uses for GIS in population health analysis, as a part of the managed care system, in a way that focused on the combined annual, quarterly and ad hoc reporting needs typical of the Meaningful Use, QIA and PIP programs that many health care systems engage in. The Managed Care HIT-GIS (or Medical GIS as some are now calling this process) focuses on the EMR/EHR differently than population health, epidemiology and environmental health programs.
There are five tasks to keep in mind when trying to implement a GIS for use by a managed care program.
The first task is it must be able to report meaningful use outcomes and any outcomes for special studies engaged in for quality improvement or performance improvement using local, regional maps. Preferably, two maps must be reproducible. The first is the standard zip code choropleth like map depicting distributions of people, patients and specific health related issues. The second is a map developed for internal use that depicts the same, only at the small area, intervention level, for use in targeting your services, defined needs, gaps in services with more precision.
The second task, is the system has to establish a monitoring and surveillance process, meaning that the GIS can be used weekly, monthly or ad hoc when specific questions are asked. This is mostly a descriptive use of GIS, meant to serve curious healthcare providers trying to compare their program or services and outcomes to those of their competitors, of for directors and officers to use to evaluate quality and cost related features for given people, programs and regions. The ideal surveillance program in a managed care setting would of course be live, an outcome that is possible with the right software and data management packages, the right skillset, and the right services from the software providers (I have seen just one or two managed care settings where all three of these are happening.)
The third task is to be able to predict in what direction specific forms of services are heading, such as a growing need for cancer screenings of the 50+ age group, or changes in immunization demands by specific neighborhood clinics and cultural settings. The use of multivariate analyses in combination with GIS spatial modeling algorithm, in both linear and non-linear, polynomials are the preferred ways to go when developing these algorithms. The most accurate long term models I have found, and shown, are initially polynomial in nature with a total of 6 or more independent (unlimited) and dependent (2 or 3 max) variables, merged with an exponential equation used to define a similar outcome, but initiated just before the decay portion of the polynomial modeling ensues, thereby allowing for longer periods of prediction (I made previous postings about this regarding my more accurate way of predicting the 2014-2015 Ebola outbreak).
The fourth task is to provider upper level managers on up to CEOs, VPs and Presidents the visualization needed to bring the points of your research home, as a medical GIS spatial statistician. This means that the upper level “leaders” must be savvy in their population, its data, the ways this data can be presented, and able to interpret any representation they are handed pulled from SAS, Cognos, Qlik, or GIS.
The fifth task is to document your finances, management, human resource and service industries, in a way that can be analyzed and monitored over a 10+ year period. As a part of this upkeep, HR (and the managers they report to, make suggestions to) should become more responsible with mining for and utilizing their most valuable human resources.
To date, software, management knowledge base, management skills, and indirectly HR skills or lack of action have been responsible for the failure of HIT to advance enough to allow for rapid advancements in HIT-GIS to ensue.
It is now fifteen years into the popularization of the “Managed Care” philosophy for health care. The current QI programs, Beacons, MCs and such that oversee changes in the healthcare system have remained slowly-progressive. This in part is due to employee turnover, repeated software changes, data warehouse challenges, outsourcing based losses in important employee skills. But it is management that produced the greatest barriers against HIM/HIT development involving a very productive HIT-GIS system.
Due to poor management, the most skillful employees when it comes to GIS are rarely used fully or effectively. This results in reduced employee retention, further reducing the institution’s momentum in this field. The lack of managers with adequate GIS training further complicates this problem. Experience and success are a necessity, if a manager is to have a worthwhile goal in mind, that is also advanced. This barrier in turn results in a further loss in momentum and ultimately the opportunities for discovery and creation at the corporate level are lost.
My preliminary review of the roles of GIS and GIS-trained people in a managed care system demonstrate that most large companies have one or a few individuals highly skilled and knowledgeable in GIS, Medical GIS, HIT-GIS, and spatial analysis, with few used to their fullest potential (if they are working with GIS at all.). Management’s the lack of knowledge of the potential value of GIS and these employees is the primary reason HIT is not advancing as quickly as we hope, and will certainly not lead to any major innovations in the near future for any current HIT-GIS program’s status. (They must be able to produce hundreds of maps per day program).
The talent, resources, skillsets and knowledge base are there; it is up to management to catch up with this technology.
See on Scoop.it – Medical GIS Guide
