See on Scoop.it – National Population Health Grid
With an efficient disease mapping and surveillance program you can monitor the effectiveness of your health care system for the groups that are most needy, the socioeconomic and ethnic or race groups we usually pay less attention to than we’d like because we don’t have the manpower and time needed to evaluate all of our PIP and HEDIS measures for special needs populations.
With the best use of HIT and Big Data, you can routinely monitor each of these groups for hundreds of metrics that are specific to their areas of high risk. With the right system, we can easily produce annual and even quarterly reviews of topics like African American, Asian American, Hispanic, or Native American health needs, and/or monitor our low income, special needs populations and our highest risk chronic disease patients.
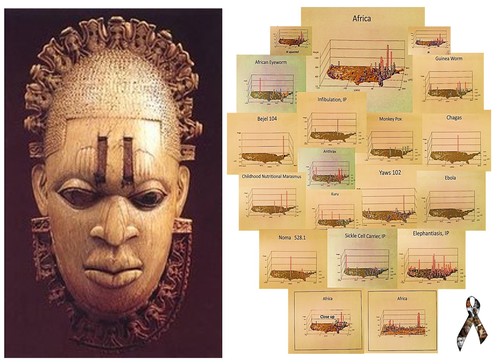
For example, more than 100 key indicators were identified for monitoring for the African American culture. They included diagnostics and V-code and E-code entries, and specific ongoing physical, cultural and mental health measures normally not focused on for this particular group.
A few examples of unmonitored diagnoses. and potential long term health or QOL risks faced by the African American patient population are demonstrated by the following short videos.
African Eyeworm — http://youtu.be/dSP6tOQs-RQ
Bejel — http://youtu.be/RI9Z0HXZFUg
Ebola — http://youtu.be/RfvUQfYLlvM
Crimean or Congo Fever — http://youtu.be/YWuMBOdB08k
Guinea Worm — http://youtu.be/YwSnpT7hAI8
Obscure African Cardiomyopathy — http://youtu.be/90XMDpr-fZ4
Kuru — http://youtu.be/x4VR1rf6C78
Elephantiasis — http://youtu.be/Uc6zvqutU3g
Elephantiasis, IP — http://youtu.be/-SS43bqFqvM
Sickle Cell Carrier — http://youtu.be/q7U9Z91ljRU
Yaws — http://youtu.be/SsMQNsxOkSE
