See on Scoop.it – Episurveillance
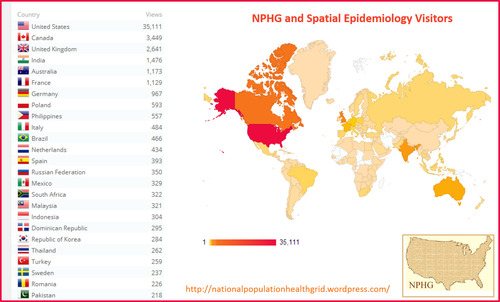
This is a description of the visitors of my NPHG sites over the past year. This site has been in operation now for more than 5 years and receives anywhere from 5,000 to 10,000 visitors per month depending on the academic period, with peaks on primary lecture and/or regional and national spatial health conference and seminar dates. As expected, the usual countries to visit my site on a daily basis are US, England, Canada, India, Australia, China, and parts of South America.
My major inspirations for the topics I cover at this site come from real experiences mapping costs, claims, billing and fraud, prescription drug patterns, age-gender-ethnicity relationships, and most ICDs, V-codes and E-codes considered hot topics or linked to important social issues in today’s day and age. Like always, I make it a point to focus on the less obvious, metrics that are normally underrepresented but important to understanding the US health care system. I developed this unique mapping technique more than ten years ago.
My NPHG spatial mapping site is at http://www.pinterest.com/altonenb/nphg-the-news/
My more frequently visited educational site is http://brianaltonenmph.com
My videos of the rotating 3D US maps of epidemiology are being posted at https://www.youtube.com/user/altonenb/playlists
These are the only sites where hundreds of examples of my NPHG 3D disease mapping algorithms are demonstrated, nationally and at the small area level.
See on www.pinterest.com
