See on Scoop.it – Medical GIS Guide
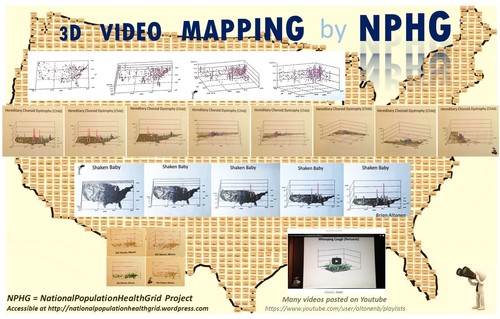
National and regional NPHG Video mapping. NPHG depictions of everything from people to cost and utilization in managed care may be presented as national, regional or close up images. The uses for these techniques are diverse and are applicable to the insurance, healthcare, health economics, and PBM industries.
During the late 1990s (ca. 1997), a number of west coast reviews of GIS included research teams devoted to animated mapping. Within a year, a leader in this field was Sonoma College in California, where GIS was successfully used to map out crime in an animated fashion (Lodha and Verma 1999). The same year, a University of Georgia student completed his assessment of the same for evaluating densely populated urban settings (Beavers 1999). In 2003, Bidoshi (2003) completed his dissertation on the virtual visualization of mapped data at Ohio State University. By 2009, Yale University students at G-Econ created a 3D global mapping program based on spherical geometric formulas.
The use of three-dimensional GIS for tracking population features is now more than 15 years of age. Its most common uses have been mapping crime and demographic features. Recent works by Alfarhan (2010), Kim (2012), and Zhang (2012) suggest that new cloud and EMR technology might pave the way for the development of more successful use of this Medical GIS technology.
This is the purpose of the NationalPopulationHealthGrid (NPHG) program I developed. NPHG algorithms produce maps on population health that are much faster to run than the traditional methods already in place for developing these maps. NPHG is designed for use in weekly and daily reporting on hundreds to thousands of population health metrics.
References
Alfarhan, M. S. (2010). Geosciences information system (GeoIS): A geospatial paradigm for real and virtual three-dimensional worlds. (Order No. 3414888, The University of Texas at Dallas). ProQuest Dissertations and Theses, , 135. Retrieved from http://search.proquest.com.proxy1.ncu.edu/docview/734622078?accountid=28180. (734622078).
Beavers, R. M. (1999). An evaluation of cartographic visualization’s utility in the spatial analysis of urban social dynamics. (Order No. 3022089, University of Georgia). ProQuest Dissertations and Theses, , 164-164 p. Retrieved from http://search.proquest.com.proxy1.ncu.edu/docview/304516996?accountid=28180. (304516996).
Bidoshi, K. (2003). Virtual reality visualization for maps of the future. (Order No. 3088842, The Ohio State University). ProQuest Dissertations and Theses, , 186-186 p. Retrieved from http://search.proquest.com.proxy1.ncu.edu/docview/305319198?accountid=28180. (305319198).
Kim, I. H. (2012). Developing high performance GIS simulation models on geospatial cyberinfrastructure: a case study of population change models with grid computing and cloud computing technologies. (Order No. 3545065, University of California, Santa Barbara). ProQuest Dissertations and Theses, 250. Retrieved from http://search.proquest.com.proxy1.ncu.edu/docview/1237250056?accountid=28180. (1237250056).
Lodha, Suresh K. and Verma, Arvind . 1999. "Animations of Crime Maps Using Virtual Reality Modeling Language." Western Criminology Review 1 (2). [Online]. Available: http://wcr.sonoma.edu/v1n2/lodha.html.
Nordhaus W. (2009). Geographically based Economic data (G-Econ), Yale University. Accessed at http://gecon.yale.edu/
Nordhaus W. (2009). G-Econ Project, Yale University, September 2009. http://gecon.yale.edu/g-econ-project-yale-university-september-2009.
Zhang, C. (2012). Interfaces and visual analytics for visualizing spatio-temporal data with micromaps. (Order No. 3504130, George Mason University). ProQuest Dissertations and Theses, , 156. Retrieved from http://search.proquest.com.proxy1.ncu.edu/docview/1011001290?accountid=28180. (1011001290).
See on wcr.sonoma.edu
