The reports of declining rates of new Ebola cases in Liberia, announced by the World Health Organization on Oct. 29, fueled hopes that the outbreak response is working, but experts are cautioning that it is too soon to believe the epidemic has entered a new phase, with slower growth. Liberia has been one of the hardest-hit countries in the current Ebola outbreak, with more than 6,500 cases and 2,413 deaths reported in that country alone as of Oct. 31. In addition to the perhaps positive news that the rate of new cases in Liberia is not growing, WHO officials said the total number of new cases in all three affected countries — Liberia, Sierra Leone and Guinea — also may be leveling off.
Source: news.yahoo.com
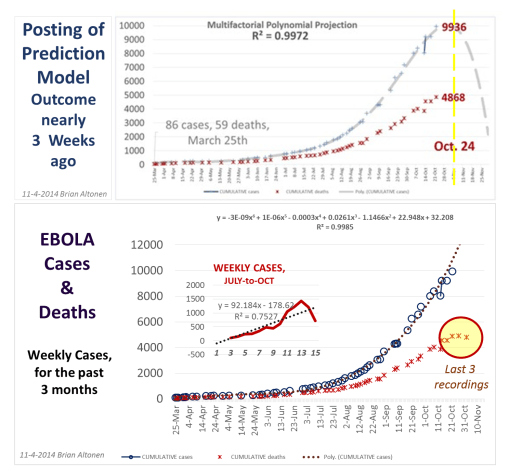
On October 24th I posted this graph with an outcome prediction I had been working with for more than a week. Back in September or early October, October 15th was a date I had defined for needing to see how the Ebola outbreak was behaving, based on the equation I developed.
The best mathematical model for Ebola, produced using non-supervised classification methods for the potential variables involved (an IDRISI GIS-RS term here), demonstrated the possibility that these numbers might begin to decrease. This didn’t really make much sense mathematically, but biologically and in terms of population density, and other numerous geographic requirements, I could accept the sensibility to it, at least from the way the computer was modeling the data.
The non-supervised classification system is opposite of what most other (even myself) like to do with outbreaks, try to define this behavior based on specific well define features, ranging from spatial density patterns to possible barriers, forms of resistance or friction to flow, etc. etc. We like to know what we are measuring and then see how that variable impacted the model. This tends to result in heterogenous, heteroscedasticity in our modeling, something we try to ignore.
The polynomial models developed without predetermining factors do not show these complicators of the equation. They tell it like it is, so to speak. This polynomial says there will be a sudden stop or reversal, and if that happened I would sooner or later need to know why (still haven’t really attacked that issue yet.)
Like others I am curious which way to outbreak is going. Is it ecologically decreasing due to seasonal, environmental and organismal-host-vector-victims change? Or is it decreasing due to saturating the population and impacting the most potential victims, having run out of more victims in the same region?
There is also that spatial behavior in which the organism and disease patterns begins "nesting" in its natural setting once again (staying active where it is most "comfortable", in an ecological sense.) Reducing the size of area it has spread into, concentrating on its best environmental settings in the 3 countries it is currently remaining active in.
See on Scoop.it – Medical GIS Guide
