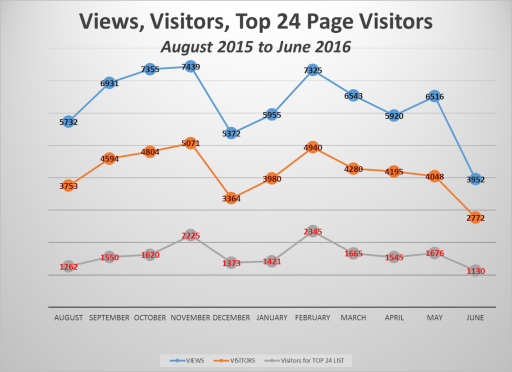
A review of this website performance over the past 11 months suggests, as expected, the academic year is an indicator of visitors. Both winter and summer breaks define the lulls for its use.
As of July 4th, more than 360,000 visits were documented at this site since 2009. It is currently receiving about 90,000 visits per year, representing about 60,000 visitors. The most visited site is page one.
A review of the monthly reporting for pages visited demonstrated there are repeats for certain pages as being the most visited for the month. Tabulating this data produced a table of 24 most visited sites. The two that stood out the most during the past year are my detailed review of the first US Census maps of disease and the historical medical geography article on an outbreak at Martha’s Vineyard in 1763.
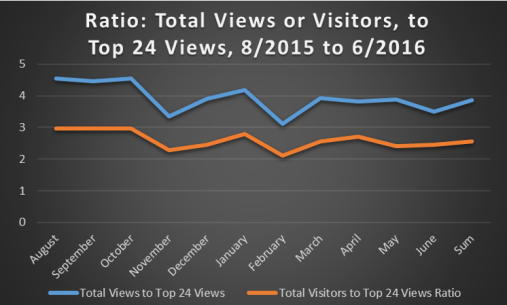
If the ratio of visitors and views relative to the views of these Top 24 sites are calculated, the following numbers are generated based on these three monthly sums.
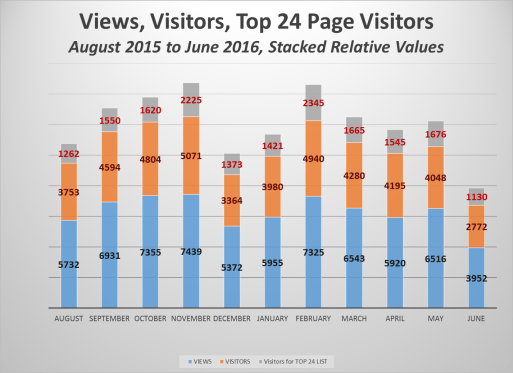
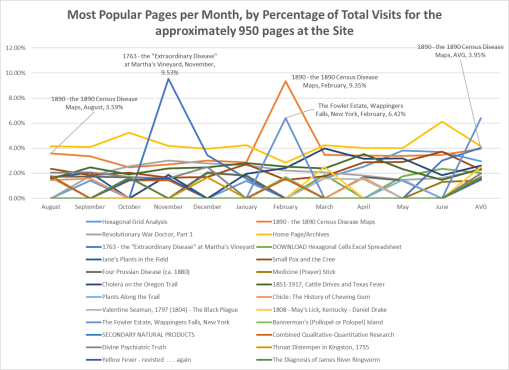
There are approximately 925 more pages that can be viewed at this site. Therefore, a review of these percentages was made relative to total visitors for all pages.
This produced the following percentages of visits that each of the 24 sites represents, on a monthly basis.
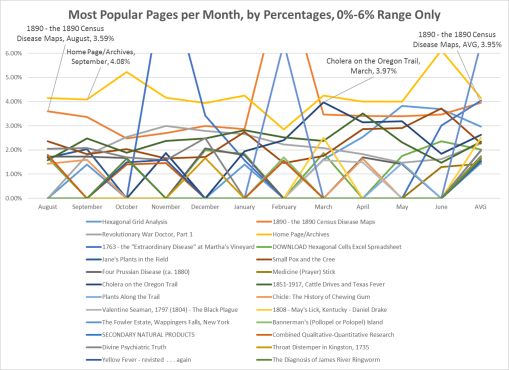
A closer view of the lower values is provided:
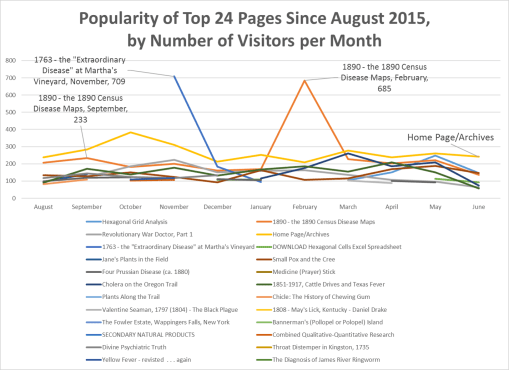
From these results we can determine the most popular topics in historical medical geography and historical medicine.
My site is saturated with coverage of the history of Colonial medicine, centering on the New York area, and so may of these pages pertain to that subject
- Small Pox and the Cree
- Throat Distemper in Kingston, 1735 (early Diphtheria?)
- The Diagnosis of James River Ringworm (Slavery and disease, Thomas Jefferson’s estate; a disease never before evaluated in the historical literature)
- 1763 – the Extraordinary Disease
- Revol War Doctor,
- Jane’s [Colden] Plants . . . ,
- Valentine Seaman,
- the Fowler [initiators of Phrenology] Estate,
- Divine Psychiatric Truth [religion, philosophy and psychology]).
Midwestern and Far West exploration and development are also reviewed extensively, those pages being:
- Cholera on the Oregon Trail (my 2000 MS thesis)
- Plants along the Trail (Oregon Trail medicine)
- 1808 May’s Lick Kentucky (an early geographic interpretation of the Midwest)
- 1851-1917 Cattle Drives and Texas Fever
Historical Mapping
- Valentine Seaman (the first ever disease maps, of NYC yellow fever)
- The diagnosis of James River Ringworm
- Yellow Fever revisited . . . again
- 1851-1917: Cattle Drives and Texas Fever
- 1890 – The Census disease maps
- Four Prussian Disease maps (1890s map)
Several cultural topics received a lot of attention, especially:
- Small Pox and the Cree
- Medicine (Prayer) Stick (Indian medical philosophy)
- Chicle: The History of Chewing Gum (an important Hispanic Heritage study I did from 1988 to 1992)
A stand alone piece I produced was on the history of the late 1890s-1930s ammunitions seller, Francis Bannerman and Bannerman’s Island, which I have family photos and relics from, an important piece of Hudson Valley history
Another important standalone topic is my work on combining qualitative and quantitative research practices for more thorough cultural reviews of community and population health (my current occupation).
This leaves the mention of hexagonal grid modeling, a technique I developed in GIS and applied in winter 2003/4 (unemployed), for mapping environmental chemical exposures in the state of Oregon. I developed the math and theory behind this after beginning work for Medicaid/Medicare in Denver Colorado in 2004. I posted it on this site in late 2009 or early 2010. The popularity of this page immediately jumped to the top of my lists of pages visited.
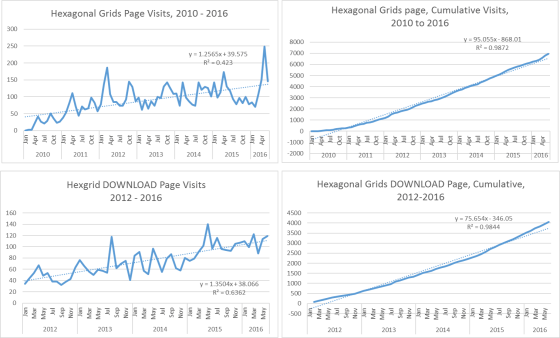
Due to the increase popularity of this topic, I produced the DOWNLOAD page for students to access the excel I used in 2004 to produce my hexagonal grids. (newer versions of this are perhaps due for release; I have an SQL/SAS related version as well developed.) This method of modeling continues to rise in popularity.
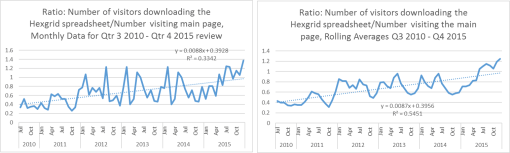
Based on number/percent of visitors to it for downloading the excel file, it continues to increase, with primary interest perhaps being expressed by students enrolled in GIS and/or urban planning and development programs. Based on the feedback I get, most of the support for hex grids remains mostly a practice of western European spatial analysts; for the Americas, its frequent visitors and users appear to be Canadian.
(Time for US urban planners and spatial analysts to catch up!)