The analysis of electronic medical records and the operation of a geographic information system are two very unique sets of skills, which when combined require time and finesse to get to an advanced level with the analyses.
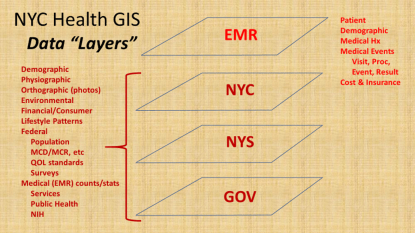
In many ways, the complexity of each as stand-alones are comparable. There are multiple levels of format, complexity and relationship to medical data, which in this EMR system includes “dimensional” databases devoted to
- Patient/Demography,
- Visits,
- Procedures or Events (treated as at least two levels in my models),
- Results, outcomes or findings attached to the prior two, and
- Location (x, y and z)
- Time (t).
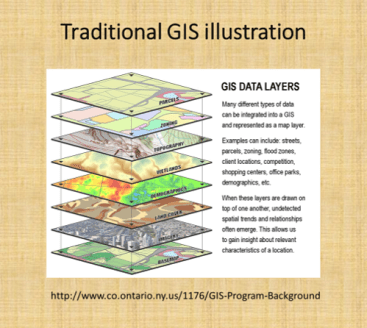
In a traditional GIS, this is comparable to the different “layers” that may be overlaid for analysis, and the “dimensions” at which maps or images can be produced and evaluated using this method.
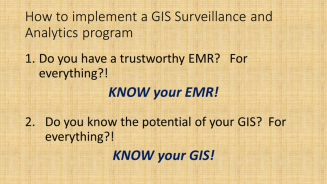
To develop an effective data storage, surveillance, analysis and presentation tool, equal amount of time and effort need to be spent at the EMR and GIS end. You comprise value and quality of spatial produce when too much time is spent on developing an effective EMR, without engaging adequately the GIS-related spatial analysis and presentation potentials of the program.
In traditional GIS classes, twenty years ago, the ability for researchers to use GIS to perform their analyses, besides the traditional Excel with Add-ons, or SPSS, or Stata, or SAS, or S+ to perform the analyses. The early impressions were that GIS could very well make these older, very traditional analysis programs obsolete. However, most recent changes in GIS and Statistical Analysis tools demonstrate the inability of any of these traditional software brands to hybridize their technology with other brands out there.
This is exemplified by the recent change in SAS from the traditional SAS (8.* to 9.*) to SAS Enterprise, without the traditional programming atmosphere offered by the older products. (Hopefully the new SAS will improve, but for now it’s overall value has been reduced by one or two application related levels).
When we look, for example, at the years long attempt to add a GIS option for SAS, in the form of SAS-GIS, the results of this product were quite upsetting, due to the quality of the output and figures, no necessarily the meaning and value of the analytics itself. SPSS is now compromised by its level of complexity, and breakdown into multiple sections of the software subscribed separately. Like a number of drawing programs that did the same, obtaining these forms of software became impossible for smaller groups, making it necessary for more affordable, more productive tools to be developed.
Due to these recent changes, there may never be a perfect mapping environment for adequate population health surveillance and analysis, in fact, a form of EMR-GIS that is equally valuable and applicable across potential EMR-GIS settings, be they linked to big business or small business, large or small EMRs, insurance companies or much smaller institutional healthcare settings, large area or small area focused operations, large npos or small npos with minimal funding to support their goals and plans.
Transformed Data
Next, it helps to interpret these two large parts of the EMR-GIS system (EMR and GIS) in view of their smaller parts.
The EMR currently in use within my system makes use mostly of SQL and SAS. This two-tiered method of pulling and then evaluating data was successfully developed and implemented to perform the prior Big Data spatial health projects that were posted several years ago, when the national health data was analyzed (varying from 40-120M U.S. patients, 1-2 billion records per year, using SQL in a Teradata datapull work environment), then exported, filtered and turned into quantifiable location data, and then mappings using a SAS polygon-grid mapping program that I invented (it took only 15-30 minutes to produce a national map).
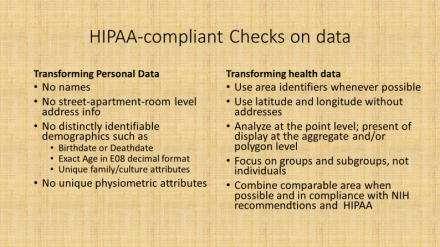
In this newer system, more data crunching and redefining is done as part of the initial datapull process. All data are geocoded, and made HIPAA compliant as part of this initial datapull. This means a number of basic features of the data have to be maintained, such as no personal names, SSN, patient or member IDs, phone number, exact address, etc. These are all changes in the initial data pull process.
For example, for research purposes race and ethnicity data are converted to the U.S. Census standards, and missing or unknown data meaning converted to the appropriate subgroups (for example, as AfrAm or BL, Wh, As, SoAs, Al/NatAmer, HI/Pac Isl, . . . “N/A”, “unknown”, “no response”, “refused to answer”, “other” may be coded together or as their own unique subgroups). As another example, ten to twelve groups were defined for “religion”, referred to as Religion Groups (file column name “Relig_Grp”), and grouped as [I am being quite non-specific and incomplete here]: Christian, Christian-related (sects), Jewish, Muslim, Buddhist, Hindu+, Agnostic, Atheistic, Natural Theologians, . . . None, Other, . . . Unknown, Not noted . . . etcetera. When appropriate, all locations/specific places, proprietary and specific names are also recoded or eliminated.
The end product of this data pull is “transformed data”, which has four levels of HIPAA related compliance. This initial pull generally results in Level 1 data–which means that it would be difficult for an HIT individual to trace it back to the actual individual, without knowledge of the SQL transformation programming that was used. This data may then have to undergo further transformation or aggregation, depending upon it uses and needs.
Transformed Data Levels
-
Level 1 is intended for internal use and may include generally acceptable information, for example, a list of patients with names, DOBs, MRNs, addresses and phone (never SSN) numbers to contact.
-
Level 2 is no name, no address (lat-long instead), and preferably DOB converted to decimal age, for example, internal studies that are part of the system/network, but may not be fully active or engaged at the ally facilities.
-
Level 3 includes the above, plus recodes or removes all facility identifiers and PCP info, as needed, converting these to unique identifiers to something that can be decoded later when needed; this is intended for external use (but may include location or facility for certain outside npo activities such as quality assurance or improvement checks and program grading projects).
-
Level 4 is aggregate data (i.e. adequate for unmonitored course or college level training), with all of the above features, and further limitations applied when needed in complete compliance with location related features, as defined by NIH PHI guidelines.
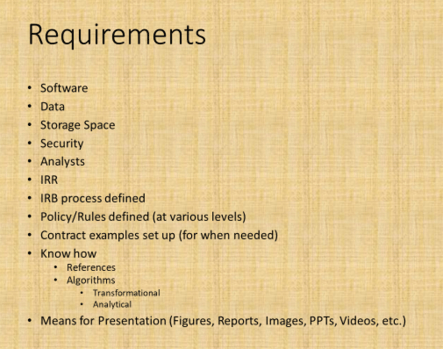
Software
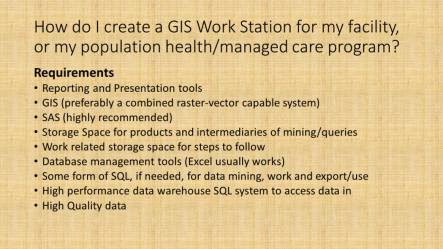
Up to this point, some form of data storage process and a GIS are mentioned as requirements. A SAS may be used as a substitute for the GIS, assuming the programming I promoted here and elsewhere– areal (i.e. zip. census block) and grid (namely square or hexagon) spatial analyses, without basemapping — could be implemented (no SAS-GIS add-in is needed). In many cases, the data pulls are done using some internal software and/or sql. In the above figure, other steps are required to implement some standardized surveillance-analytics program. They define the most basic requirements.
Setting aside the selection process for a GIS for the time being, knowing your potential data and information resources for one of the most essential parts of this process.
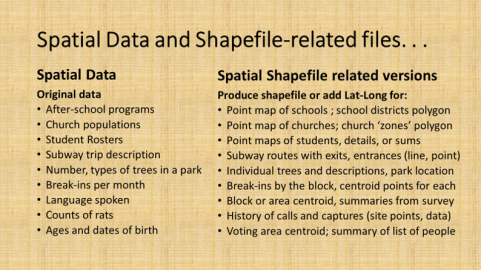
Data
Again, using the NYC setting as the example, there are several sources for basic information data and spatial data available for setting up a surveillance analytics spatial workstation.
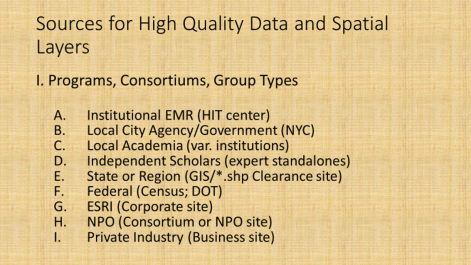
The better know sources for data for spatial analysis work are the GIS companies and resources, with ESRI perhaps the better known, and a number of Federal, State, regional, agency related resources serving as the primary sources for the actual GIS spatial (point, line, polygon) shapefile data. Knowledge related resources or datasets (directly or indirectly spatial) that can be linked to shapefiles comprise the rest in the above listing.
The following sites were used to access the base layer and background mapping data for establishing this EMR-GIS.
- NYC Oasis Basemap (to locate sections for a study; to review features of that section): http://www.oasisnyc.net/map.aspx
- NYC Open Data: https://opendata.cityofnewyork.us/
- NYC Open Data, datasets browsing page : https://data.cityofnewyork.us/browse
- NYC Planning (department of transportation) maps and baselayers/data: http://www1.nyc.gov/site/planning/data-maps/open-data.page
- NYC Map Tiles (background or basemaps, i.e. older maps digitized): https://maps.nyc.gov/tiles/
- NY Orthoimagery maps (also base maps): https://orthos.dhses.ny.gov/ see also http://gis.ny.gov/gateway/mg/napp_download.htm
- USGS Earthexplorer: https://earthexplorer.usgs.gov/
- Landsat, downloads/purchases: https://landsat.usgs.gov/landsat-data-access
- Landsat general page : http://www.landsat.com/
- Zip Codes (some ESRI links): https://www.zip-codes.com/zip-code-map-boundary-data.asp
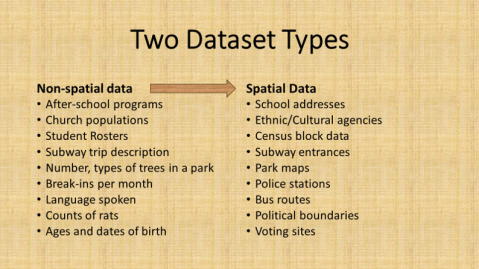
NYC Open Data site is the source for most of the shapefiles and spatial data, which are used to link EMR data to. There are spatial and non-spatial (location or area related) data available at this site. Most of this data is reliable and useable (can somehow be linked to a GIS, either by lat-long-x,y coordinate, or place name/zipcode/etc.).

The Orthoimagery page provides rasterized datasets that in some ways are comparable to the use of Landsat imagery (though not exact as LS or NDVI ,etc), and may be evaluated using some of the same remote sensing methods or strategies.
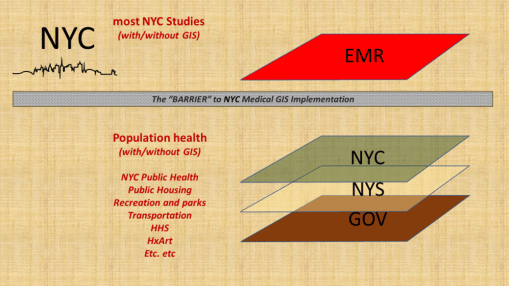
Medical GIS
To date, there has been a number of barriers preventing the adequate application of GIS within the health sector to the implementation of a facility or program based GIS devoted to monitoring, surveillance, intervention and other health program management activities. At the institutional and insurance company level, this barrier exists due to the lack of knowledge and experience within the Medical Records or EMR data management system. There have been numerous examples of GIS utilization attempted here and there throughout the system. Still, to date, there is no clearcut leader in the field making use of a combined EMR-GIS data warehouse management practice or procedure. For nearly twenty years, EMR-GIS practices have remained at the experimental level, when interpreted using the process I developed years ago just before analyzing the national U.S. EMR data for the first time at the 50M to 100M patients level almost 10 years ago (see nationalpopulationhealthgrid.com).
The result of this disengagement of GIS expertise in the field is literally the stagnation of health management at the local and regional government program, insurance program level. Is it possible that the limits have been reached for singularly trained people, forming a team of varying experts, who when even working in groups are unable to take their team performance to the next level of achievement?
The barrier to health improvement has often been related to this lack of GIS implementation. The combination of changes in software, hardware, storage technology, data analysis speeds, data build and restructuring speeds, have partially limited the ability of “experts” to make any long lasting changes. Since all of these parts of the EMR data technology undergo changes and development at rapid speeds, by the time a process is developed for such a program, the tools and information have changed, the older knowledge base is outdated, desires to patent or own a particular process get outdated (half of the 17 years patent rights may be gone), and the health of the people may have even changed, making certain areas of focus no longer applicable.
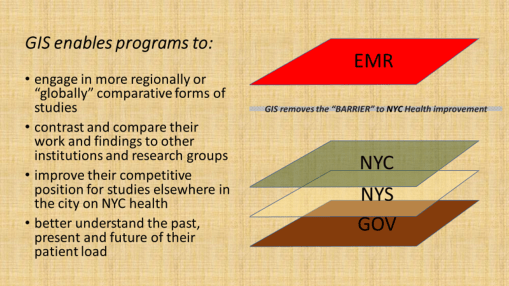
Implementing a GIS at the healthcare level, in particular within the private business or hospital/facility levels, enables more directly targeted, patient and doctor implemented changes to be made. Whereas at the insurance level, the same achievement is theoretically possible, the one or two steps away from the patient-doctor interaction that an insurance company places itself, and the frequent discontent patients suffer due to the lack of helpful or adequate coverage (even lack of coverage) insurers provide, severely hamper any ability of the insurance company to have a timely impact on patients’ health. To implement a GIS at the caregiver’s facility level ensures the facility of its right and ability to make improvements.
If we look at this issue as a similar series of different care programs were implemented in the past, we see a parallel here. In terms of intervention rates for patients receiving some form of preventive care, such as childhood immunization, passive programs with insurers that fail to interact with patients (i.e. PPV) have much lower rates than HMOs, which is turn have lower rates than Managed Care programs, in which the provider and patient are regularly evaluated and scored for their more interactive relationship. Enabling a program to evaluate its population provides its leaders directly with opportunity to make decisions that immediately speed up or slow down certain parts of the healthcare process. They need not wait for feedback from their patients’ insurers, and in general, they can do nothing if they rely upon last year’s (or if lucky last quarter’s) reported posted by the regional public health review.
Finally, it is important to note that the variety of measures that a program can engage in is much greater when the program itself carries out these activities, instead of waiting for regional agencies and scorers of programs to determine what limited measures to use to evaluate an institution or facility’s performance. An effective combination of EMR evaluations and GIS monitoring and surveillance can carry out such processes as fast as on a daily or live basis, instead of retrospective.
The benefits of implementing an internal GIS include enabling a program to surpass its competitors, even the smaller programs may supercede the prior successes of their much larger competitors.


Summary
To succeed in the implementation of an EMR-GIS program at the institutional level (not just the limited research level), the following processes need to take place.
- learn the required skills, implement them, and develop the required work habits;
- define rules and regulations, and establish/publish policies;
- ensure HIPAA compliance, meet related NIH research and PHI requirements;
- set up an IRB capable of handling all of the above processes;
- produce a task force comprised of experts in these fields;
- review and test the EMR data, including routine error analysis checks;
- document/detail the Levels 1 through 4 requirements of data transformation, and define the pre-Level 1 data limits (i.e. ‘no SSN release, ever’, etc.)
- implement a GIS–first at point-vector level, and then at raster and imagery levels
- define the EMR, GIS and combined EMR-GIS-analytic processes (flowcharts)
- establish some regular analysis and outcomes reporting standards (mimic your HEDIS, and then some), and semi-automate to fully automate these processes
- engage in structured and non-structured text analyses EMR data analytic processes
- develop and initiate qualitative, quantitative and combined research programs
- apply the EMR-GIS tools and methods to searching for new grant opportunities and identifying unique population related needs for your program
- develop a big data GIS reporting “Atlas” that can be regularly produced for your facility/facilities and the appropriate parts of the program
- produce a time comparison report of the ICDs and therapeutic/diagnostic results performed on your facilty or institution’s population, comparing three periods of time, in order to define the changes in ICD rankings that have taken place over time [last year, vs. 6 yrs ago, vs. 11 yrs ago) at the patient, visit, visit:patient ratio (VPR) levels. (Also consider repeating this for special subgroups, i.e. just child age diseases, or just chronic disease rates, or just infectious diseases.)