


I am current developing a NYC GIS research process for evaluating 15 to 20 years of health data. Unlike most medical GIS programs, the data in this system is quite complex, and includes standard medical data along with case and practice specific structured and unstructured data components.
A preliminary review of the billions of datum rows in the EMR for this project suggests that there is an average of about 1.5 to 2.2 million patients appearing in the EMR due to new healthcare activities per year. Over the years, the total number of patients found in this EMR, which consists of 8 separate parts, is approximately 20 million people. However, there is considerable overlap in the patients from one network to the next, and it is estimated that in fact this data set probably represents 11 million to 15 million people. Only a small percentage (about 7-15%) of these patients have 10 plus years of care. In spite of the lack of a full lifespan’s worth of care for a single patient, these patient groups with 10 years of continuous care can be used to define standard processes involved with health care, of any sort.
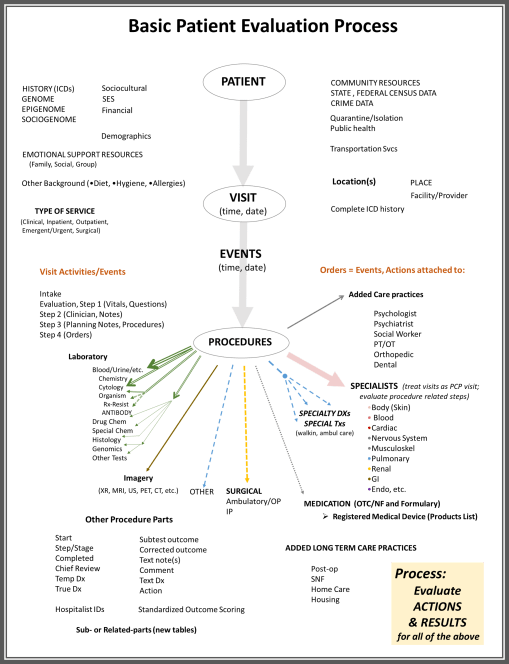
The EMR’s components may be group for lengthy reviews as
- patient data (mostly structured),
- Patient temporal diagnosis (ICD9 or 10) data (chronic and acute, date of onset, completion, etc.)
- visits data (structured, mostly numeric, date and time data; used to evaluate type of visit, time/date relationships, length of stay or service, and place(s) of care and their sequence, temporally),
- procedures data (structured for the most part; well defined billable actions such as labs, xrays),
- events data (structured and non-structured text and notes data; activities may be interpreted like procedures, but they are usually done by the physician as additional care processes, and usually not billed, such as administering a psych test, providing the patient with a pamphlet on STDs),
- outcomes of results data (structured and non-structured; highly detailed findings; includes activities engaged in with these items, such as residents reviewing the xray, or students evaluating the blood sample and providing their diagnosis for review by their mentor)
- additional outcomes or results data (focused on a unique topic such as pharma, sample testing, histology evaluation results, genomics, or bacteriology)
Approximately 72,000 health care procedures are detailed in this EMR. There are well over 300,000 events (many educational materials) per facility. Since patient visits are temporal, they are crucial to developing any pattern for evaluating patients health care processes. The visit types most often used are: office visit , emergent care, inpatient, regular visit, ambulatory surgery (other surgery is in inpatient), other visit (for xray, other unique item), referrals, communications by phone or mail about patient’s history.
A typical average visits per patient per year ration is about 6 to 10 per year.
A typical average procedures engaged in for care, per visit is about 40 to 100, increasing with age and complexity of patient’s health.
A typical inpatient stay can last about a week and consist of 1,000 to 10,000 procedures (with repeated ids), and each procedure generating as may as 1000 lines of data includes structured results, and non-structured additional information (who was engaged, notes on related issues, etc.)
The following diagram is used to depict these datum relationships
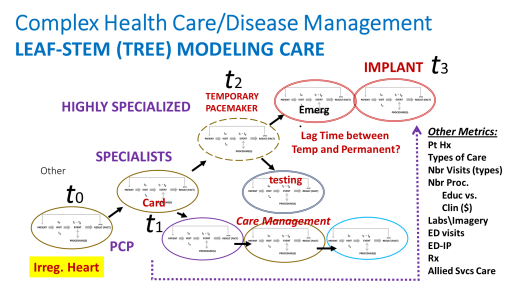
A collection of visits for a single problem may be modeled as follows:
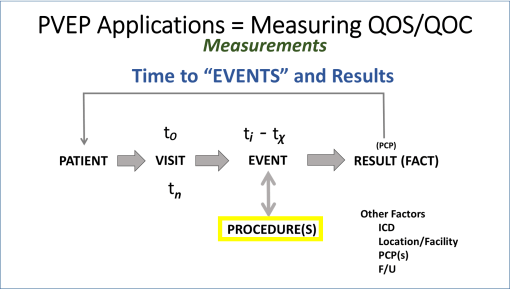
Each visit has measurable components and time elements (PVEP = Patient-Visit-Event-Procedures)
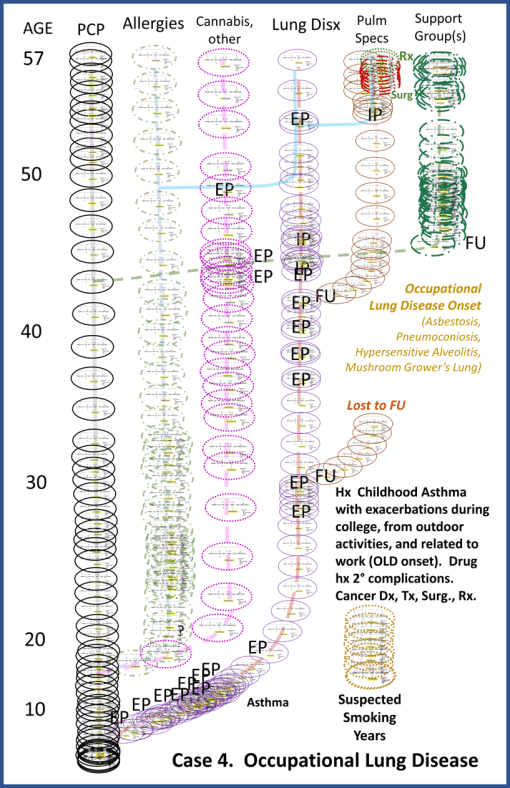
The following is an example of a lifetime of care model (each oval is a visit):
In March 2018, GIS was added to this patient care-disease modeling program.
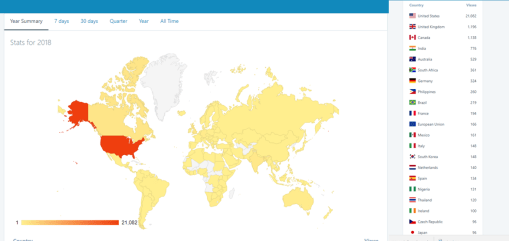
— an update on this site’s stats —
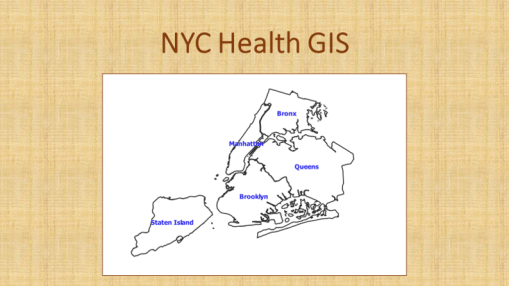
Step 1. Social, Societal, Demographic and Population Base Maps developed
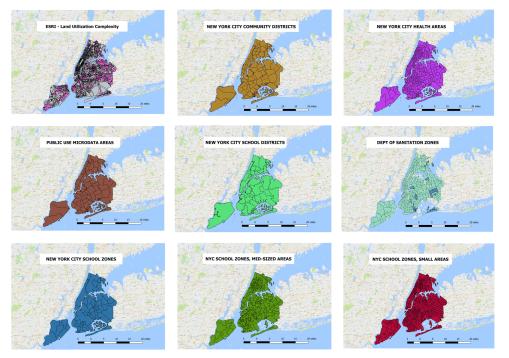
Step 2. Early application of data to QGIS

Geography of Site Visitors for from 2009 to 2018 (so far)
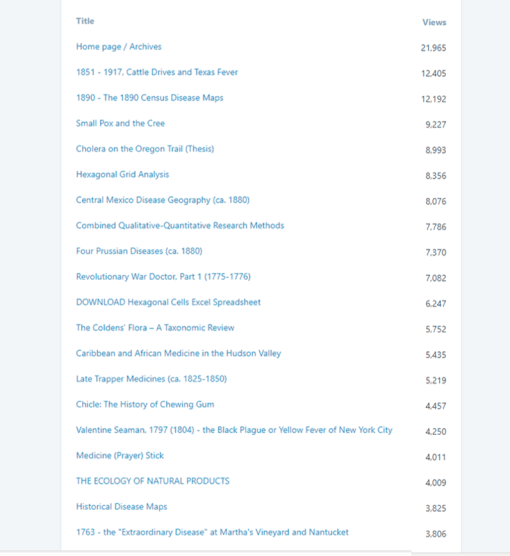
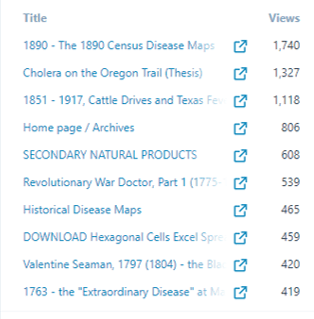
All Time most popular sites:
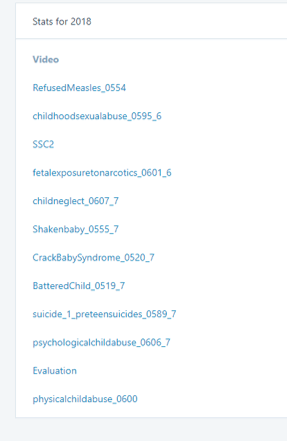
Popular in 2018
New Mapping Technology videos visited on this site (most are in Youtube):

For more on this technology, see the SAS generated videos produced by programming mapping in SAS (not SAS GIS) about ten years ago; this technology is complemented by the use of the new GIS workstation projects.
For examples of these visits, search through these blog posts, or see the collections of videos put on file at:
Topic:
Childcare
Migratory Disease Patterns
NPHG (National Population Health Grid)
My programming for this work is kept available at the following site, rarely referred to and/or visited:
Managed Care Innovations (SQLs)
https://wordpress.com/view/managedcareinnovations.wordpress.com
