……………………………………………………………………………………………………………………..
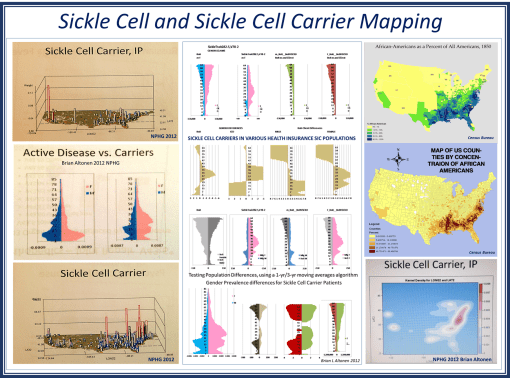
A traditional approach to studying sickle cell disease uses population health age-gender profiling in a very coarse fashion. For a full population study of sickle cell and sickle cell carriers age-gender distribution, we see very unique and even unexpected differences in the longevity of men versus women. During the past decade, I have seen this population health profile for Sickle Cell in boths of its ICD 9 identifier forms duplicate this model, for a number of difference parts of the U.S. Due to the unique shapes of these numbers-prevalence profiles for “Active Disease vs. Carriers”, this profile presented here demonstrates remarkable external validity. This relationship exists at the national level, and local levels.
Apply 3D NationalPopulationHealthGrid modeling algorithms to my data, the resulting maps provide a very unique sociocultural interpretation of how Sickle Cell exists and continues to spread throughout the United States. More importantly, the population pyramid approach to analyzing this data shows us how treatment and intervention programs should be modified to better fit the needs of age-gender groups in specific parts of the country, or locally.
Most important to note is the difference in lifespans when men and women carry the sickle cell in its non-expressive [“carrier” or ss] form. This is due to partial expression of the S gene, the degree of expression, and the impact it has on the longevity of the patient.
Social Darwinians might have a field day with the social implications of these spatial findings. For it demonstrates that women who carry sickle cell live longer than men who are carriers, to the point that they remain alive throughout the primary fertility/fecundity years. Men on the other hand lack this survival feature and are more likely to die, even as carriers, during their most active reproductive years.
This method may also be used to model others diseases linked to the human genome. (A number of my videos in Youtube provide examples of the various genetically-linked diseases and development disorders that I reviewed years back.)
About ten years from now, this way of modeling and interpreting genetic diseases will become one of the most important applications of NPHG style analysis of human EMR/EHR and lab/genome data.
For more on how I applied NPHG and ICD9 analyses techniques to human genome projects, ICDs, EMR, EHR and Managed Care planning strategies, see:
Socioculturalism and Health:
Fatal and Non-fatal Genetic Disease:
and the numerous NPHG mapvideos on the following :
https://brianaltonenmph.com/biostatistics/risk-management/
See on Scoop.it – Medical GIS Guide
