
The figures on this part are from my 2000 to 2006 studies of the Ecology of West Nile Fever. ESRI GIS, Idrisi and several raster-grid and imagery tools were employed over the years for this work. The research methods presented on this page and the site I provide links for, pertain mostly in New York, and to a lesser extent in Colorado. To date, the full data set I developed for west nile ecology work has only been partially reviewed.
With Zika now present on the United States continent’s mainland, numerous questions must be considered for the events that may soon follow.
Some mosquito-born diseases like Malaria fail to reach a state where the pathogen, vector, and hosts other than people enable it to become a part of the local ecology. Just what are the features that prevent such an event from happening? What parts of the potential ecosystem in which the vectors could survive is incapable of providing the requirements for its pathogens–plasmodia?
With yellow fever, there was limited possibility for the pathogen-vector-host/carrier relationship to exist as part of the natural setting. The limiting factor much of the time was weather, in particular seasonal climate changes that made it difficult if not impossible for pathogens to remain alive in much the U.S. over the winter. And although such is not the case in the deep south of the U.S., yellow fever never became the pathogen that it still is within its native tropical settings. So there’s more at play with this form of mosquito-vectored disease, than just the pathogen-vector-host relationship. Something in the ecosystem extinguishes the yellow fever virus, as well as limits its principally Aedes and Haemagogus vectors.

If we ignore for a moment the historically important Dengue Fever linked to a similar vector dependency, the next most important mosquito vectored pathogen to strike the U.S. is the West Nile Fever related virus. Although it also arose from a very different climate and topographic setting, like yellow fever and malaria, West Nile was able to establish itself as part of the natural ecology. Why did it accomplish this?
The traditional reasoning, from traditional epidemiologists, tends to focus on the human-host-vector-pathogen relationship, paying limited attention to the macrocosm of the pathogen and peoples’ world–the surrounding ecosystem. West Nile had a number of very distinct ecological behaviors that to date, with the exception of some of the work I published more than ten years ago, have not been developed into a potential method for evaluating and spatially analyzing mosquito-vectored imported disease patterns.
The following are the most important spatial methods for evaluating disease ecology pertaining to mosquito-borne diseases:
- Plant Ecological research provides insights into the ecosystems that certain species of mosquitoes favor, and/or stay away from in terms of finding the niches for potentially infected mosquito populations.
- Understanding the relationship that exists between landuse form, plant type, vegetation region or biome type, and the effects of these upon the microclimate of vector-breeding areas, provides a unique set of insights into how to evaluate the ecology of the vector-host relationship, and provides us with a way to initially define, more accurately, high risk regions.
- As demonstrated by a field study I performed around 2002, using a light sensor, subcanopy light influences the behaviors of vectors and can be used to define the most susceptible natural settings for a vector to engage in specific feeding, mating, breeding and migration activities.
- The application of normalized difference vegetation index (NDVI) imagery to studying species patterns and the possible locations of swarms or dense clusters of populations provides additional insights into how a region at the small area level becomes disease prone or not. [See https://brianaltonenmph.com/west-nile/6-remote-sensing/ ]
- Satellite imagery may be used to further this method of research on the influences of canopy upon host-vector-pathogen relationships. [ https://brianaltonenmph.com/west-nile/6-remote-sensing/ ]
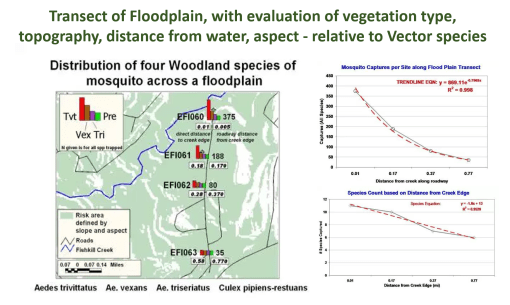
- Competition between different species in a shared territory influences how they position themselves within the ecosystem, at the elevation and canopy-related level, and in terms of the distance from the water body that they may reproduce and aggregate the most.

My most successful series of studies demosntrated the ecological links between certain species and population density per species, the potential impacts of species competition on the exposure of people to disease carriers, and the important roles of understanding landform relationships with the behaviors of potential mosquito-carriers, a feature that is very microecological nature, and can vary from one moderately sized region to the next.

Most important to this study was the value it demonstrated for the use of NLC imagery and the value of applying other free (then, not necessarily now) spatial imagery data to this research process.
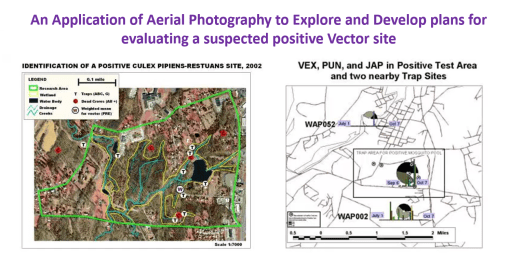
My most understandable and therefore successful outcome was of course related to the aerial photo imagery project, the third image above, for describing and demonstrating the spatial relationship between a cluster of positive testing animal hosts, and the probably location of a positive testing pool of vectors. These vectors overwintered the following seasons, and re-emerged in April of the following year, demonstrating the ability of vectors to retain an active pathogen or virus into the following years.
Important to note here – – for Zika to become ecologically stable within certain areas of the United States, and to become a part of the local ecology, this behavior has to be duplicated.
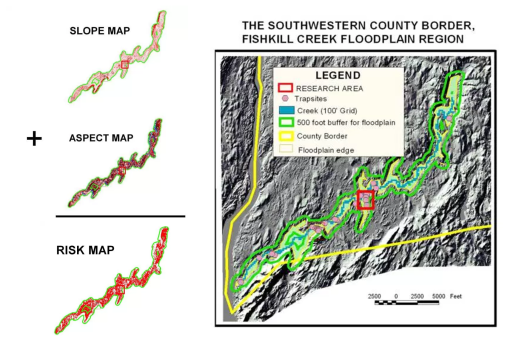
With IDRISI (and its subsequent products, IDRISI 32 onward), one is able to evaluate important topographic, elevation-related, and surface-reflection/solar pattern linked features to the behaviors of a disease. To identify the most susceptible, effective surveillance sites, the SLARs and related elevation datasets available to remote sensing staff can be used to define the more successful topographic regions for trapping possibly infected vectors. This worked in the field and for lab results (producing positive testing hosts and vectors) in several ways. The most important was it correlated back to the elevation-distance from water edge study I performed, by setting mosquito traps along a transect of the creek’s flood plain. It also explained why one creek was not very productive with positive testing species, versus the other. The two creeks appear the same, but topographically and ecologically, according to elevation and topographic images, their forms influenced canopy and solar energy aspect features, making one creek very stable ecologically and not a carrier due to high vector species diversity, whereas the other was less species rich and therefore more likely to harbor infectable vectors species, predominantly in regions where the disease would be spread by human ecological means.

Different species of vectors have different elevation related behaviors. Idrisi was also used to produce DEM derived images with overlays, to demonstrate how elevation above water surface does influence the species captured. The most revealing images and findings about vector species ecology came from my various studies of plant species, canopy type and light penetration, in relation to small water body locations, potential and infected raptor host species that had recently deceased, and the use of algorithms developed for testing the relationships between plants and small areas.

This first study is of a small shady yeard setting, with a nearby pond, a positive testing host, several related dead hosts, and a unique multispecies canopy setting. The NDVI was used to demonstrate the results of a supervised classification process used to reprocess the original image of this setting.

The trap sites on this property were added as point, converted to grid data, and then overlain of the reclassified NDVI. Buffers around the trap sites were identified and that data pulled from all subsequent images analyzed. The results of this analysis was then related back to the entire image to produce an entire map depicting the risk of each grid cell area. A Theissen Polygon analysis was performed of these trap areas, for use if defining the content of each trap site in terms of landuse, NDVI, canopy and vegetation related grid cell findings.

Several ecological tools already present in Idrisi were also applied, focusing on biodiversity and species richness, and tested as possible indicators of potential west nile-bearing vector-host settings.

Four types of regions were defined by Idrisi, each with different types of ecological relationships between the plants and other materials or belongings found in those particular regions. The hot spot was overlain on these four classes of disease inducing locations, and the point related best with Classes 5 and 6. (Above). This implied that Deciduous trees played an important role in producing the ecological setting that the vector species most desired, followed by a low lying moist vegetative region adjacent to it. It also demonstrated that the heavy canopy settings had minimal influence on vector swarm patterns. The heavy canopies at this site were planted evergreens, mainly 30-40 foot tall Fir and Pine trees.

Applying this back to the entire image, a cross-sectional risk area pattern could be produced, using several formulas or dimensions by which risk can be assessed. Linear, quadratic and cuboid formulas were applied. The cuboid model demonstrated the best fit, especially for Class 5 area, again, reconfirming the point-area derived summarization deduced based simply upon visual inspection of Class 5 of the classification images.

For more on the method for mapping mosquito cector ecology, see my pages at the following links:
- Assigning Risk
- Host Surveillance
- Vector Ecology and Surveillance
- Plant Ecology
- Topography
- NLCD Grid Mapping and West Nile
- West Nile – Light Penetration Study
- Remote Sensing – West Nile
- Case-related Surveillance

http://www.cnn.com/2016/07/29/health/florida-health-officials-confirm-local-zika-transmission/
