
Introduction
With the recent passage of an Act proposing the elimination of Obamacare, it seems time to define why those arguments we always hear about controlling the cost for health care can seem ludicrous by analysts like myself, who spend more than half our waking hours looking at services and costs and trying to interpret why numbers flow, the way they do.
A major problem with healthcare cost and trying to understand it stems from the source for these numbers, that define how much gets paid and by whom.
Unlike buying a large furniture set, a car, a house, or a shared part of some ridiculously high vacation land investment located in the center of the Rockies, defining a cost per unit or service, service product, belonging, or time, becomes impossible because unfortunately, all of these costs are arbitrary and pretty much made up based upon past experiences.
The cost for undergoing an MRI for example is not determined by the amount of energy used to accomplishment. It may in part be related to the cost for the equipment needed to perform that task. It may even be based upon some sophisticated algorithm that takes lifespan of the unit into account, along with the cost of labor needed to use it, and the number of people who use it per given time frame, with the goal of paying it off, all or 50%, within a certain number of years. Or you may just “ballpark” that cost by comparing it with other institutions and other costs. Its like using the smaller car to determine how much to charge for a larger car.
To analyze cost, we need to understand cost for equipment, cost for time and human resources, and the amount of effort that goes into this overall process.
But health care has these other costs we take for granted, such as the cost for that pamphlet you were given on BC Pills, or the cost for that form the office uses to document a family’s medical history, or write out a flow chart depicting the genetics path of a rare disease in the family. Each of these processes cost money as well, in terms of the paper object and the time needed to fill it out. Then there’s that time spent inputting if necessary, and the time needed to find and pull it again later if need be.
Cost Paths Theory
We can use any series of pathways and logic to define health care, but in terms of evaluating the cost and time spent providing care to patients, in relation to their needs and background, the electronic medical records system many companies have may do all that is needed.
The problem with interpreting EMR data is it is not put in there in any immediately understandable, logical fashion. There is a major amount of common sense used to design the plan for this database up front, but quite soon into this project, what appeared to be a fairly easy set of data points to enter turns into an avalanche of unpredictable, uncontrolled details of findings. Making sense of those additional data, in order to produce the most common sense, logical pathway for review of these numbers, is time consuming to say the least.
After years of reviewing various systems, there are certain methods of breaking down the data into parts to define how a patient is care for, and how the services get utilized, and human resource time gets allocated, in order to make a patient satisfied with the care process, or at least left sensing he or she has completed this particular health care “assignment” for the moment.
The following is how this pathway for care, for a single person, undergoing one visit, with a history of multiple problems, is provided healthcare.
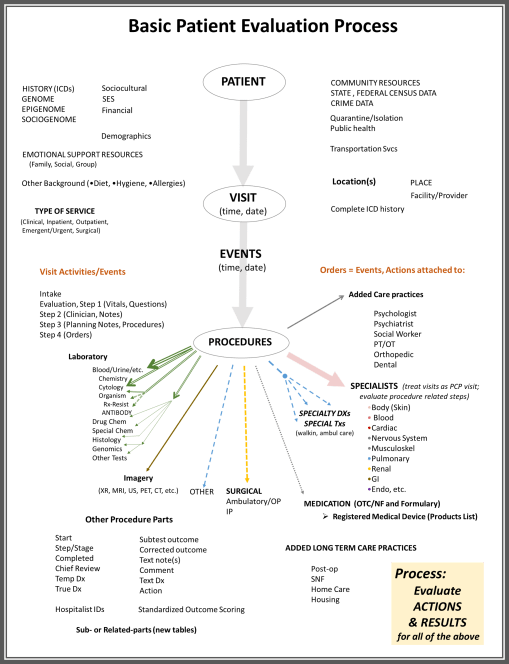
This is a rather cumbersome, overwhelming graphical illustration depicting the flow of various activities that are engaged in with health care. It illustrates less than 20% of the data elements needed to detail all of the healthcare processes. Yet in terms of major tables of data, for large lists of data related to the various processes and actions that occur in health care, the items illustrated in this flowchart perhaps depict about 90% of the data most important to monitoring and evaluating healthcare practices.
This figure is also a flow chart of the care process, in which a Patient goes to a care giver’s place or setting (no matter what form), has a condition or state that has to be “treated”, requiring a number of steps in the patient-office-nurse-caregiver behaviors that ensue throughout this process, and its follow ups. A Patient’s Visit in turn requires people interactions which then are followed by by decision making, perhaps analysis, and processes then follow to provide the service that a patient originally care for–the healthcare service, or a medicine, or a serious of tests followed by treatments, or a surgery, or a referral to the right counselor or psychologist, etc. etc. etc.
Research Questions
A series of these flowcharts will be reviewed over the next few postings to detail how these processes enable you to make sense of the system and define how it operates, where the savings can be made.
FIRST HYPOTHESIS
This process was developed to monitor the pre-Obamacare process, and the recent processes initiated during the Obamacare period (which apparently could be quite brief). But any subsequent changes in this care process that ensue in the upcoming future can and should be monitored to determine if change really happens. I am taking this approach to studying the care, beginning with the null hypothesis that states:
“The transition from PPACA or “Obamacare” to a new program will have minimal, direct impact upon the patient care Visits, Events, Procedures and related activities that ensue.”
This methodology was first developed a year ago, after the transition into a fully operational PPACA plan. The concerns at the time related to the numbers of changes in enrollment that might ensue.
Since the reenrollment process occured late in the year, up until December 2015, it was possible to develop a model for monitoring the 2014 and 2015 patients, then assess the patient lists per quarter to determine disenrollment and new enrollment/reenrollment rates, and evaluate the numbers of patients who remained in the system.
The concerns of all insurance programs at the time was that more expensive, more risky patients dissatistfied with their services would change programs. The goal was to identify these new enrollees and monitor their practices as unique cases loads, for comparison with reenrollees, to determine if the “sickest patients” were also the most likely to switch programs.
SECOND HYPOTHESIS
A related second hypothesis for this first null hypothesis is as follows:
“The actions, events, procedures and related activities engaged in as part of the health care intervention program will not show the change needed to provide reason to or explain why cost related changes are noted for the before, during and after PPACA programs.”
This is based on the added assumptions that “people are people” and in accordance with neoinstitutional theory, people in one program or group will behave like other people in another program or group, when the two groups are defined by similar means. In this case, we are comparing patients to patients, and in particular, the old medicaid patients population to the new medical patient population, the old employee health population to the new, and the same for the two matching medicare and child health plan programs.
Using specific metrics developed for utilization rates comparisons, if there are similarities between each of the years before, during and after the PPACA, then the program itself is not responsible for any change in activities and therefore, changes in overall cost for health care at the institutional (health care facility and providers) level. This process will also be used to assess types of visits, types of inpatient stays, groups of related diseases, and differences in health care purposeful behavior based upon age group, gender, race, ethnicity, and for the first time, religion.
THIRD HYPOTHESIS
The lack of evidence for an actual change in care related events, namely the numbers and types of visits by patients, suggest there may be reasons outside the actual care process that are responsible for these increases in health care cost. So how do we detect where these changes are happening and why?
The third hypothesis states that
“The rising cost for healthcare, when healthcare processes are compared across different program-service lines, is due to causes outside the healthcare system itself, such as the insurance program, or the regulations developed as to how programs are priced, by the government and the insurance agency itself.”
The latter hypothesis may not be completely reviewable, for if the insurance programs that set the cost are at fault, as a healthcare analyst working on services and quality of care, not the business and cost-defining parts of this program, I have no direct cost evidence for how the care is priced, billed and paid for by patient, companies and other financial sources.
However, as noted in the latter “Confounders” section on this page, inferences may be made as to what some probably reasons for change might exist, outside the clinical setting.
Methodology
There are specific metrics I developed for this model to measure performance of the various programs, for all services, all disease types, in terms of time, utilization, healthcare providers manpower, facilities, kinds of care needed (preventive, emergent, surgical, etc.) and theoretical cost.
This last factor is the chief reason for my development of this model. Each step in health care, in combination with a consideration of the time needed to carry out that process, and the equipment used to perform it, result in a cost that is better off standardized, and then contrasted and compared with real costs, to determine how much certain parts of the health care process are being undercharged, and other parts overcharged.
An Example
An example of its application to a fairly young patient, in need of preventive services, but only willing to engage in one third of his/her healthcare model potential, is demonstrated. The long term impact of this single case will be show in terms of costs for each step taken by the clinician and patient, and the actual and theoretical physical and manpower costs for each. In theory, a new healthcare program can some how modify one or more of these events in order to best improve health, thereby lowering long term health care costs.
Due to the virtual nature of costs, we may not ever be able to prevent insurance companies and the like from making up for lost revenues by reassigning income potential along other avenues within the care system. But this process should help to define where short cuts are taken, steps are avoided or cut in half, and processes eliminated in healthcare activities, in order to improve earnings derived from the limited resources at hand.
(for this series of teaching materials currently being developed and reconstructed for teaching purposes, see this link)

Confounders
Potential confounders of this process are the impact of any social health behavior changes incurred as a result of the health care program and related insurance plans changes.
For example, disenrollment or failure to reenroll will most likely result in reduced healthcare demands. These could in theory increase the amount of appointment time available for seeing specific physicians, which in turn could increase the compliance and activities engaged in during the practitioner-patient processes for a healthcare visit.
The “emotional” consequences of insurance program change might also change human behaviors regarding preventive health care behaviors. In the simplest of cause and effect relationships, “reactive depression” could increase non-compliance. Increased costs for a prescription drug could alter refill times by increasing the amount of days the patient spends using lesser amounts of the medication. Theoretical “preventive care visits” may decrease in number, even if only by one or two visits per year, depending upon personal payments required of a new program. The production of a voluntary enrollment process for changing program or requalifying for the new program could result in a sense of “giving up” by patients, who then delay or fail to enroll in the new plan.
Each of these provide reasons for reductions in the health care events and procedures that are reviewed after enrollment has changed for an insurance program. Enabling a program to renew enrollment, according to predefined providers lists and schedules, mimics the HMO processes that preceded the PPACA plan initiation. This will cause patients to change care givers and even institutions, and may force decision making changes regarding whether or not to enroll in “the full plan” or just certain parts of it.
Each of these decision making processes, on behalf of the patient, can result in reduced use in terms of numbers of patients, and reduced forms of diversity and complexity of use by the patient. That would result in a reduction in numbers of well visits with providers devoted to one specific cause, or it could require the patient see a diabetologist for his/her diabetes, incurring a greater cost per visit for that specialty care visit, resulting in non-compliance for annual visits by a patient. For example, severely ill patient required to partake in four separate PCP plus specialist visits per year to effective treat the metabolic syndrome diagnosis (PCP, heart, kidney, endocrine) could result in annual visit costs increasing from $40 to $80 per year to $220-$300 per year.
So confounders linked to enrollment changes have to be adjusted for using several visit-procedure metrics developed for that purpose, and a series of related general and specialty health indices generated for a review of this population, extending the use of Risk Scores well beyond the typical use of Charlson and Elixhauser scoring methods.
Summary
In the next section, more details of the above broad groups noted in the charts will be provided.
