Posted by Brian Altonen, MPH, MS under Uncategorized Comments Off on New Medical GIS Plans
.
If you have the time, please participate in this survey on GIS use, with a focus on GIS or Spatial Analysis use in the workplace. This is for dissertation work on the barriers to GIS implementation by a healthcare and/or managed care system. The following is the LINK for this survey, at Survey Monkey.
I just finished a review of the research processes I am engaged in, for developing a system wide method to evaluate any and all patients, for any kind of metrics, for used in standardized analysis and reporting of patients and measures across the various EMR systems.
I defined (once again) some pretty standard measures that can be taken for a managed care EMR system (listed below). I also compared them with their status when I produced a similar page of this type a year ago [link].
What has happened between now and then is that I developed a series of algorithms that can be used to analyze and map pretty much anything you want in the EMR setting, finalized others generated by this time one year ago, and merged many of the smaller algorithms into a single data pull process, for any standard QOC research project.
My major accomplishments most recently were the development of algorithms that evaluate visits and procedures by patients who have specific diagnoses, versus all patients for a particular population, those that may be used to demonstrate changes in health care processes at the administrative level, focusing on management-cost-time-human resource relationships, and their relationship to actual and potential costs. These were developed to demonstrate where changes are necessary, and how to evaluate the healthcare outcomes and/or costs related to these changes.
The most important research topics for the next 6 to 12 months regarding grants are: genomics and precision medicine based clinical and lab-related practices, minority health care inequality, socioeconomics and quality of care, epigenomics, rare, congenital and degenerative disease patterns, re-emerging and/or foreign born disease introduction, the care of an aging HIV patient population with various comorbidities, substance abuse high risk populations, and age, ageing and Alzheimers/Alzheimer’s-like age related disorders.
The application of spatial analysis to many of these projects is still in its exploratory stage, but for those who employ a GIS in these projects, its application may be tested. Of the nearly 1800 grants reviews, valid for the next 2-3 years, only one made mention of including GIS utilization in the grant submission. None of the grants that mention “geography” actually refer to the use of any spatial analytics process or system.
The following are the data bases that can be freshly mined and pulled from claims and other raw atomic-table rich systems.
[The year I essentially completed this task during the 7/15-12/16 period is in the brackets. Those with an asterisk underwent some levels of data manipulation, format or content cleaning, reclassification, and/or development including in the algorithms.]
Demographics, patient population [7m patients; name; DOB; personal ID; insurance program ID, insurance name, type, company etc.; race, ethnicity (unfortunately often race and ethnicity are entered as one column)] [2015]
Demographics, regional [census based, census block or block-group preferred; last census, most recent year for estimated counts if available] [2015 – ]
*Standard Age-Gender [population pyramid level data assemblage for 1, 2, 5 and 10 year increments, for producing population pyramids of demographic features.] [2015]
*Standard Race focused interpretation of patient data, including Age-Gender pyramids produced by correlation with Age-Gender dataset. [2016]
*Standard Ethnicity-focused interpretaton of patient data, including Age-Gender pyramids. [Note: Race and Ethnicity often don’t correlate well and produce aberrant groups whene used together.] [2015]
*Religion [150 to 10-12] identification and reclassification routines (I have my classification system posted elsewhere in several places, but focus on major religious groups, followed by philosophically defined subgroup types of the minor groups.) The following method most often used: Catholic, Christian (Trinity, Methodist, Episcopal, Baptist), Christian Derived (Seventh Day, Mormon, some Universalists), Judaic (Torah), Islamic (Koran, Unani, Rastafarian), Cultural (mostly the several Oriental and Indian), Natural Philosophy (Universalists, Quaker, Shaker, or similars), Modern (Practical, Agnostic, Atheistic), Post-Modern (Christian Science, Unity, Transcendentalists, Pagans), Other (Interdenominational), No Data or Unknown. The first five are classical groups, the remaining may be grouped as Other and Unknown. [2015 – 2016]
*Insurer [85]–focuses on Commercial (COM; all the commonly competitors), Medicare (MCR), Medicaid (MCD), combined MCR-MCD, CHP (optional), Metropolitan (MET: large areas may provide a cross population plan where just place of residence defined eligibility), Government (GOV; Fed., State, County, Town insurance plan), Military (MIL), Veteran’s (optional or included with Military), Homeless (HOM), Self-insured (SELF), Union or Contracted Worker Coverage (UNI), Drivers License-accident-related Coverage (DL); Inherited or Annuity-linked coverage (INH), NIOSH-WTC/OSHA/Worker’s Comp coverage (WC), Special Programs (Coal miners, RR or shipping industry etc, SPE). [2016]
*Cost (esp. Virtual and True) – Virtual cost is the value of a procedure, event, visit, lab, etc. done on a patient. Cost lists or “theoretical prices” can be exceptionally lengthy, although not as long as Procedures in general. They may also be constructed as group costs and later as more detailed costs, by applying averages for true costs across the system, of true costs for subgroups of procedures and other items priced. True cost is what is charged to payers (patient or insurer). Virtual cost is an artificial value or estimate assigned to a procedure, as a guess, guestimate, or otherwise calculated value that applies to true life care situations. Institutional Cost is a cost which is assigned to a process, step or action that uses a systems approach to the analysis; it defines a cost based upon true costs and stresses placed upon the infrastructure for a healthcare system; for example, patients are normally not changed for specific events during a visit, like the price of the educational material provided, or the documentation in writing taken by a nurse using a special reporting sheet, yet each of these count as part of a typical office visit process; in theory the price of the office visit may be divided by the numbers of these non-charged events that occur at a typical visit. There are more than a million of these “procedures” coded in a detailed system. The standard is to not change patients for these individual procedures because they are considered part of the service. [2016 – ]
*Cost Burden –temporal reviews of people demonstrate changing forms of coverage over time. At some periods in life, an individual may have just one health care coverage, such as COM provided by the employer, followed by MIL and then SELF and then HOM, then COM, and then GOV, MET, UNI, and finally MCRMCD. Independent non-duplicated scores or indices are attached to each type of coverage, which can be logarithmically related to cost/risk (using base 10 or less) when compares with a cost amount developed as another Price Sheet (virtual or true). [2016 – ]
*Visits [inf.] – A visit is when the patient shows up for some reason. A visit may have a direct disease or health state linked to that visit, such as assess for possible pregnancy, where physician decides to also engage in annual visit events, such as check vitals and give seasonal shots, and then reassess if any immunizations due, or renewals of unrelated drugs required, or referral to other specialist required, or annual exams rescheduled. Each of these procedures is linked to that one event, and will usually related to conditions and diagnoses (ICDs) linked to that visit. Thus a visit for one condition may have several ICDs attached to it, and numerous procedure identifiers. Several recoding and reclassification processes are currently being tested. *An integrative (multicolumn) NLP method is being tested as part of this process. [2016]
Visit Types [9] – Visits may also be differentiated by type of visit, such as routine visit, emergent/urgent care visit, outpatient walk-in visit, inpatient hospitalization visit, referral visit, office (admin) visit, pharmacy visit, etc. [2015]
*Initial Activities/notes [0.5M] – activities are events that happen at each visit, such as check in, personal med hx sheet, initial interview for why patient is visiting, patient’s two mental health opening questions, main medical concern, history, etc. etc. These activities are often entered as discrete activity events that occur with a patient care visit. For inpatients, there may be standard floor nurse pulse taking events for example, followed by a special services provider visit, who also registers the vital signed separately. Activities are events that occur at discrete moments of time in patient health, and may be used to evaluate care process and sequences, relative to time passage. Several recoding and reclassification processes are currently being tested. *NLP methods will probably become a core part of this process, and are being tested. [2016 – ]
*Provider activities/notes and actions [100k] — in terms of content and nature, these are similar to the initial intake activities just described; however, differentiating the care related decisions made and actions are taken are two of the primary purposes of this documentation activity. Another way to visualize these actions is to view the initial intake activities as documentation provided before seeing the NP or PA. These “notes and actions” are produced by the provider and are activities that usually occur in the examination room. Naturally, clinician’s decisions are made based upon a different set of findings and events than events related to intake processes. There are however overlaps, such as physician providing the patient with an educational packet due to a question raised. *To evaluate these data, classes are still in the early phase of development. Ultimately NLP analyses will need to be developed as well. [2016 – ]
*Observations — a physician documents various observations, findings and conclusions as part of the healthcare process. Observations are document for such things as vital signs, responses to orally administered survey questions (mental health evaluation), findings on a new form the patient is asked to fill out (genetic screening questions, domestic violence, chronic disease questionnaire). These data may be evaluated for reasons related to completion, form quality and follow up to care. *NLP methods will also become a core part of this process. [2015 – ]
*Procedures [95k] – definition varies across systems, but these are the processes a patient goes through for specific reasons, like diagnoses, labs, xrays, assessment, scanning, recording, etc. The renewal of a prescription may be covered as a procedure, although Rx data is typically reported as its own unique dataset and series of events. These may be differentiated by visit types. *Most of this has been successfully reclassified and recoded for multiple applications. [2015 – ]
*Outcomes/Results [inf.] – procedure related outcomes. Whereas procedures bears the name of the process, this data set is where the results are kept. For example, a 20 measure blood test has Blood test under Procedures, using one or more identifiers with each identifier describing slightly different types; this entry of the blood test (where, when, etc.) has its outcomes entered differently in the Outcomes/Results dataset, so a 20 metric procedure has 20 rows of data. As another example, the Xray can have multiple opinions documented (MD, assistant, technician, NP, residents, Manager), with one opinion per row, and for well planned systems, the final accepted diagnosis identified and so marked. These have multiple atomic, descriptive and observational/outcome datasets (1 row per patient per event). *Due to the nature of the notes provided, NLP is required. [2015 – ]
*Visit Activity Groups [81] – Various activities can be clustered into particular forms of knowledge acquisition or physical and mental needs that apply to a each and every activity. Some knowledge acquisition may be most relevant to long term quality of life issues, or behaviors, or allied health histories. An example of an activity group is nutrition, in which all the basics of nutrition are made reviewable using this additional identifier. This dataset also applies to special services provided by individuals whose service focus on this topic, such as nutritional counseling. There may be separate specialty groups linked to this identifier, such as unique clinical service groups of data, referred to by this column, that when visits provided even more highly detailed non-structured data about a patient’s medical state and history. *This grouper provides additional services for queries because it simplifies the filtering and mining processes. [2016 – ]
*Ratios — Three ratios are defined for this group as essential metrics: Visits:Patients Ratio (VPR), Procedures:Patients ratio (PPR), Procedures:Visits Ratio (PVR). [2016]
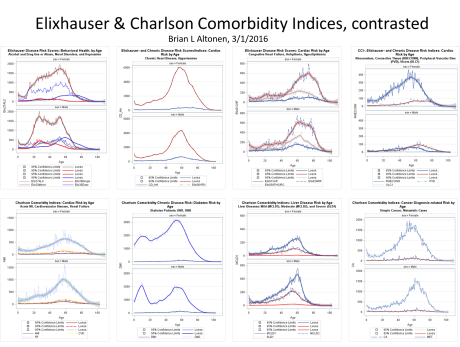
*Risk Indices or Scores. Population health frequencies, incidence, prevalence. Demographic counts for each. Elixhauser, Charlson, and Federal Chronic Disease Indices. [2015-2016]
*ICD Groups. ICDs groups should be managed as ICD9 and ICD10. If the latter is the only method use, some grouping is required for reliable evaluation processes to be developed. For ICD9 the n=about 14,500; for ICD10 the n=about 65,000. Historically, using ICD9, I was able to develop the following sets of groupings. These can be correlated to the ICD10. [2015 – 2016]
n=135
n=303
n=475
n=750 about
n=1000 (integer ICD)
n=1275 (ICD, E and V codes)
*Special ICD groups. Specific ICD code groups were defined for the projects. These groups include ICDs or ICD ranges/content, and groups labels for the following common special studies topics. These groups can be roughly defined using the population pyramid modeling processes developed. In another presentation, the tendencies for diseases to demonstrate distinct pyramid forms in relation to age and gender may be used to better test and cluster these disease patterns. Diabetes for example shows a progressive increase in counts in the population curve for both genders; schizophrenia demonstrates an asymmetry for Male versus Female with earlier adult age of onset; atrial fibulation demonstrates onset beginning at about 45 years of age and increases in number and frequency as the population ages, whereas diabetes cases reduce due to directly and indirectly-linked causes for mortality. For each of these Special groups, the ICDs, V codes and some E codes may be included in the algorithm developed. [2016 – ]
Infectious Diseases (lower ICD)
STDs and HIV
HIV, related complications and comorbidities
Fractures
Cancers, by metastases patterns and organ system
Old Age ICDs
Prenatal-Postpartum ICDs
Foreign Born in-migrating diseases (incl. vectored, zoonotic)
Country or Region specific in-migrating behavioral, physical and socicultural ICDs (culturally-bound vs. culturally-linked)
Genomic diseases, all, or by system
Neurological Genomic or Developmental
The Mental Health Early Onset case ICDs
Early Onset High Fatality Diseases and ICDs
Broad Range Genetic, Genomic and Congenital/ Development Diseases
Chronic or Long term QOL Diseases
Old Age Onset diseases
*Spatial Modeling Lat-Long Datasets, point data. i) Patients: developed for Zip Code (3- and 5-digit), Census Block or Block group (tracts are not used), and based upon need, per patient address (top security). Used to develop spatial modeling analyses and presentations. ii) Facilities; iii) regions, towns, boroughs, etc.; iv) allied health or other healthcare/managed care associates locations; v) complementary alternative health care provider data (if possible)
*Spatial Modeling Areal Analysis datasets, areal definitions and data points. Regional boundaries and areal centroids (borough, county, township, town, village). Functional, healthcare service related areas (Theissen polygons); equal area polygons.
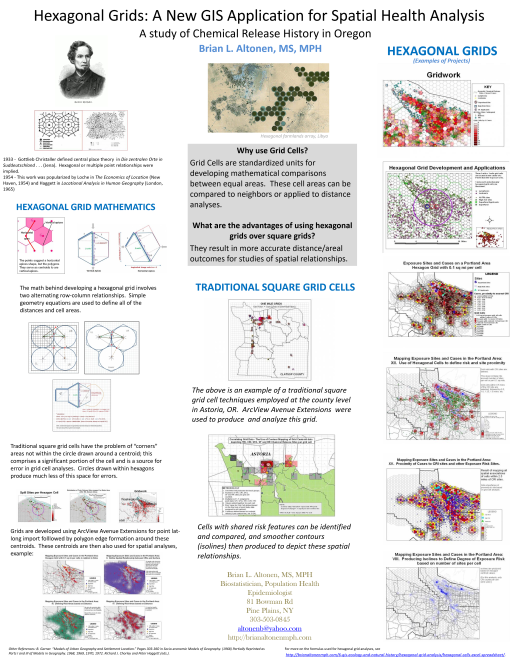
*Spatial Modeling, Transformative Areal Models and Grids (political and economic grid mapping). Traditional square grids and hexagonal grids(?). Several modeling protocols for each.
*Spatial Modeling Auxiliary data. Additional data gathered and developed for transforming spatial model into useful modeling or predictive tool, spatial analysis tool, interventions driven programming tool.
I developed algorithms for a number of these datasets in this new system a year or more ago, about a third of them perhaps.
Another third have been perfected a little bit more this past year, each tested several dozen times and integrated with all of my normal data pulls for internal review of validity of reliability. Some of these I even added new columns to, after producing a more helpful reclass tool. The reason for these reclassification systems was to take full advantage of their research potentials and applicability to grant writing, prototype development, the investigation of newly discovered relationship.
The final third of database development projects are ongoing, and have been active and producing over the past year or two, but are obviously in need of more development so they may be integrated with the other tools I developed.
The details of the projects developed for the upcoming months are briefly defined on another of my blog sites. These versions of two or three of the previously defined projects are a little more defined, and solid in their methodology and constructs, that similar ones posted one year ago.
There are also a few new topics added due to my review of the 1800 grants available this, posted about two weeks ago. I determined what the hot topics are for this upcoming year, and from that chose the grants that were not due in the near future and which emphasized research approaches and topics related to the demographics I am dealing with.
Over the past year, my work has focused on producing as many new algorithms as possible, reclassification and analytic routines, and testing the algorithms, math and their outcomes. Now that these formulas heave been pretty much validated (with the exception of the cost-burden analysis method, which is still in it final stages of multiple use QA review), they will be tested in several grant-funded project (assuming grants are awarded), as well as several other very fitting applications of their use. These other items are also detailed on the other page.
Posted by Brian Altonen, MPH, MS under Uncategorized Comments Off on Medical history and geography — top 30 pages, 2013 to 2016
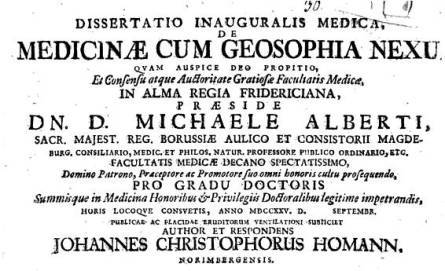
What I consider the first book on medical geography, in terms of: i) a complete study of cultures, their differences, and distribution around the world, ii) medical and health related needs and natural offerings for disease prevention and cure, and iii) all of these in terms of time and place in the world. This actual book may be reviewed atArchive.org, ormy page on it and the history of its author.
When I go through my site, and review its responses by the public (the world!) over the past few years, I cannot help but be amazed at the number of visitors interested in these subjects, as a learning experience. One of the things I have tried to remain humble too for the past two decades is how lucky I have been to tap into an unresearched or under-researched part of the history of medicine, that part pertaining to the culture and philosophy of disease, and how these vary around the world.
One of the more important lessons I had in all of this came from the religious scholars who speak of science as another philosophy, or way of explaining things. The philosophy of science is dualistic, in that it takes what is seen and define the other form or opposition to that thing and abides by the premise that these opposites exist. Since energy produces light for example, there is also this entity called darkness, when in fact, the reality of this scenario is that the absence of light is darkness, and darkness therefore is not a physical thing that must exist.
Now, it is important to note that this theory is found elsewhere in the writings–it is not my own. But it relates to the religious name for scientific beliefs called “scientism.” Scientism is the philosophical paradigm upon which all beliefs are based, in order that the best explanation of all that is found and seen can be provided. Since scientific observations guide scientists further, or in a new direction, that move then either reconfirms or cancels the ideology upon which beliefs are based.
On some of the earliest pages I wrote on this site about 8 years ago (for example, see my phenomenology approach), I summarized my teachings and discoveries of how and why medical beliefs change. Why is it that physicians were so convinced that they were right that they had to practically kill patients through the blood letting process? Why were such injurious processes as blistering, baunscheidtismus, the prescribing of purgatives, caustics, and emetics so important.
All of these “mistakes” disappeared once more proof as to a better way to treat such patients came to be. In my transformation of common belief , I argue that medicine survived mostly because practice and error were consistent, and that corrections always had to be made, the treatments had to be improved or made to be better. With success, we saw patients survive a health crisis, or become better, and/or live longer. With success, we dropped the older practices and substitute the new, until a still better belief and method complying with that belief can be discovered (see my anthopological cultural rendering of this recurring human behavior pattern).
Knowledge is the way to learn medicine, and my work on this site is to find knowledge not promoted much in the years before me. Unexpectedly, I found a lot of new concepts not yet taught in medicine, and was able to break the barriers that exist between the reading of historical beliefs and philosophies and relating them to the common themes that different cultures based their health practices upon. Many of the items posted on this page have never been posted or written before by previous medical historians, much less historic medical geographers.
Dr. Carl Friedrich Canstatt, whose book Handbuch der medicinischen Klinik, published in 1847 [in German], is the first book to provide a taxonomy of diseases that is based mostly upon environmental theories, including exposure to climate, chemicals, other parts of the human ecological settings. (I cover this book on this page.)
With that all said and done, I can report the following: several themes, topics and subjects continue to demonstrate popularity in the medical philosophy and history, and medical geography and spatial epidemiology fields.
The first is very popular to academia and the popular culture movements pertaining to alternative medicine, mind-body philosophy, and other cultural renderings or histories of health care and healing. The second is very popular due to the advancing fields and professions of medical geography, spatial epidemiology and research, and the rapidly growing GIS-guided research and professions, in the environment and health.
This first table is of the top 50 countries visiting this site and reviewing my information over the past 4 years. Some color coding is provided so the reader can follow the country across all four years. As expected, the United States is the top country to follow my posting on the value of spatial epidemiology, GIS and medical history. The United Kingdom, being the inventor perhaps, if not the most important influencer of spatial epidemiology and medical geography, is now second in terms of following this site, but is closely followed by its largest “sibling” Canada.
Canada is perhaps one of the leading countries in the world for use of unique spatial methods to evaluate the environment and the human impacted built-in urban environment. The U.K. is the creator of many of the ideologies we base our practices of medical geography upon.
The U.S. by the way is close to the U.K. in terms of its contributions to the fields of spatial epidemiology and medical geography. Were it not for the stubbornness of the early 20th century post-eugenics era scientists, and their pro-socialist sociologists and Marxists in the U.S transforming geography into two practices–environmental science and the controversial sociological alternative culture–the U.S. may well have excelled over the U.K. these past 75 years in terms of Geography field contributions. Our diminishment of “geography” from the pre-college programs and many of the colleges and university further diminished the roles of the U.S. in advancing the field of Geography; countering this were the U.S. contributions to Environmental Science.
Top 75 countries visiting my blog, per year from 2013-2016 (max number as of 2016 was 198)
Take a few minutes to let the variety of countries visiting this site set in. Medicine is a very hot topic worldwide. Many of the topics I cover are multicultural and crosscultural. Medicine itself is one of the most important topics for individual and group survival around the world. The skill of medical geography and mapping disease and health is equally important, at the worldwide level.
The unfortunate nature of the U.S. healthcare system is that it is making us fall far behind developing countries in how we utilize GIS and spatial health to the best of our potentials and ability. The fragmented nature of the U.S. healthcare system makes it difficult and almost impossible to produce a nationwide healthcare program, like other countries are now doing. That may be one of the benefits of socialized medicine in the decades to come, assuming our current HIT level remains stable and productive, and that is not hindered by political changes now happening around the world. An overtake of major forces, governments, ideologies, can have some drastic impacts upon the advances now being made in medicine, the internet, world information exchange, the iCloud, the use of medical and healthcare data to the best of our ability, in terms of fighting the health changes that may ensue in upcoming years.
E. N. Pavlovsky, perhaps the most important medical geographer and disease ecologist in Russian medical history, specializing (inventor of) in modern parasitology and the biology and ecology of vectored and zoonotic diseases(my introduction page on this).
This detailed review of the history of medical geography that I do is focused on the U.S. often, but is not exclusive of other countries, some more important than the U.S. is some parts of the history of this profession. The Russian medical geographers of the nineteenth century are not covered in any anglican writings in this field, which is a shame, for their theories in economics and ecology are in some ways better than those of western society.
In the following photography, the leader of Middle Eastern medicine up until the 1990s, Hakim Mohammed Said, made it a point that the ancient practices remain alive, practiced, researched, and documented. Globalization of health care can effectively makes many of these alternative practices extinct. The practice Said was most attached to was Unaniism, and its resemblances in theory to Hahnemann’s teachings of homeopathy. The political events taking place in the Middle East make some of the Iranian and Iraqian forms of practices extinct from common knowledge. Right now, parts of this medical philosophy and belief system are travelling the globe, and will soon be the next form of alternative/complementary medicine most of allopathy will be having to deal with, along with the health conditions attached to this philosophy of health (more on this at the end).
Back to the history of medicine in the Americas, when the U.S. established itself following the Revolutionary War, U.S. scholars set the stage to become important contributors to the field of Geography during the first 125-150 years of the existence of this new profession in US culture and academia. Many of the teachings back then were quire different from those of the Western European leaders.
Most of the teachings that appear in the medical literature at the time are all accurate environmental renderings of disease patterns, and are directly applicable to the sudden re-emergence of interest in new diseases migrating into the U.S. from afar, and to the return of the old diseases that once were considered eliminated. To best understand the older disease patterns, we need to look at how they existed and were dealt with during their peak ages of existence. Contemporary medicine has not yet taken on that task of relearning its historical background and knowledge.
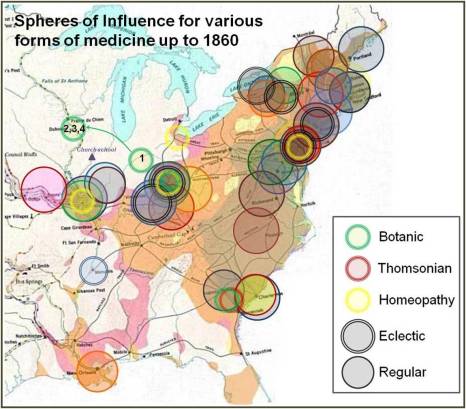
A very early project of mine, on the diffusion of allopathic and non-allopathic health professions in the U.S. from 1750 to 1860, based upon the establishment of medical schools and their geographic and political “spheres of influence.” (See my pages on this, Part 1 and Part 2,)
For examples of applications, review the maps I posted, many of which are the most important to medical geography history. Some of them are basic maps that we immediately understand. Others are maps that we wish we had continued to work on, so as to perfect this skills by today’s day and age, for now we are more than a century behind in this knowledge based, and back to beginner’s level for the most part in trying to implement the same exploratory processes.
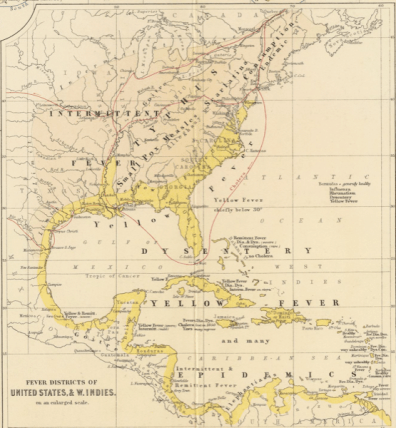
The U.S. experienced the first large area, large distance diseases to travel expansive waterways between continents, and to demonstrate quite clearly that there were latitude and longitude differences regarding disease behaviors and distribution.
The yellow fever outbreaks of the post-Revolutionary War years into the early 19th century were at first puzzling (“The Extraordinary Disease at Martha’s Vineyard”), but later better understand and gave rise to the development of the quarantine policies for incoming ships.
The cholera had stricken Western Europe a number of times, and European geographers were able to develop some very important hypothesis regarding spatial disease spread behaviors and patterns. British epidemiologists developed the models claiming disease spread patterns were in part due to populations, but perhaps more so due to living style, the distribution of poverty, and the practice of poor sanitation. United States geographers developed the models relating disease to urban density and what may now be called hierarchical diffusion patterns for disease transmission, an ideology re-invented in the 1960s by a U.S Economics Geographer.
Top sites people visited
Notice, the 1890 Census Medical Geography has surpassed the page with my personal information, an important change in the pattern of use of this site.
More important perhaps is the fact that geography and my review of geography as a historical medical geographer are now contributing greatly to fields other than healthcare, epidemiology and medicine.
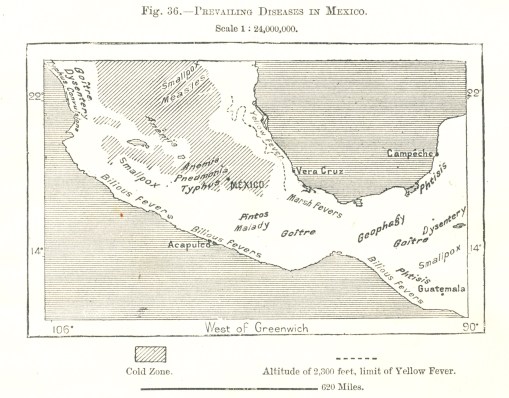
Native American, Indigenous culture and philosophy, and Indigenous health are teachings that stand out on my site. The immediate popularity of the fairly thorough work I did (from 1990-1994 about), on Chicle and the Chewing Gum industry is probably due to the large numbers of classes in the U.S. with Hispanic students and teachers wanting to find important topics that portray the contributions Hispanic cultures made to the history of the U.S. The late 1800s map of Mexico’s disease patterns and the regionalism of disease patterns is an important example of how we developed our “deterministic” philosophies during the late 19th and early 20th century (the eugenics period).
A map of the diseases of Mexico, from a World Geography set ca. 1897. The history, meaning and anthropological, cultural interpretations of these diseases and their distributions is extensively reviewed at my page on this map’s history.
When I began teaching in 1988, in fact, my goal was to point out the firsts in American and U.S. culture. This included the first uses of Native American philosophy for medicine, the first use of a U.S. plant for the more modern 19th and 20th centuries western European pharmacy, the first time we reviewed natural causes for diseases outside the human body, aside from temperament and inheritance.
I was also fortunate enough to uncover evidence for the first Jewish MD physician and doctor in the mid-Atlantic (New Amsterdam/New York) part of the North America–Dr. Isaac Marks. Researching him as part of the Revolutionary War doctor’s manuscript (Dr. Cornelius Osborn) that I re-discovered in 1981, opened the door to understanding and demonstrating colonial interpretation of the American Indian philosophies, and their willing to engage in new versions of older theories like alchemy in the New World, as the predecessors to understanding human emotions, spirit, emotions, and psychology (Harvard’s 1650 Charles Starkey‘s practice of this and its parallels with the Dutch (and thus New Netherlands) preacher and professor of medicine/mindbody effects–Hermann Boerhaave).
The first medical geographers
Disease mapping is also a major topic of interest now to medical history and geography students. The first disease maps came from the United States (although I wouldn’t be surprise if somewhere we do find some European mapper producing something like this in a manuscript collection). The local New York City patron of medicine in the field, Dr. Samuel Mitchell, published this country’s first article(s) on “medical geography” and may in fact be the first to popularize, if not both publish and popularize, this term.
The U.S. doctor next in line for the U.S.’s fame in this field is Valentine Seaman, of NYC, who produced the first epidemiology map. using it to explain the recurring seasonal yellow fever outbreaks in lower Manhattan. No one was in the famed city of Philadelphia was like Seaman or Mitchell, including the famous Benjamin Rush.
Benjamin Rush, however, did introduce to us other important “discoveries” and additions to the field of medicine, thereby distinguishing it completely from the medicine practiced in Great Britain. He produce the precursor to the idea that as land use patterns change with time, as will lifestyles and disease patterns. Rush didn’t take it as far as health and diseases, but managed to at least defined the impacts of land use changes upon the occupations and lifestyles of people surviving in different regions, ranging from farming communities, to villages and small town and larger cities.
Benjamin Rush and his important article proposing a sequent occupance type model is available for review onthis page.
With this, Rush provided the medical geography field the first example of a use of an ideology that would later be reborn again by midwestern U.S., helping scholars imagine and publish the sequent occupancy idea.
Although never related directly to just health and disease patterns, sequent occupancy was the preliminary idea that was born again later under the term epidemiological transition.
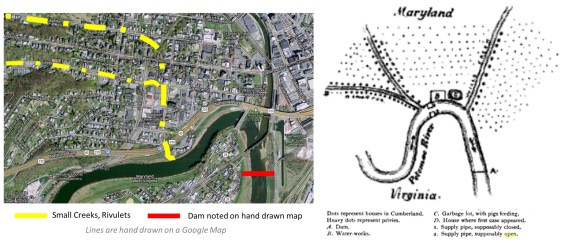
How the contamination of Cumberland city water happened by the seepage of waste from barkyard privies and city sewage overflow into the Potamac river, as revealed by Dr. William Wyett Wiley with the quickly handrawn map (right) subsequently published in a medical journal. [Fromone of my pages on this.]
For geographers, the sequence of change was popularized in 1890s (Derwent Whittlesey [professional obituary]), but then forgotten. The temporal-spatial disease diffusion process was explained and popularized with models published by geographer Gerald F. Pyle in the 1960s, and promoted further by his 1979 book “Applied Medical Geography”.
In 1832, Cholera entered northern North American via Canada and the St. Lawrence Seaway, impacting inland cities like Quebec and then almost immediately migrating southward to New York City by way of heavily travelled water routes. This introduction of cholera by way of major heavily populated places was first published by NY Medical Geographer Lewis Beck (Report on Cholera in Canada and New York, 1832). This hierarchical diffusion path was duplicated 150 years later when Ebola was introduced to North America for the first time about a decade ago, this time by airplane.
For epidemiologists, epidemiological transition is linked mostly, or only to scholar Abdel Omran, conceived in the late 1950s and 1960s, as part of the Columbia University school of Public Health, but not popularized until 1971 (see my page on his study as it relates to Native American epidemiological transition). Several attempts have been made to modify the Epidemiological Transition theory, to better fit the changes over time and new observations being made, but the sequent occupance model remains a more valuable and precise interpretation of changes in disease patterns over time and space.
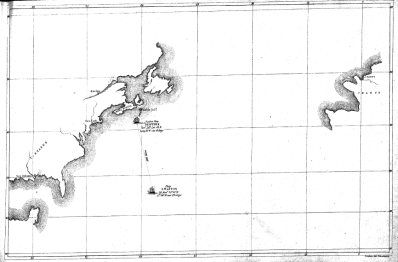
Thefirst map of diseaseby Valentine Seaman, Yellow Fever outbreak, NYC, ca. 1798/ mapped by its 1803 publication date; part of thefirst Medical Charts seriesever produced, used for defining insurance payments, by Sydney H. Carter’s Insurance Company in NYC; three examples of the first disease maps published in the1890 U.S. Census(area highlighted was reviewed for one of my studies posted on this site).
The ways in which medical geography can be directly related to epidemiological transition theory, through the sequent occupancy model, are defined in my thesis (posted by itself and the theory discussed briefly on several pages at this site).
The present state of utilizing GIS for surveillance by the U.S. managed care systems.
We remain at this level, although I am inclined to prepare for changes in 2017. Once evidence is published for use of GIS in ways other than “descriptive”, the medical profession will be heading into the next generation of GIS use, as an analytic tool.
Famous medical geographers
There are several medical geography topics that are going to become increasingly important in 2017.
#1
Islamic culture medicine has to be further investigated, with an emphasis on Unani and non-Unani medical practices. We are provided more information about the practice of Unani medicine through the Muslim India internet sites, than through Iranian, Iraqian sites–the two philosophies do demonstrate some important subjective, cultural differences (which I must cover later).
#2
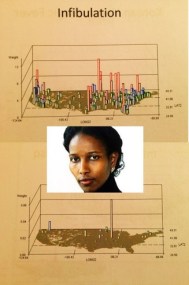
The impacts of Islamic practices (Unani and non-Unani, Sharia Law practiced) in the Middle East, on people migrating to the U.S. is going to have a profound financial and cultural impact on the U.S. health care system. Some legal impacts may be experienced and become problematic as well. The three most important issues uncovered to date are: infibulation (female circumcision) history and practice and its practice on children under 18 years of age, and especially under 9 and under 5 years of age. The younger the patient residing in the U.S., the more likely she will have received this practice while living in the U.S., by a U.S. MD or non-MD practitioner, including the use of methods practiced in some very “crude” ways (“broken bottle process”).
#3
The Obamacare PPACA plan may change or even go away, but the need to demonstrate cost improvements in healthcare will not. If the current PPACA is changed, disenrollment and increases costs may drive up epidemiological problems once again; without the development of spatial GIS methods in the American healthcare systems, we will certainly experience more unpredictable disease outbreaks, in lower income areas and in the form of in-migrated disease patterns.
#4
The BD2K (Big Data to Knowledge) plan now being initiated in health care–making available, testing, sharing and employing these larger datasets to develop more comprehensive population health research programs–will cause radical changes in the system, regardless of the program that exists. Insurance programs, if they continue practicing unengaged irresponsible, non-forward thinking healthcare practices, will ultimately lose their trustworthiness and integrity. The application of GIS to healthcare is one of the most time-saving methods for analyzing BD2K data thoroughly and completely, reporting the outcomes frequently.
#5
The numerous “genomic plans” developed to improve genome centered healthcare practices must be performed along with an equal number of “epigenomic” programs, designed to focus on the environment, neighborhood, people and health. This can only be performed using GIS or some form of Spatial analysis routines.
#6
Spatial analysis provides more accurate ways to analyze healthcare statistics. The hexagonal grid model I developed is 27% more accurate than traditional grid models. It produces smoother more realistic 3D modeling results, and is the visualization tool that must be utilized by the public medial geography sector to produce more accurate results, more rapidly than through the use of traditional modelling tools already in place.
Posted by Brian Altonen, MPH, MS under Uncategorized Comments Off on Disease penetration routes
To understand how diseases come into this country, especially epidemic disease patterns brought about due to natural history and ecological events, it helps to view their historical routes and their most recent routes.
The historical routes of disease transmission are well documented by the various medical maps published, a number of the most important of which are posted throughout this site devoted to medical history and historic medical geography.
I produced maps of the recent migration patterns of disease in this country about ten years ago, and have most of them posted in various sites, ranging from blog pages, to several of my old and new Youtube domains, to ScoopIt! and even Facebook on occasion.
The best way to find my way of interpreting and mapping diseases, both past and present. one need only type in my last name and whatever topi he/she is interested in. Now, I am not sure why this is the case, but Google has been very supporting of my work and pages, which may be because I like to stay away from heavy ads as much as possible.
In view of the recent penetration of this country by several important diseases migrating in, I have a few examples to demonstrate here of diseases that are foreign born. remember, there are common, very obvious routes of travel for people and disease. So they do tend to penetrate the US border by way of both coasts, and the Mexican border on up the Mississippi River valley. On occasion you seen diseases that favor the Pacific Rim route for penetration, or the east coast of California from the Caribbean, or the northern border where homeland security is concerned mostly with human borne diseases, not the tropical diseases, like Yellow Fever and a few from Africa, which successfully came into the US first by way of the Great Lakes inland routes and then the northern boundaries.
The following are posted because they are interesting diseases that I produced videos of, to then compare them to each other and come up with new discoveries, some previously unexplored spatial behaviors for international disease migrations.
Chiclero’s Ulcer, developed by harvesting practices engaged on the Yucatan Peninsula in Mexico.
.
Chagas. The cluster can probably be linked to migrations by way of a missions program or non-profit group devoted to this public health cocnern
.
Bejel, from the Middle East.
.
Yaws
.
Pinta and its various subgroups, with zoom-ins or close \-ups
.
Takayasu’s Disease, with zoom in to NY tried years ago for the first time, a disease from Hawaii and Japan (cited as Takosubo my mistake)
Posted by Brian Altonen, MPH, MS under Uncategorized Comments Off on All about Turkey Farms
From my page “The James Way” of Raising Turkeys at https://brianaltonenmph.com/historical-buildings-and-sites/the-james-way-for-hens-and-turkeys/
In view of the days ahead, I felt it to be a great idea to remind us of the stories we get told as kids about our history. One of these tales is that of the Pilgrims and the Indians and how “the first Thanksgiving” was spent.
Well, it wasn’t the first Thanksgiving as we know it today. But it may have been the first month when the cold was so terrible, that the first settlers didn’t think they would make it until spring. We are often taught that was not the case, since they somehow managed to have a fall time feast with “their newest neighbors” (or was it the other way in the original story?)
A changing of generations: the old barn and the new from a late 19th C to mid 20th C Turkey farm in Dutchess County, NY
Whatever the case, the tale of turkeys and “Thanks be to giving them to us” seems to have meaning in the U.S., oops. . . back then it was still an unnamed part of the New World, surrounding the hamlet of Plymouth.
A second generation farm on the same property, built ca. 1940-50
Several years ago I had the fortune of visiting one of the region’s most successful, big turkey farms, now gone to pieces and about to loose all of its relics from long ago, when turkeys were raised in densely packed buildings, grown from freshly laid eggs into two year old fowls, treated constantly for the risk of new contagions and vermin, thanks to the great researchers at the nearby State Farm College setting (Cornell).
Each section of these long barns held the fowl at different stages in life; the entire series of these slides, representing the different stages in growth, appear on the page links that appear on this posting.
The James Way farm was a barn that could be constructed in pieces. The invention of this new form of building construction enabled barns to be raised almost as fast as those of the Amish, but with a lot less people and neighbors.
Jamesway airvents in the ceilings
This series of pictures I took of this unique piece of farming history in Dutchess County is on a page I produced years back.
The end and middle of sections where the poults were raised, at varying ages. They were moved from the heat lamps near the hatchery to the caged areas at the opposite end of the floor over a few weeks. At this opposing end, they were fed a recipe laced with Fort Orange Turkey Starter, inspected regular by a licensed vet (Dr. Crum); this was to prevent bacterial outbreaks on their skin and in their respiratory passages.
This interesting tale of this barn and its sequel, a cement block version of it that ultimately led to the first turkey manufactories, can be found at
As the character of farms and their content changed, so too did their cost, safety, industrialization and methods of use. This transition or change in a business over time, and its relation to changes in land use patterns and natural resource requirements, is termed SEQUENT OCCUPANCY, a study of land use developed in the 1890s by geographers.
In the long run, there is not much difference in the way we raised turkeys about a century ago, and how they are raised today, except for the technology–at least in the big business setting.
A product perfected by researchers at Cornell University, for preventing avian diseases from erupting that killed off entire flocks
And yes, I am holding back on saying anything for the moment about some of the huge megabusinesses responsible for cloning and bioengineering farm crops–both plants and animals.
Few of us known that the first animal patent was secured by a NY Ivy League school around 1850-1855. It was for a cow that produced huge volumes of milk. The agreement made between the US Patent Office and the university was that the university was allowed to hold the patent, but it had to allow the “product” to remain in the public domain for all of its subsequent years.
Posted by Brian Altonen, MPH, MS under Uncategorized Comments Off on Liver Flukes – re-emergence in the U.S.
It is Veteran’s Day!
What important Public Health issues should this remind us of as public health, spatial epidemiology specialists?
War has always led to advancements in medicine. The Crimean War between England and Russia led to the use of large hospitals, the discovery of contamination and infection on recuperating soldiers’ lives, and the need to better patient care; due to the work of the famous Florence Nightingale, the nursing profession and school were born. The Civil War or War of the Union in the United States is where physicians first demonstrated the power of the antiseptic and the value of clean surgical practices; this war led to many amputations, and with time resulted in a need for a new profession–the prosthetic limb manufactories. It also demonstrated the value of ether in performing operations.
The Spanish-American way is where we developed the first large scale floating hospitals, with a complete hospital on board in terms of staff and supplies. World War I unfortunately was the first war where chemical warfare became common, and where nutritional deficits and appropriate foot apparel often seemed to be the determinants. During World War II, these ventures continued, and due to the development of the single winged airplane, the first studies of high altitude impacts on pilots were test, at research programs set up on Long Island, in order to document better ways for pilots to survive high elevation manuveurs, tolerating the cold and lesser oxygen pressures.
The Korean War gave us the MASH units. The Vietnam War resulted in the exposure of soldiers to some of the least health environments, due to natural pathogens and toxins, and due to the chemicals, insecticides, pesticides and defoliating agents used indiscriminately across the battlegrounds that soldiers traveled through.
The most recent wars have exposed soldier to innumerable potential pathogens and health impacting materials. From the Vietnam War on, the surgical practices of the military were forced to deal with high technology weapons and exposure to the unknown. At first, short term impacts on health were well documented. Now, as the decades have passed, the long term impacts of exposure to natural and manmade elements during the war are beginning to demonstrate another cycle in unhealthy effects upon the human body. The long term effects of Liver Fluke disease recently reached the news.
Liver fluke disease has local or native forms and one highly important Asian borne form. Whether the new cases documented for Chinese Liver Fluke are of some new local origin, or due to decades old exposure histories remains to be verified beyond any doubt. The International spread of disease like Liver Fluke, due to human migration or business (military) related travel should be of concern to the U.S., which has for more than a century worked effectively at keeping foreign born infectious and vectored diseases out of this country, for the most part. With the recent outbreaks of West Nile, Chikungunya, Yellow Fever, Ebola, and most recently Zika, the likely return of 19th century disease to this country seems inevitable.
A number of years ago I had the chance to, for the first time, generate maps of international diseases and how they were dispersing in the United States from about 2000 to 2010. To achieve this goal, I drew up a series of US maps demonstrating where the diseases from particular parts of the world are derived. As an example, the following is of Japan specific diseases, recognized by mapping the ICDs for these diseases and where their patients reside, based upon the 70M-110M patients EMRs that were evaluated years ago.
Japan
I also produced the following interesting review of disease from Africa . . .
Africa
The USSR:
U.S.S.R.
Middle and South America . . .
Middle and South America
Asia in general . . .
Asia
Australia . . .
Australia
Etcetera, etcetera, etcetera.
The follow videos were used for teaching. They were developed to show the value of using GIS/RS (remote Sensing) techniques to evaluate spatial data. Standard algorithms were applied to this 3D model I generated of the US disease patterns, to demonstrate the value of regular, squared and cuboidal spatial data analyses.
This video was used to demonstrate how to evaluate a disease pattern up close (around the great lakes this time), to determine possible diffusion routes for the illness, or its biological, ecology and/or zoonotic causes.
The following is applied to an actual geomorphogenically defined disease region, a disease dependent upon densely population area with a certain climate pattern, and a certain rock and soil type that assists the organism in its survival.
For each of the above videos I present here (of the hundreds I developed), many of these were very brief, but are the first depictions of this kind for the country, for so many people (1/4-1/3 the nation).
Veterans-related Spatial Surveillance
Fifty years ago, United States soldiers serving in the Vietnam war exposed themselves to a variety of pathogens native to the local waterways. Since the seventies, discussions on the long term effects of this war, besides the physical and psychological impacts of the war itself, focused on the long term effects of agent orange, exposure to local toxic chemicals, exposure to the waterborne schistosomes.
(for which, see )
Live fluke is one of the oriental water born diseases that has experienced its peaks and lulls in U.S. epidemiological history. The disease ecology of liver flukes in fact entails a number of diseases, not just this particular fluke now possibly impacting some Vietnam war vets.
The Farmer’s Liver Fluke natural in the U.S. impacts mostly the eastern half of the United States.
Another liver fluke is associated with domestic animals, the Feline Liver Fluke, which again demonstrates east coast dominance and lower latitude (high temperature) west coast dominance.
.
The Liver Fluke that the Vets are now talking about in the U.S. may be something they captured decades ago. But another possibility is the infection of these people due to their dietary patterns. There is growing concern about the infection of people in the US by poorly processed foreign foods. In particular, sushi is linked to a number of organism related diseases where the source is food that has not been fully processed.
Still, regardless of the source, veterans or in-migrating animals and people, the Chinese Liver Fluke has to be the most important growing concern for up and coming liver fluke outbreaks in the U.S.
The following illustrates the distribution of this disease in the US, up until 2012.
Notice the peak in the Seattle area, one near the Great Lakes, and two along the Mississippi River valley. The latter two are situated along a common route traveled by in-migrating Asiatic populations over the years.
The cause for re-emergence of the Chinese Liver Fluke version of this disease pattern in the U.S. should be our primary concern. Understanding its method of penetrating the U.S. might provide us with insights into how the other diseases from China and South Asia may penetrate this country.
The skills of analyzing a disease like Chinese Liver Fluke sets the stage for how spatial epidemiologists need to review other internationally dispersed zoonomic and microbial disease patterns.
There are also a variety of tick, fly and chigger born diseases that aren’t covered here, that may break out. Several forms of meningitis and encephalitis may become epidemic or endemic in nature in the U.S., should the borders not be managed and secured properly. Livestock diseases like Texas Fever and Bovine Tuberculosis, diseases eradicated in the nineteenth century, could very well return due to the lack of sophisticated monitoring systems established in the most important healthcare places–the managed care business settings.
In essence, this problem is in its infancy right now. World Health Organization already failed several times these past years with Ebola, Chikungunya and Zika. As the other opportunistic diseases arrive in the country, we will begin to demonstrate a reversal of the epidemiological transition that took place in the U.S. between 1820 and present.
For every century of growth that occurred in epidemiological transition, only a decade is required to reverse all of the accomplishments that were made. This is well demonstrated by the last decade’s worth of changes in public health, disease ecology and epidemiological complexity.
Of all the countries out there, the U.S. has the most to lose in terms of public health security during the next few years.
Michael Baughman
From the article:
“DANVILLE, Calif. (AP) — Mike Baughman considered himself one of the lucky ones, returning from Vietnam without any major injuries or psychological scars. But after falling ill nearly a half-century later, he found out he did not escape the war after all. . . .
” . . . The U.S. government acknowledges that liver flukes, endemic in the steamy jungles of Vietnam, are likely killing some former soldiers. Ralph Erickson, who heads post-deployment health services at the Department of Veterans Affairs, said about 700 cholangiocarcinoma patients have passed through the agency’s medical system in the past 15 years.”
From “Still fighting: Vietnam vets seek help for rare cancer” by
ROBIN McDOWELL and MARGIE MASON, Associated Press.
For more on this growing crisis in U.S. Public Health, see the related article, posted this VETERAN’S DAY, at
Posted by Brian Altonen, MPH, MS under Uncategorized Comments Off on A Review of Bioterrorism
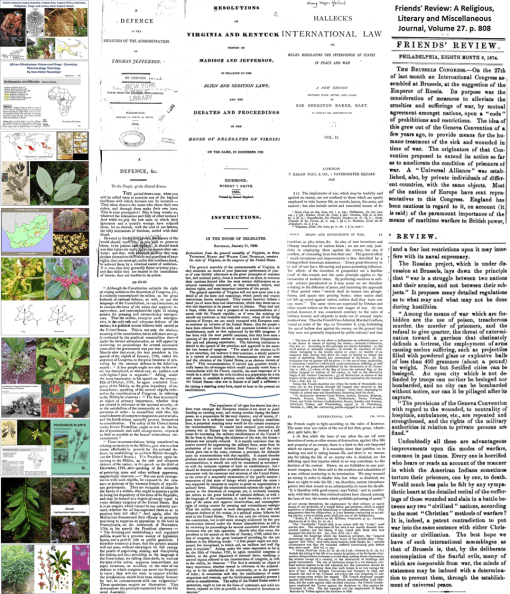
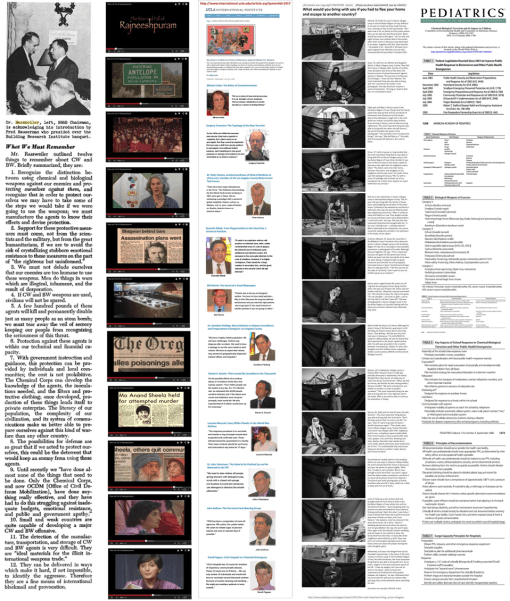
Above: Articles by Thomas Jefferson and Congress about National Security, and two early European articles on the early discussions of warfare practices and the use of chemical tactics
Due to the recent 15th year recognition of 911 and recognition the WTC tragedy, a number of people queried into my work in this field, ultimately convincing me to initiate a new study of the survivors of this incident.
This study, initiated four to six weeks ago, focuses on the long term exposure effects and chronic disease patterns generated by exposure to various physical and chemical substances at this disaster site more than 15 years ago. It uses spatial analysis and small area modeling of the entire ICD system, to compare documented victims in the registry with their neighbors with suspected causality due to proximity, unknown exposure history, but fully documented medical history in their EMR.
These images, above and below, come from my Bioterrorism Pinterest site at https://www.pinterest.com/altonenb/bioterrorism/
At my Bioterrorism site, I thoroughly review several centuries of military history as it relates to chemical and biological warfare events. It is the result of a fairly extensive project I have been engaged in on and off since the late 1970s, when I began teaching “Terrorism” classes to Emergency Medicine students, as an expert in neurotoxicology. (I worked in a neurochemistry lab for several years, specializing in axon and synapse chemistry and metabolism.)
These pictures and their discussions cover everything you can imagine, plus more. In my usual way, I focus on the obvious such as natural toxins, infectious disease warfare, and other substances, events and lessons related to chemical warfare and bioweapons.
Below: United States history and chemical warfare, and the birth of these unique chemical industries in the US, ca. 1880-1910. The first bioterrorism events in the US–carried out by the Rajneeshi Puram utopian group located in Antelope, Oregon. An International team engaged in discussions on this topic. Victims of one of the recent bioterrorism events and forced relocation. The development of a policy on how to manage these patients developed by physicians and published in the medical journal Pediatrics.
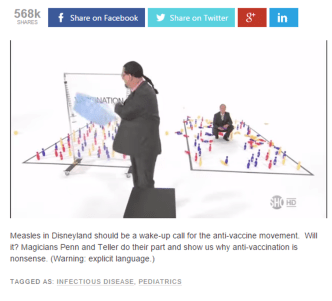
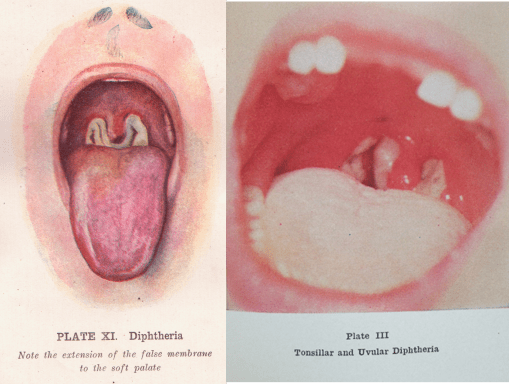
Posted by Brian Altonen, MPH, MS under Uncategorized Comments Off on Immunizable Diseases – Historical Pictures (with text)
.
What are the consequences of not immunizing your child?
.
This is an education video I developed for the classroom setting.
I updated it last year to include some additional information on the consequence of catching measles as an older child, because you were not vaccinated.
The presentation style is as a lengthy powerpoint (25 mins perhaps) meant for the classroom or classes at home. It has no narrative, but an impressive amount of historical photos of events in health that are rarely seen today.
This presentation is automated up until the last text page, before the closing page. (You have to click on that page to finish and see the end page.)
Posted by Brian Altonen, MPH, MS under Uncategorized Comments Off on Five Steps (or Six) for Improving Managed Care
Part I. Introduction
Over the past twelve years, I have worked on a number of electronic medical records systems, exploring their uses primarily as a spatial analyst.
Now of course, my employment for each of these positions was not as a spatial analyst. Rather, it was as a typical research associate, quality improvements specialist or compliance officer, data miner or analyst, BI or population health specialist, working for a state MCD/MCR/CHP/COM/Insurance program devoted to assessing the health of anywhere from 50,000 to 100 million members or patients.
Each time, I was engaged in the exploration, mining and production of baseline reporting at the population health level, there were several aspects of these systems that had to be corrected for in order to produce a highly effective spatial analysis tool for medical GIS work.
What stands out about these requirements for engaging in the spatial analysis of population health data is the ease at which such a program could be initiated. The fact that population health analysis is not carried out in any significant fashion by nearly all healthcare programs, insurance companies and PBMs, tells me that there is some sort of barrier to learning this new technology. However, working alongside others in this EMR industries, it becomes obvious to all of us that these barriers are linked primarily to middle and upper level management.
If you ask anyone familiar with GIS what such a system can do, you will get an endless list of examples, and most likely be told to go back to the library and look it up, since obviously you are not in touch with this new technological field.
If you ask the same of a healthcare technician, you have some chance of connecting with someone who is either familiar with or experienced with the values GIS offers the healthcare profession. Any sizable corporation with sufficient medical records, data entry and analytic staff, will probably have two or three individuals familiar with GIS utilization, mostly at the descriptive level.
People engaged in this task, or experimenting with its use, in the standard Cognos or Tableau tools will have some familiarity with how maps can be used as part of a powerful reporting tool. A more specific use of this technology could once again be lacking in these individuals.
If you ask someone associated with upper level Watson and EPIC tools are unlikely to be familiar with the value of surveillance mapping, at least at the professional, experiential level.
In recent months, there have been outbreaks monthly that could be evaluated using spatial analytic tools. Some of these outbreaks were very local, like the NYC Legionnaire’s outbreak. Others have been of national significance, like the Ebola transmission worldwide and the “discovery” that measles vaccinations programs have become a failure in recent decades. Still other outbreaks have emerged as regional concerns, their distributions predictable and explainable with GIS, by the use of climate, weather, temperature and human ecology mapping methods.
Very few of the tools we currently utilize, originating from the above defined businesses, are capable of depicting the detail of these outbreaks, defining their routes of passage and potential places of origin, or leading to the production of a valid predictable modeling algorithm for detailing their routes of travel, and times of passage versus outbreak. The current tools being used to handle managed care EMR serve mostly and introspective to retrospective surveillance tools, with just enough resolution to predict models at a fairly reasonable area-size defined level–namely the county, township or zipcode tract level.
Yet, an HIT-GIS is capable of producing valid population and public health data at the small area, very local, neighborhood-based, prediction modeling level. Exact routes, possible places (including homes) for outbreaks, and even future pathways of travel and diffusion across the country, can be evaluated and defined using the right tools and the right algorithms.
In the typical GIS research program environment, if you ask individuals for examples of these uses, you can easily come up with several dozen examples. In the health care environment, if you asked the same of these analysts, the experts will more than likely be the public health and epidemiology experts, and teams devoted to disease surveillance, prevention and healthcare maintenance programs, it is atypical to find a program engaged in much more than a couple dozen different types of analyses (PPACA requires 40-6o about).
Still, it is possible to use spatial analysis for managed care population health management and surveillance, for which hundreds to thousands of population health statistics are generated monthly, weekly or even daily. (Although, “thousands” might be pushing it!)
In a number of places, I published my lists of reports that I know by experience are possible. In particular, I am interested in reports that focus on the most important issues, like social sciences and health, health education/health promotion, cost/savings, inequity and healthcare practices, and quality of care rights for patients. A program that cannot meet the basic metrics proposed by PPACA (the “obamacare” plan) are in essence a failure when it comes to reaching the agency’s fullest potential.
This means the one third of insurance companies like BCBS, UHC, etc. that have or are about to fail to make the ends meet regarding the ongoing higher costs for care, are in fact the lowest third, the “last leg” in the innovation curve, the worst examples for the managed care insurance profession.
These problems in healthcare, healthcare insurance and certain managed care programs are reviewed and supported by other examples of my work at:
https://brianaltonenphd.wordpress.com/2015/10/26/more-on-the-plan-for-hit-gis/ The method for implementing quality of care and prediction modeling algorithms as a standard part of the MC HIT-GIS system. In my current position, I have the tool for analyzing any population, racially, ethnically and age-genderwise, for any ICD subclass applied to overall population health analyses, and special ICD subclasses predefined by past researchers for the evaluation of individual health risks (Charlson Score, Elixhauser score etc.).
https://brianaltonenphd.wordpress.com/2015/10/19/a-policy-for-the-development-of-a-hit-gis-system-in-managed-care-dissertation-related-work/ This delineates further the steps an agency, business and/or healthcare facility need to undergo to develop a spatial medical GIS program as part of its institution-wide programs. Ironically, and quite unfortunately, the way managed care works, is that policies prevail when making important changes. Adding GIS to a managed care system in order to explore thousands of health metrics per day seems to be asking quite a lot of these programs. The irony is, it takes only a few hours to run a well-scripted program that can pull data, evaluate it, compare it, undergo statistical analysis, produce tables, graphs and maps, and then output these in logical format into a powerpoint or word report that can be mailed to management–ON A DAILY BASIS. Such a process allows specific days of the week and month to be designated for producing and distributing specific reports, like those devoted to program comparisons (i.e. Monday through Friday as: MCD, MCR, CHP, the Rest, ALL), cultural health (White, African American, Asian, Other, All), special age group studies (Genomic diseases, Developmental, Childhood, MidAge Health, Elderly Health), Culturally bound and rare diseases (White vs. others, Black vs. others, Hispanic vs others, Asian vs. Non, Outstanding or Unusual rare ethnic groups), SES patterns (Area specific reporting, program specific reporting for CHP and other programs successes, Low Income needs special services, QOC, visits and noncompliance reporting for each of these groups, Upper income group health care strategies compared with lowest income groups), and with a financial focus (comparisons across the board to cost, relative to all in-hospital, emergent/urgent care, preventive care/visit procedures, effects of cost on follow up to recommendations, impacts of cost to specific regions, relative to annual amounts allocated to each facility/region.)
https://brianaltonenmph.com/2015/04/15/hex-grids-are-essential-to-developing-a-more-effective-medical-gis-workstation/ This is the exploratory, introductory page to a new technique that I developed the algorithms and math for in 2004. After posting mention of that algorithm in 2009, the number of people visiting my page skyrocketed almost overnight. I suspected I hit upon a growing popular topic, and after a few months of seeing the following grow, decided to release my algorithm to the public (I was saving it for a job opportunity), since the GIS community in the workforce setting was still catching up with the basics. Since then, the Hexagonal Grid page and the Download page for this tool (the original Excel I used, which I keep promosing to upgrade soon to an SQL and SAS version as well), has been viewed by about one fifth of my visitors–the major country interested in this technology is, of all places, Canadian Urban development GIS specialists. Most other managed care or even traditional health care agencies have yet to understand the value of being 27% more correct in the tool that you use for spatial analysis (which I prove at https://brianaltonenmph.com/gis/population-health-surveillance/grid-mapping-disease-in-the-united-states/ ).
https://brianaltonenmph.com/2015/10/29/mcs-goal-for-2016-solving-the-financial-crisis-of-healthcare/ My criticism of the current system regarding its inability to develop a comprehensive spatial analysis tool and program. This criticism is not only directed at the programs and overseers (PPACA, NCQA), but also the companies, COs/Pres/VPS, and other agencies with the ability to bring PPACA into a new generation of HIT-GIS success.
https://www.linkedin.com/pulse/algorithms-brian-altonen In 2015 I transitioned from national health spatial analysis to densely populated, megalopolis regions analytics processes. This transition enables me to retest my algorithms at the detailed spatial level, even street and neighborhood level. A number of highly controversial topics were evaluated in the very beginning, in particular local data confirming the asymmetric behaviors of some genomic disease states, like the male-female survival rate differences noted for one commonly carried disease. This work also demonstrated THE ROLES THAT RELIGION DOES PLAY on whether or not certain religious families are more likely to bring their patient in for unusual disease screenings and rule outs. It also allowed me to confirm my suspicions about most of the culturally-linked diseases I have identified, and the unique religious-ethnic post-violence behavioral patterns of patients when it comes to reporting child and adult/wide/spousal abuse; in other words, some religions are more likely to report than others.
https://brianaltonenmph.com/gis/populations-and-managed-care/big-data-and-managed-care/ This page starts with an overview to the value of big data in facilitating what I termed “ACER” analysis of patient populations. At the bottom are links to my pages on how to design to design a cultural health analytics and public health screening program that is more complete in its approach than the typical NCQA program. Contemporary HEDIS and NCQA interpretations of the value and meaning of health and EMR analysis for non-caucasion groups is, needless to say, still too “ethnocentric” or focused on white population health metrics.
https://wordpress.com/stats/insights/managedcareinnovations.wordpress.com As the title implies – – my innovations. Or to be more exact, those “secret” IP related sql and SAS codes that I use to generate my 3D mapping results without GIS. The majority of algorithms you’ll see at the methods I developed for reclassifying data. The most unique algorithm is how I recode the religious religious groups, to put those with similar philosophies together in terms of how they relate to disease, its meaning and purpose in life, the reason for healthcare practitioners and their responsibilities. There are also algorithms here for ICD regroupings (of which I use many) for risk related analyses, the three standard risk scoring algorithms for patient risk assessment (Charlton, Elixhauser, and the Federal Chronic Disease Score), infectious and zoonotic disease surveillance reclass algorithms, race-ethnicity reclass, several culturally-linked and -bound ICDs, etc. etc. Click on the ‘Codes and Population Health’ for a drop down with more on these.
https://nationalpopulationhealthgrid.com/author/altonenb/ My site devoted to just the non-GIS spatial mapping technology. How to produce spatial imagery without depending upon a GIS or GIS related cost. This process requires beginners to intermediate level experience, with intermediate SAS programming experience preferred for complex comparisons between race, ethnicity, gender, religion, age range, gender, SES status, and area.
https://brianaltonenmph.com/about/surveillance-3d-modeling/ A site I developed to document this work on the internet. This was produced following a heated “interview” with on the the nation’s primary EMR companies, responsible for developing HIT systems for numerous managed care facilities and companies. In essence, this company felt that HIT-GIS was not needed for this profession and the healthcare process to develop, which I contested. This company simply stated my technology would go nowhere. Its rivals, also in contact with me, threatened to develop their own IT process for producing these end products devoted to spatial analysis of population health. Those arguments by the way occurred in 2012.
https://nationalpopulationhealthgrid.com/ To date, no major company has been able to produce an effective HIT-GIS tool for analyzing data down to the square inch of an urban setting. This site was developed and opened up in order to document my discovery of this algorithm and process for 3D modeling of disease and public health patterns, by then a nearly ten year old skillset.
Part 2. Creating your own Managed Care Population Health Surveillance HIT-GIS Program
To produce an effective MC HIT-GIS program, the following steps and actions are recommended.
Step 1. Evaluate. Determine, Define and Describe Needs and Potentials.
Prepare the EMR for spatial analysis and Medical GIS performance.
To perform spatial analysis, two things are needed:
location or spatial information, preferably in the form of a latitude-longitude dataset for each member of the patient population (we’ll skip lat-longs for the providers and facilities for the moment).
An analytic tool or process in place that enables researchers to produce spatial information about these data, in the form of descriptive, exploratory, summary visualization products, namely the production of maps depicting the content and meaning of the environmental, demographic, health, disease, service and financial data stored within the system.
These are the only two additions to an EMR that are required for Medical GIS to be incorporated into a managed care [MC] health information system.
According to the Precision Medical Initiative (PMI) about to be underway, managed care[MC] system will ideally have several spatial analytic processes in place and being used or experimented with.
The current ways Medical GIS is being promoted is via a single platform, single analytic system process. Large companies like IBM, Cerner, have platforms in which patient care can be entered, kept track of, monitored, and even reported using primarily their tool. Reasonable approaches for these tool enable some related company-invested or non-invested software packages to be included, such as by enabling parts of the ESRI GIS process to be meshed or engaged in as part of the larger HIT platform.
Multiple tools however mean the data itself has to be utilizable as well by other unattached software products or packages.
SAS spatial analysis (versus SAS-GIS), for example, is an easy route to take in producing semi-automated, highly powerful analytics that cannot be produced using the common platforms and packages now being promoted. SAS alone can be used to produced visualizations that neither EPIC, nor most traditional GISs, nor IBM Watson-Cognos, nor Alteryx-Tableau are capable of producing. SAS has the ability to produce these visualizations within the everyday work setting at hundreds to thousands of objects (products or maps) per day. The advantage to self-scripted queries using this method is that the math is traceable, provable, and can be modified or upgraded with ease. There are no limits to the type of math use, nor the details at which the data are developed. Whereas very large platforms provide the data at an areal level that is hard to change (i.e. attached to town and zip centroids, usually not to patient place of work or stay), it is up ti the developer/user of SAS programming and tools to determine the limits of the applications for any new algorithms that are developed.
Step 2. EMR/HIT Preparation.
Of what value is the current HIT EMR system?
There are a number of related factors for HIT and the EMR that impact whether or not MC can develop a functional GIS. Nearly all of these are frequently reviewed and re-reviewed in respect to HIT, PPACA requirements, and the EMR.
Quality of data within the EMR is the most basic example of this. We have the three most basic problems with EMR data:
absence or presence of data,
data content and structure, and
data form.
Arguments concerning the absence or presence of data are obvious. Data can be missing because they were not included in the plans to develop a system, or they were included, but their content, structure and format weren’t well planned and so they are inconsistently entered, or they are not entered for other reasons, such as
a lack of engagement at the data entry (office or clinician) level,
a lack of understanding of why data are important, resulting in reduced query for the data (worker:patient relationship), and subsequent entry of that by employee, or in some cases by the patient, and
the unwillingness of the clinician to ask a question or unwillingness of the patient to answer the questions needed for the EMR to be of maximum use.
In a recent review five very densely populated urban government boundary settings within a single megalopolis contained within a single state border, one of the five areas had a 45% lack of data completion when compared with the others, that missed only 20% of the data or much less. Any of the above three reasons, or a combination thereof, may be responsible for this severe lack of important population health related background data on the patient population.
Step 3. The Planning Stage.
Plan. Plan!PLAN!!!
Developing a plan for the implementation of a Medical GIS for a managed care system requires that measures be developed and engaged in at multiple levels.
Contemporary MC systems use their EMR to monitor population health in accordance with PPACA requirements. During the past ten or fifteen years, the ‘meaningful use’ [MU] part of the PPACA was preceded by quality improvement activities (QIAs), quality improvement programs (QIPs), performance improvement projects (PIPs).
In a managed care system where the plan is to monitor an entire population health, the HIT-EMR and Medical GIS processes must include projects focused on the individual patient, patients’ quality of life, disease groups, surveillance/monitoring, service industry, providers/programs, health care specialty, interventions, public health, environmental health, “precision”-based (genomic), regional, community, neighborhood, special interest group, financial, and government/potential investors levels. PPACA, HEDIS, NCQA programs alone do not satisfy this more complete population health focused approach to MC programs. The “Big Data” version of EMR utilization requires that all these levels be assessed.
Step 4. Implement HIT-GIS.
Implementation of a successful managed care HIT-GIS requires that a number of methods of analyses be established, maintained, further developed, and improved on a regular basis. Ideally, these plans are somehow monitored and/or managed by a single director who is responsible for maintaining the breadth at which Medical GIS in being engaged in, and the various values it can be used to demonstrate and the technology, IT, HIT, mathematical, statistical, BI, and institutional corporate level. BI, EMR, Medical GIS may together be used to produce an effective predictive modeling program for use in redirecting and improving upon long term quality of care standards and the resulting cost-effectiveness of care relationship.
Step 5 Testing and Production.
Diversify the implementation, testing and production process.
Have two levels of engagement established.
Utilize a variety of methods to establish spatial analysis as part of the MC program.
There are many HIT-EMR processes that are required of programs, such as the HEDIS, PPACA MU and internal QOCs/QIs used to define the value for a MC program. These standard, usually annual assessment processes occur and recur at and institutional level, and should be integrated with a Medical GIS program developed to meet institutional needs.
Step 6 (if necessary).
Contact me!
Part 3. Critique and Conclusion
Can GIS be included in the next phase of Managed Care development, and the program known as the Precision Medical Initiative (PMI)?
The value of GIS in the PMI is that for the first time, we can assign particular human genomic traits related to illness to a map. The mapping of illness has been around for several centuries. When it was first developed in the 18th century, there were few comparisons made between cultures, and the focus was on latitude, climate and disease.
But during the 1800s, physicians went beyond the latitude theory for disease and began incorporating topographic and meteorological features into their pre-bacterial, pre-microbe way of understanding disease. Once the bacteria was discovered and proven, our focus on disease patterns and causes turned to the microcosm of the human body, and focused on our anatomy, physiology and cellular chemistry. All of these in turn were related to the bug, germ, microbe, bacterium, virus, what have you, that came to infect us, cause us to become ill.
With the human genome project now to the point where genetic counseling has led to the development of genomic pathway treatment modalities, the older notion of race and temperament, those causes which led to Asians and eastern Europeans bearing one type of illness, and the Prussians another, is now back in the medical literature to such an extent that “mapping” disease bears that double entendre–mapping the gene within and mapping the disease linked to that and where they are in the world, where they evolved as a part of some local society.
The Precision Medical Initiative is going to make GIS an even more important part of the HIT system, combined to form a HIT-GIS. HIT=GIS programs may in fact have some of their predecessors already in place in the medical profession. The younger more innovative, potential management and CO employees are more valuable in the long run than the current leaders of Managed Care. Unless a CO, VP or President of a MC system is learned enough to profess expertise in how to design and HIT-GIS to successfully produce both microcosmic and macrocosmic maps depicting human health, such leaders may soon be seriously outdated in their intellect and understanding of the architectural design of human health, population health, genomic health.
There are many institutions that have smaller special topic, exploratory or experimental, and even self-defined HIT-GIS groups established that are testing the value of these newer, alternative methods of analyzing health data.
Once these smaller GIS programs are established in a MC system, they are usually functional at the office, group, even small department or sub-department level. Moving this analysis process from lower level to upper level defines whether or not it is a success at the inventor, special team, or departmental level. The ability of an institution to use a Medical GIS as a symbol of accomplishment should be the long term goal of any team or individual engaged in this process. The limiter to this success is demonstrating some value for the end products developed using Medical GIS techniques.
The majority of MC programs so have internal small group programs using GIS in some way to evaluate a little of their data. These programs use the Medical GIS for specific purposes. One common example of this is the use of Medical GIS in a manner that is already employed by environmental health and disease intervention programs functioning within a public health program.
Common diseases or health conditions evaluated spatially include HIV, diabetes, asthma, smoking, and drug addiction. The impacts of poverty, race/ethnicity, teen pregnancy, and SES on small regional health statistics are also common applications of GIS to a basic MC like setting.
The barrier to producing a larger Medical GIS in MC is the lack of interest in this new technology at the upper level and the unwillingness of programs to diversify their quality improvement/population health surveillance processes. These special interest topics like HIV, street drugs, poverty, teen pregnancy, serve as an arguable reason to bring Medical GIS from the department level on down, into the corporate level of development, implementation, use and integration. Combining the notion of mapping disease genomically and demographically, culturally could greatly impact the need for GIS in a managed care system.
The very common large software packages and Big Data HIT platforms in part allow some of these uses to be implemented, although not at an advantageous small area level. Disease mapping requires more than just point-arc GIS or a raster system that is GIS. The GIS for HIT-GIS must be polymorphic in its capabilities, activities, and performance. These values are what turn partially useful spatial analysis tools, programs or systems serves into a reason for supporting (though not promoting) further development of GIS in Managed Care. The costs attached to these products may or may not help the institution or corporation develop a medical GIS that is both highly productive and impressive, but they will help us improve our understanding of mankind and mankind’s health, past, present and future, as a product of natural and human ecology, and a result of our interactions with the macro- and microcosmos that make us who we are.
Space, disease and time . . . with only time at a standstill!
Posted by Brian Altonen, MPH, MS under Uncategorized Comments Off on How will Spatial Analysis and GIS Impact the Next Generation of Managed Care Programs?
With Managed Care receiving limited support from the masses this presidential election year, one has to wonder if the current PPACA (“Obamacare”) program will survive another year.
When the presidential race is over this coming fall, if either of the two most supported candidates is elected, there will more than likely be changes brewing in how to resolve the issues that hold our healthcare system ransom in the United States.
Same image, different rotations
For example, my personal speculation is that if Hillary Clinton get elected, that the attempts might be to continue riding upon the system already in place, under the claim that some things need improvement, and the financing needs for effective management and control, but in the long run, we will simply take what it now in place and change it to make it more effective, more consumer friendly.
If Donald Trump is elected, the resolutions formed in my mind are less convincing or indicative of attempts to maintain some status quo and stability. In the worst scenario, healthcare will be placed more into the hands of private businesses again, and those programs devoted to the underpriviledge lower class fortified as they have always beenm being available to those most needy, but considerably more thought our in terms of determining those who are eligible.
This means that in-migrating people will not easily acquire such coverage, those moving here for work related reasons, be it permanent or temporarily, will also have more “hoops” to jump through to earn their coverage. That will service the current system greatly, in terms of finances, but re-open old wounds as the previously uncovered masses, who briefly entered some sort of healthcare status under Obamacare, will once again be left to fend for themselves. Some of this impact can be lessened, with certain eligible members maintaining their eligibility due to such things as young mother and child status, or having to deal with some life threatening chronic diseases state. But the least qualified people who were fortunate enough t obtain coverage in recent years, may again be out of luck by the time a new program is put in place, should the next President-Elect be Donald Trump.
Fortunately, it will likely take one and a half to two years for any new health insurance managed care program to be implemented. That will lessen to brunt of change this nation might endure, whichever way we go.
Some evidence suggests that Hillary Clinton might opt to produce some formidable changes in the Obamacare plan, were she elected.
This begs the question:
What might the best changes be in such a system, were it to be established as an extension in the current program that exists, yet meet the financial and service industry needs in ho the newer way to manage care gets developed?
For one thing, eliminating “Obamacare” is easy. Change the program, get rid of that title that now has a tremendous amount of hatred and regret attached to it.
But we might only need to eliminate a very small of the PPACA plan in order to satisfy the public masses.
The most important elements to PPACA are the transfer, change and implementation of healthcare into a high technology supported industry, complete with information technology never perfected before by any single healthcare plan (and yes, none have perfected it, no matter how grandiose their thinking and self-judgment appears to be to colleagues).
The information technology systems in healthcare today, known specifically as health information technology or HIT (like this label avoids to scary innuendo of the title IT), are still struggling now more than 15 years into managed care, and nearly twenty years into their complete development and implementation.
Generation after generation of IT fears and barriers have surfaced and resurfaced, demonstrating that the healthcare insurance companies and masters of the health economics industry aren’t as wise or able as they want us to think. A change in technology occurs quite readily and in months to a year longer, through simple acceptance of the technology and willingness to test its application. But one could argue that insurance companies and businesses fear IT advancement due its financial impact upon their individual financial securities, and morality targeting impacts upon the leaders, people and companies that have to use this new technology.
Insurance companies lose considerably once they see solid evidence for overcharging (we can leave the fraudulent billers and overbillers out of this argument even). Insurance companies will lose greatly once their additional charges and unnecessary charges are uncovered. The waivering tendency for insurance to assign value and price to specific procedures will raise some red flags, more than they have been doing since this issue was described to the public several years ago–for example, why is the PET costing $175 for medicaid, but $675 for privately insured individuals?
With presidential-elect changes inevitable in the next year or two, how will IT itself — that skill set which insurance companies have failed to support or engage in — determine the lifespan of the long-lasting stubborn companies unwilling to engage in the EMR, EHR, IT, HIT, HITECH Act requirements used to define PPACA?
The truth is, these IT developments are here to stay, whether you like them or not. They have already demonstrated their value, and provided evidence to necessitate their further development and use in the healthcare billing and insurance industries. Even if meaningful measures lessen to some extent, leaders and common sense workers will not engage in lessening or reducing their production of proofs that changes are happening.
With IT/HIT development, we will learn more and more about effective and ineffective certain companies, programs, facilities, neighborhoods, insurance plans, mail pharma companies, allied health programs (bogus or not), and counseling and family support service agencies will be when included as part of the broader, long term minded, preventive-palliative healthcare programs many places are trying to develop.
So IT/HIT must stay for these companies to document, and brag about their successes.
Adding GIS to this only strengthens whatever arguments are going to be made, and making it easier to convince you audiences, in whatever direction you want.
What prevents spatial health work from becoming a part of the managed care system is not just lack of intellect about what it is and what it can do (everyone knows a map can portray, or lie). What prevents spatial health from becoming a part of the healthcare system is the lack of knowledge, desire, experience, and skillset on behalf of leaders, to put forth the option of developing such a program in order to save their own business significant amounts of money.
There are a few companies out there that are experimenting with spatial analysis.
But I have yet to see one inkling of evidence that any industry out there is able to analyze its entire popular for the 15,ooo ICDs and ICD groups, the 4 fold as many visits as patients, the 10 to 20 fold number of procedures these people engage in, for 10 to 20 years of long term EMR/EHR history held secure as part of the older medical records systems.
A few companies have 20+ years of EMR on file (I work for one). GIS demonstrates outcomes that these data produce, that no other MC can produce through much of the country. Likewise, insurance companies and health businesses that manage the insurance aspects as well, such as KP, have developed partially functional spatial analytic systems that may have the ability to perform full reporting for a full healthcare program.
The question is: what will be the first company to emerge that is able to create a full-fledged GIS/Spatial analysis based version of the QI improvement report, detailing thousands, not hundreds of the most important population health features?
These features must include the following:
Human genomic data and disease history and spatial analysis
Emergent/Urgent care data, past and present, in reference to age, gender, etc.
Religious group data in relation to specific ICDs and medical events, compliance and non-compliance, and social and moral public health related disease or injury related risks
Race-Ethnicity derived reviews of its regions and communities in relation to population health, place, economics, and cultural traditions.
Socioeconomic status and predicted employment pattern related health care coverage, disease and success in relation to place, time and money
Chronic Disease (CD) management databases, devoted to hundreds of CDs, engaging in predictive modeling of these costly populations
Standard endemic disease pattern public health surveillance
Atypical epidemic and foreign born disease patterns and travel in relation to local regional health matters (local Legionnaires, Ebola, Chikungunya, etc. types of studies and prediction models)
The differentiation of standard linear versus hierarchical diffusion modeling behaviors and patterns pertaining to locally-specific disease patterns
A remodeling of epidemiological transition theory to best meet the needs of the local populations being served, with specific attention paid to economics, business and health, using the sequent occupancy model proposed on other pages posted at this site.
This survey is developed to determine how ready the healthcare profession is for the spatial analysis of health and health-related costs by a managed care system.