Posted by Brian Altonen, MPH, MS under Uncategorized Comments Off on Peru declares emergency in 14 regions on El Nino worries
Peru has declared a 60-day state of emergency in towns in 14 regions to brace for possible damage from the climate pattern El Nino in the rainy season, state media reported Sunday. Peru has forecast a “moderate to strong” El Nino in the winter season and has not ruled out an extraordinary event in the summer, which begins in December in the southern hemisphere. The phenomenon, a warming of Pacific sea-surface temperatures, has wreaked havoc on local fishing in Peru and triggered landslides in years past.
Back around the turn of the 19th century (the late 1800s), cycles became a pop culture craze (like dozens of times before, and after). During the early 1900s, professional journals began talking about the cycling of weather, and its effects upon finances, crop production, the job market, and the resulting political and social turmoil these changes often created.
The American Meteorological Association came to be around 1910, and a number of theories for cyclic weather patterns were published. The most popular one was the Sunspots Theory, which claims that weather patterns were impacted by the changes in solar radiation related to sunspot activity due to the solar flares and “solar wind” that were produced. Now, all of these changes in the energy patterns for the Solar System were in fact quite true. But the association of these natural events with manmade events on the earth’s surface was hard to accept.
So those in favor of this theory found many more ways to support it. Some even proposed secondary cyclic patterns, which went in and out of resonance with the sunspot cycle. This explained still more events then awaiting recognition.
The cycling of finances, in particular stock prices were still hard to accept this as an explanation for. We could easily accept this argument for food industry products like corn, soy bean, grains. Meteorologists had demonstrated some links between drought and the solar cycles. That was enough to hush everyone who was against this theory–it had indirect implications–hard to provide either way.
But then out came a new rendering of this sunspot theory in the 1980s–the La Nina-El Nino cycle theory. It provided another explanation for atmospheric changes, that couldn’t always be correlated with the solar winds (which are true events, the winds are energy related).
When I returned to college it was my intent to link the Asiatic Cholera outbreaks over time to this philosophy. I spent several years researching this, even returning to some of my dendrochronology work that I did back in the 70s. But then, I turned to the Cycles journals again, and took issue with how the natural cycles were being compared once again to finances, automobile manufacturing and sales, changes in gas and electricity stock prices. An ecological approach to studying cholera cyclicity and peak outbreak times, based upon La Nina-El Nino theory, was in fact possible, due to the use of GIS to review these past popular culture themes.
Naturally, over time, my interest in the cyclicity diminished once GIS came to be my tool at hand, instead of my handy increment borer for extracting tree rings and using the tree ring cycle data sets shipped to me from the leader in this field (evaluated on a 286 PC).
EMR/EHR, Big Data, the iCloud, and GIS can now be used to test these older pop culture theories. We can prove once and for all whether or not the cost for growing coffee beans in parts of Africa will influence the country’s ability to control its other social and economic problems, not to mention the events leading to the next spread of Ebola.
Yes, there is another cycle starting, but now we can begin to monitor it from day one. If and when there is an outbreak, we can define how and why it had everything to do with El Nino, or nothing at all to do with the oscillation of global energy patterns.
This cyclicity and global energy phenomenon was also used to explain global outbreak patterns in the mid-19th century. The British Surgeon in Charge at the Military Hospital in Crimea, Ukraine, was removed to Jamaica in the Caribbean following the medical disaster that struck that place during the Crimean War.
In Jamaica, he came up with his theory as to how the magnetic fields generated by the earth could be the cause for the moving and cycling of yellow fever outbreaks around the world. The earth’s magnetic fields moved about, as did the yellow fever outbreaks. As a result, his theory–Robert Lawson’s Pandemic Waves Theory–was published by esteemed medical journals. After all, he was a member of some of the Royal medical societies. He drew up what he called “the World Isoclines Map” ca. 1860-1875, and used it to explain the outbreaks.
Sound familiar?
We are back to square one with evaluating the impacts of climate and natural cycles on disease patterns and outbreak behaviors.
With the right GIS in place, this controversial issue could have been resolved ten or fifteen years ago, all except the cycling periods of indecisiveness that politics and medicine–global health patterns–are riddled with. Perhaps it may take a recurrence of a past disastrous outbreak, to lead to enough research, to at least resolve this issue once and for all. And even then. we may still be left not knowing how and why Chikungunya, MERS and Ebola behave the way they do–but of course that may also be due to the lack of GIS implementation, for people health, not just ecological health.
Peru by the way is a hot spot for vibrio ecology studies and a natural setting where vibrio has become naturalized. It bears the classical and two most dangerous strains are linked to this Asiatic Cholera disease nidus, in particular the El Tor.
Visiting New York City yesterday, it was clear that the southern tip of Manhattan is now the center of homeland security surveillance.
New York City should be the center of surveillance for any spatial epidemiology program.
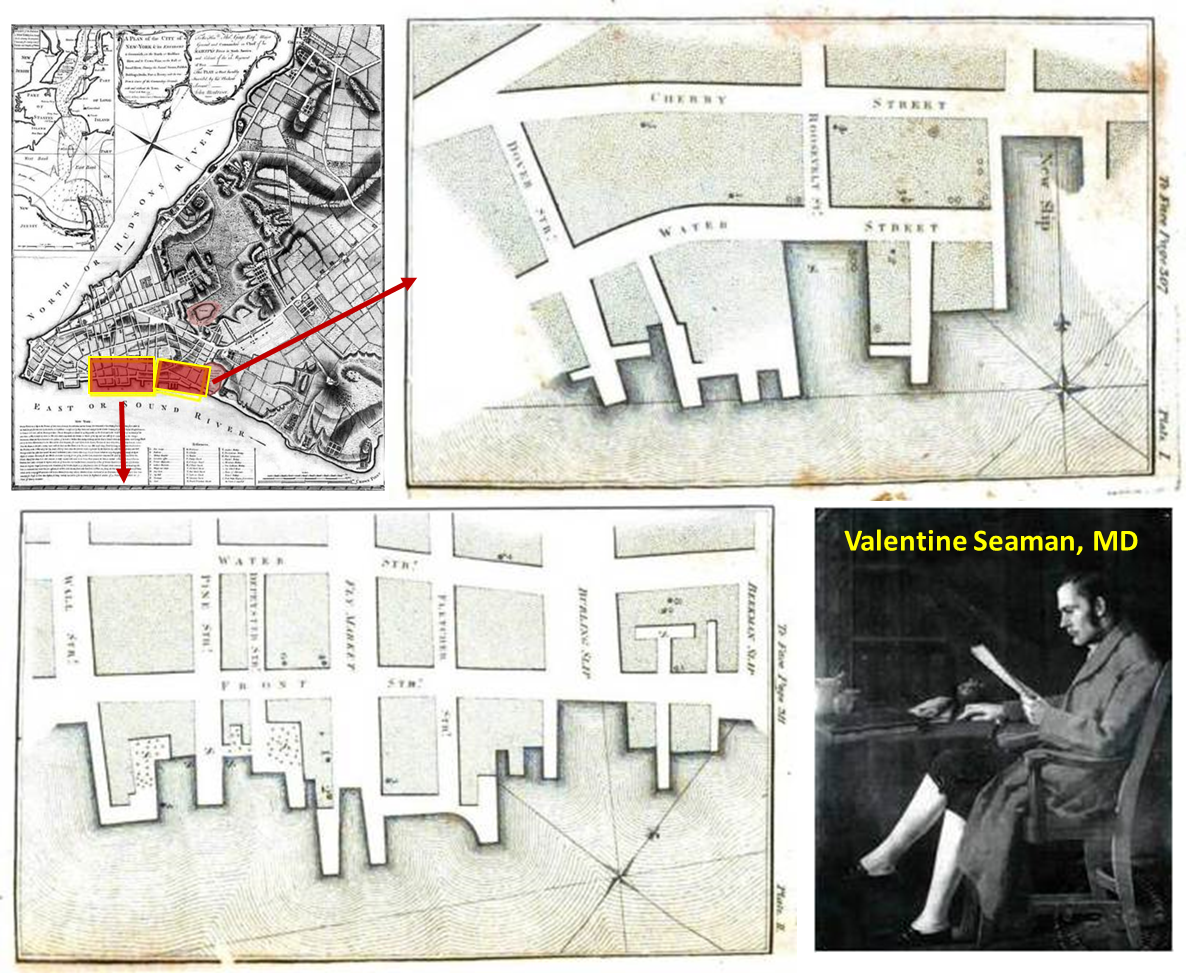
The very first disease map we have on paper was produced in the late 1790s by Dr. Valentine Seaman of the medical school in New York.
He was trying to determine if yellow fever was of local origin or imported by ships (our famous Benjamin Rush blamed it on imported coffee beans that went sour).
A number of past yellow fever outbreaks made their way into this country via these slips and piers. More would follow, for example malaria, cholera, diphtheria, typhoid, and most recently west nile and measles (Palisades Shopping Plaza, 2013).
The rates at which people move in and out of this location are unimaginable. The other day, at about 2:30 in the afternoon, in just fifteen minutes I saw more than a hundred ferries and tourist boats, helicopters, subways, air, land and water taxis, city and tourist buses, and private tourism vehicles.
Three hours later, as I took leave from this area, I could see they were dropping off more than a thousand locals and tourists per quarter hour, right around dinnertime.
This meant that the routes leading from South Street Seaport to the 911 Memorial Museum were filled with thrice as many people than typically seen at this time of the day. You couldn’t help but follow them.
The travel routes were well defined by roadblocks. These well-defined routes to the Memorial were secured by nearly a dozen different types of public service, military, guard, national park, and homeland security units. Need I say, surveillance cameras were everywhere, and as this new story indicates–they were even way overhead in the form or aerial and satellite surveillance. The subway I was heading to was in this general direction. All I had to do was follow the masses, then take leave once I reached the tunnels.
When I got close to the entrance to the subway station, enough people were heading underground to fill the stairways. I decided to hold off a half hour, and so headed to where everyone else was flocking, the 911 Memorial. You could see hints of this setting two blocks away. There was a new rib-like display in place, mimicking the skeleton of a fish or fallen building, I thought.
Now, imagine having to trace the source and predict the path of a biological outbreak that originated here in upcoming days. That is what a Biosecurity Unit can do using GIS.
Posted by Brian Altonen, MPH, MS under Uncategorized Comments Off on California Lawmakers Vote to Limit Vaccine Exemptions for School Children
California lawmakers voted on Thursday to substantially limit vaccine exemptions for school children in the most populous U.S. state, an initiative prompted by last year’s measles outbreak at Disneyland that sickened more than 100 people.
It is exactly 100 years since there was a significant outbreak of small pox in Niagara Falls, NY, a town that had just incorporated several years earlier.
We have now we have gone full cycle on the reasons why Niagara Falls had such a memorable small pox outbreak–at least to some medical historians.
The issue hand: mothers decided not to vaccinate their children due to the anti-vaccination movement going on. Animal Rights activists were its primary instigators. Due to public pressure, New York allowed parents to decide on their own if theirs kids were to be vaccinated for a number of infectious diseases. They called this ability to opt out–"compulsory."
Just a few years into this movement, 1914/5, a number of states had developed strong anti-vaccination movements, and large percentages of children began to attend school completely unvaccinated (85% to 100%). In some towns, with strong religious leaders, in politics as well as the law, outbreaks ensued as a result of a lone infected person attending the same school and coming down with the infection.
A significant small pox outbreaks ensued in Niagara Falls due to this.
It is now 100 years later, and the Measles outbreaks of 2014 have just passed. This outbreak started in California for much the same reason. Once it took off, it quickly made its way back east to the same part of western NY where small pox made a brief stay.
Ironically, both of these times we put Canada at risk, due to the same human behaviors in the U.S. and and the same economic geography and physical geography related reasons.
So I wonder what Canada has to say about all of this!
Posted by Brian Altonen, MPH, MS under Historical Medical Geography Comments Off on More on the Stats for this Site
The research question for this review is: How many “unique people” visit this site?
By unique, I mean unique names. Individuals may return several days per week, and each day gets counted as an individual person, and each page they go to as a unique visit. But at the end of the week, one person who visited several times per day, daily, will be counted as at least seven individuals. So I worked on a way to evaluate the numbers of unique people who come to this page/site. For this review, I focused on the main page.
To accomplish this, I reviewed the numbers of visits, developed an equation for calculating numbers of visitors for entire 5.5 years, based on the last three years, and came up with estimates/guesstimates on the numbers of unique visitors.
In general, the average number of pages visited per visitor is between 1.5 and 1.75. The value 1.5 means that approximately 33% see just one page and 66% see two pages. (1:1 is 50% see one page, 50% see two pages.)
.
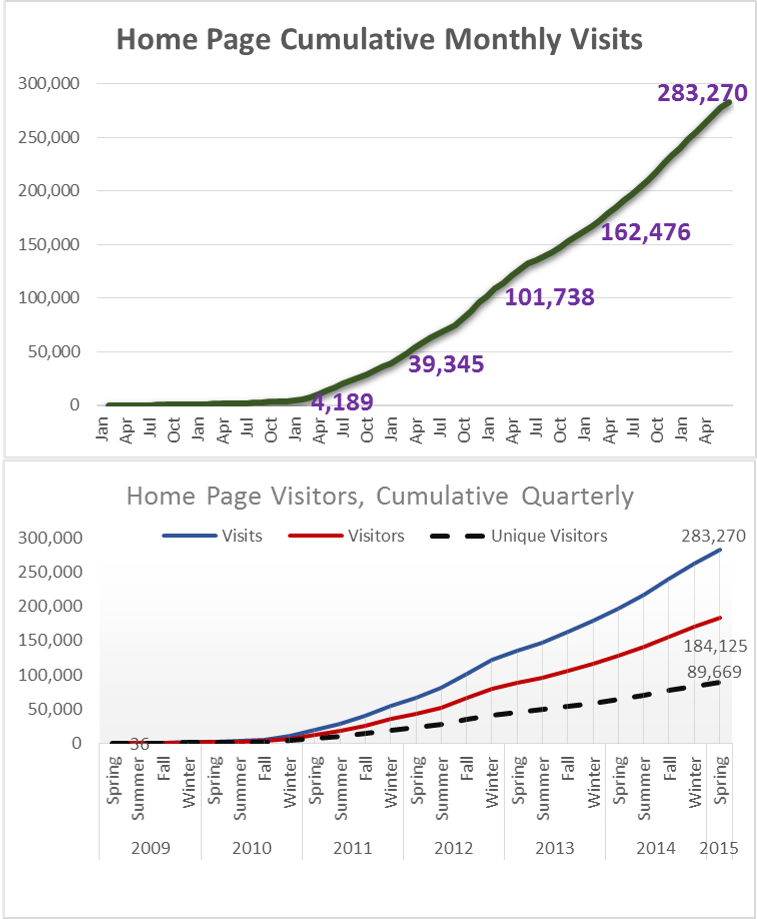
This first set of graphs depict values per period, illustrated as quarterly and yearly. These are not cumulative data. Over time, the numbers of followers continued to increase. Again, this is the number who visited just my main blog page, no special pages on the topics I review. Typically, a person first visits a special topics page, then looks for the main page to see who the author is.
For the first quarter in 2015, which I call “Spring”, I had 77,474 visits. (Jan-Feb-March is actually Winter, but I called the end of the year “Winter” for this review.)
A cumulative of this period is as follows:
This is a conservative estimate, based on the 1.5 value noted earlier. It takes into account the influx of new members each month, and then estimate how many of them return over the remaining periods, per month and quarter.
The conservative estimate of number of people impacted by this site in just under 90,000 people.
It is estimated that about half of these visitors are doing work or research in medical GIS. The other half are visiting for information about medical history and/or medical botany, and/or due to links from other places such as LinkedIn, ScoopIt!, Tumblr, and a few other sites that re-post much of my work. (I recently learned get on the average 1300 to 1500 re-posts per new blog/home page posting, per special search engines, and about 15 reposts of my work by other ScoopIt! sites.).
The less conservative estimate for individual impacted, by my pages only (not the LinkedIn and others), increases this number to 100,000 or more.
So, I need to add–many thanks to all you out there revisiting this site.
ESRI still has links to the historically important historical medical geography maps and articles I have posted, so I appreciate this support from ESRI as well.
I am in the process of translating the text (handwritten script, in Old German, using Old German medical and geographic terminology) and determining how to reproduce the famous disease map of Friedrich Schnurrer, ca. 1827 (figure below). It is the first map of diseases, globally, based on his review of the literature for the time. His work focuses on the famous epidemics and diseases documented by earlier writer. Schnurrer was an expert in Chinese culture, and perhaps produced these maps due to the cholera impacts on China before it turned into a pandemic.
Posted by Brian Altonen, MPH, MS under Uncategorized Comments Off on Alien-Like Worm Invades US
A bizarre invasive worm with its mouth in the middle of its belly has been found in the United States for the first time, according to new research. The New Guinea flatworm (Platydemus manokwari) is only a couple of millimeters thick but grows to be up to 2.5 inches (65 millimeters) long. As an invasive species, it’s a threat to native snails — so much so that the Invasive Species Specialist Group of the International Union for Conservation of Nature (IUCN) lists it among the 100 worst invasive species in the world.
What insights does this provide to disease ecologists?
The ability of small invertebrates to make it pass the security checks also means that other hitchhikers like then and the hitchhikers residing on these hitchhikers could make it into the U.S.
We traditionally maintain a high alert for obvious pathogens, like the mycobacterium species responsible for bovine tuberculosis or the ticks that can make their way in with farm animals.
The New Guinea flatworm is now causing U.S. ecologists to be prepared for yet another disturbance in the food web and cycles. The flatworm itself is not a health concern. Since the 1970s, the invasive "jumping worm" from China has been a pain to U.S. fishermen; it doesn’t stay on the hook that well due to weak musculature and lack of tough skin.
But these small organisms serve as ecological test species for those mapping the unique pedochemical, hydrologic, and climatically impacted behaviors of these organisms as they make their way into this country. Modeling can be done with the pre-vertebrates, to establish baselines for how to map the same environmental features once an pathogen-carrying host makes it past the security checks.
The impacts of a mistake can be quite devastating. Not just due to diseases, but also due to the potential these organisms have upon food and livestock security. So the best of us who read news about a possible foreign agent coming into this country, also have public health in mind.
Perhaps it’s time to review those older studies of diseases we’ve managed to avoid the past 50 to 75 years. Re-emerging diseases are not just those that arise as examples produced by human pathogens. We can get away with ignoring ecology when we study primarily human-based diseases; but when anthropozoonotic diseases become the issue, we have to convert to a more natural ecological means to perform our Medical GIS.
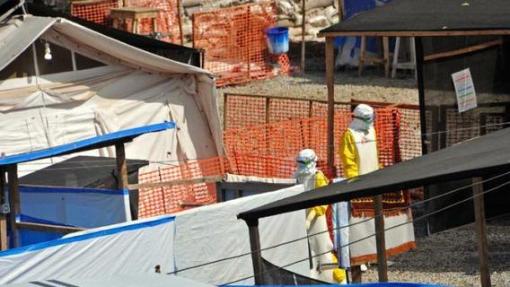
Posted by Brian Altonen, MPH, MS under Uncategorized Comments Off on Ebola spikes again in Guinea, Sierra Leone: “WHO’s on First?”
The number of Ebola cases has risen in Guinea and Sierra Leone for the second consecutive week, the World Health Organization said Wednesday. In Guinea, 16 new cases were found in the week ending June 7, with 15 more found in neighbouring Sierra Leone. In the previous week, 13 new cases had been found in Guinea, a clear increase on the nine reported a week before that.
. . . Third Base . . . . Forgive me for being a political satirist here, but I would like to say (and post) the following for this news :
“Let the games begin! We will start out the season with WHO vs. MERS, and then follow it up with games involving the Ebola team. Then WHAT’s Second?. Counter-Defense Crews (the anagram here) will make their way into the games, once they win out in the American BA (BS Artists’) series. ABsA and NBsA will then go face to face for the greatest game of all—the World Series. But only those customers caught distracted by watching the games are the real losers here–forgetting their safety when it comes to wild throws and foul-balls. But isn’t that really what this “game” is all about? Errors by in-field mistakes?
(What we don’t know is when is ‘I DON’T KNOW’ up to bat? That’s the big question here!)”
Posted by Brian Altonen, MPH, MS under Uncategorized Comments Off on Four Diseases in Prussia
These four maps demonstrate the significant spatial differences in distributions of four disease patterns. The four mapped diseases are Diphtherie (Diphtheria), Unterliebstyphus (Typhus), Lungenwindsucht (Tuberculosis or Consumption), and Sumpffieber or Wechselfieber (Malaria). Diphtheria is dependent primarily upon people. Typhus is due to a combination of transportation, population density and people. Tuberculosis distribution is defined by a combination of topography, climate and pedological (soil) features in relation to people. Malaria is an example of the classic host-vector zoonotic disease migration problem that plagues the world for nearly two centuries by the time this was published.
The influences of Prussian (German) cartographers and medical topographers/medical climatologists dominated the medical and disease geography profession between 1800 and 1850. When the first influential disease geographer became famous, Alexander Keith Johnston, the map he produced (https://brianaltonenmph.com/gis/historical-disease-maps/alexander-keith-johnstons-famous-map-a-detailed-review-1856/ ) was up against three very reputable maps produced by three German medical cartographers.
British mapmakers had less a sense of authority in this profession globally at the time. Supplementing the German leadership in this field was the purely geographic taxonomy for diseases developed by another Prussian/Germanic cartographer and specialist in this field in 1847 –- Dr. Carl Friedrich Canstatt and his book Handbuch der medicinischen Klinik (https://brianaltonenmph.com/gis/historical-medical-geography/dr-carl-friedrich-canstatts-handbuch-der-mediziniche/ ), in which the classification of diseases was perfected based upon a combination of environmental and human population features, including topography, climate, population patterns, wildlife and plants, natural disaster events, solar and even barometric influences.
Like many broadly read and trained professors, he had the knowledge background needed to map out the underlying climatic, environments, temperamental, evolutionary (pre- or Social Darwinian), cultural, anthropic, toxicologic, geologic, climatic and biological nature of the large numbers of diseases documented by explorers and missionaries around the world. Schnurrer also managed to review the famed plague epidemics and a variety of race-ethnicity related histories of diseases, and placed his observations on his map, detailing a part of medical history that has barely covered since and before this work was accomplished.
In light of these findings, from my work on these four most important maps in the history of medical geography, it now makes sense why this 1880 map on four Prussian diseases in the Germanic part of Europe remains one of my top visitor sites.
Posted by Brian Altonen, MPH, MS under Uncategorized Comments Off on Experts denounce WHO’s slow Ebola response
A UN-sponsored report on Monday denounced the World Health Organization’s slow response to the Ebola outbreak and said the agency still did not have the capacity to tackle a similar crisis. “It is still unclear to the panel why early warnings approximately from May through to July 2014 did not result in an effective and adequate response,” an interim report by a six-member expert team said. WHO only declared a global public health emergency on August 8 — almost five months after the outbreak had taken hold in west Africa. The panel, set up on March 9, is led by Barbara Stocking, who formerly headed Oxfam.
It was April 10th, 2014 when I posted my first review and warning about Ebola’s migration habits or patterns, and the need for Medical GIS to be available outside the WHO and CDC settings. It is important to remember that WHO and CDC are organization, pretty much agencies behaving like businesses, that have other agendas to consider. The primary agenda is world stability, politically, financially and, oh yeah, healthwise.
Two more months passed before either agency paid much attention to the facts about ebola. Unfortunately, even the total facts about spatial habits of diseases like ebola. was a knowledge base both WHO and CDC lacked enough experience with to foresee the reasons for the upcoming cascading of this outbreak.
Historical epidemics demonstrate these patterns. They have their ebbs and flows just like the plagues and contagion before. For medical historians, it is nice that history repeats itself; this concept however is most because people repeat themselves, including their bad habits and poor learning curve following recent and new outbreaks.
We allocated money in the wrong directions. Pharma companies effectively convince investors and health officials that they had the cure. Internal benefits linked to these actions helped fuel these tests of the new medications. The patenting of a bioengineered plant phenotype that produces an antiviral drug was one result; the proof that we (NIH and CDC) need to patent the deadliest ebola of all, because we need to have control of this bioweaponry – – against future outbreaks that is.
Instead, this money should have been completely allocated to just two things–surveillance and cessation/prevention activities to prevent the further spread of Ebola.
When it comes to the global outbreak and rapid rise in numbers, nothing is final. While Liberia celebrates, the disease remains active just across the border. In fact, we saw this happen between at least 3 countries in Africa. While you appease one side with money and tactics, the carriers remain at large. This is due to ignoring the first warnings, lacking an effective intervention plan for when the outbreak ensues, lacking trained professionals with expert experience in the plague known as ebola, and inadequate education and experience as an organization–no proper foresight. We always forget our mistakes deliberately–we can’t accept them and handle them–and we certainly won’t admit them–so the line in this articles taht states: "Now comes the challenge. The challenge of working with our two neighbouring countries. To make sure they reach the same level of progress that we have reached" means you still have a lot of convincing of others to accomplish–this epidemic is not over.
The Solution: Eliminate current plans and procedures, replace inadequate staff, invest more in the GIS/HIT needed for surveillance and reporting outside the two major agencies, and regional/state/county agencies with attached agendas. Each business (insurance or tertiary care giver) has a responsibility for trusting only itself when it comes to smart corporate decision making. Big Business suffers the most, when expenses needs to be covered for an outbreak their auditors and regulators failed to prevent. Its like a government charging the taxpayers for not fixing up the roads.
Too much favoritism and elitism are found in medical profession behaviors. Crozier and others failed to abide by their own public health and safety rules. And there is no way this will even NOT HAPPEN. People are into "the self"–the self’s desire for some fast food picked up by a drive through (where the card or paper money spreads the disease, like it did with cholera), the self’s desire to get home or to a relative’s place no matter what–no matter how many hundreds to thousands of people you potentially expose directly and indirectly. We punished the newscaster who did not abide by her requirements; we failed to treat the others accordingly. Nature showed Crozier that he made a terrible professional decision related, unethical mistake.
SOLUTION: be more responsible in catching and/or quarantining these types.
It is not over until it’s over–and perhaps may never be over. This in fact should say, "A third new group of experts who reviewed the outbreak of Ebola felt WHO and CDC could have performed better." The "Unified Entity" some nations are talking about is idealistic, not realist.
What happens to WHO influences and/or also happens to CDC. Recall, there was a 180 turn around in CDCs claims in July 2014. For just one day, WHO’s statements were in disagreement with CDC’s statements, claiming that there was a new outbreak that required immediate reaction.
SOLUTION: 90% of all surveillance per ICD/disease type should be done outside WHO and CDC. Multiple agencies interacting with each other make it less likely for governmental decisions to endanger local, national or global public health. 90% of all public health activities, for an outbreak like ebola, or measles, or cholera, should be performed by local interest groups first using GIS, then the national and international groups. And those local groups should encompass more than just your regional, county or state health departments.
Posted by Brian Altonen, MPH, MS under Uncategorized Comments Off on Measles dangers linger for years – Predictions for this Public Health Disaster
Measles can harm the immune system for up to three years, leaving survivors at a higher risk of catching other infectious and potentially deadly diseases, researchers said Thursday. It was previously known that measles could suppress the body’s natural defenses for months, but the findings in the journal Science show that the dangers of the vaccine-preventable disease last much longer, by wiping out essential memory cells that protect the body against infections like pneumonia, meningitis and parasitic diseases. “In other words, if you get measles, three years down the road, you could die from something that you would not die from had you not been infected with measles,” said co-author C. Jessica Metcalf, assistant professor of ecology and evolutionary biology and public affairs at Princeton University. Measles is one of the most contagious diseases of all.
Sometimes, we in the health profession are so behind in our protocols and knowledge base. This public health concern regarding measles has been around for more than a decade in popular culture; western medicine in the US and developed countries have for the most part has turned their heads away from this important health matter. Any individual with a child should be concerned about the current immunization refusal problem for this very reason–SSPE.
The single most important public health risk to pay heed to in the upcoming years is SSPE or Subacute Sclerosing Panencephalitis, a medical condition that ensues several years after a child come in contact with measles before being vaccinate. SSPE develops when the measles virus re-emerges in the body, and infects predominantly neurological tissue.
Historically, SSPE prevailed in parts of Europe where vaccinations for the disease were scarce. More recently, cases have erupted in developed countries, due to families with parents that refused to allow their children to have the measles vaccine, of due to exposure of their child under 1 years of age (vaccines are given to 1+ years old), to someone else’s child who has the measles due to lack of vaccination.
SSPE is placed next to an unfortunate outbreak of Poliomyelitis in children as the most costly, most debilitating, most deadly class of re-emerging diseases linked to childhood immunization refusals in the U.S..
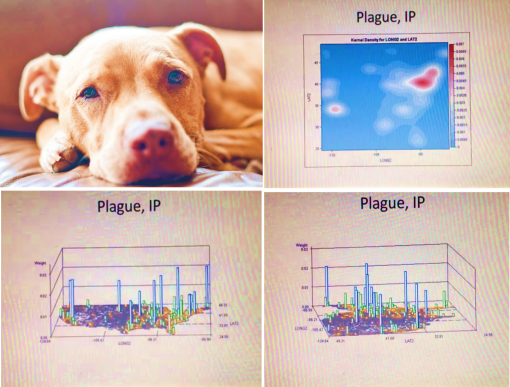
Posted by Brian Altonen, MPH, MS under Uncategorized Comments Off on Sick Dog Coughs on Owner and Gives Him the Plague
“In the U.S., the pneumonic plague is found among prairie dogs in the Southwest, and an estimated 8 people contract it every year.
“The bacteria that causes all plague, Yesinia pestis, is also found in the infamous bubonic plague, spread by rats in the Middle Ages and responsible for wiping out millions of people in Europe. (Note: pneumonic = respiratory, bubonic = lymphatic)”
"And according to a newly-released U.S. Centers for Disease Control and Prevention report, one Colorado man contracted the potentially fatal infection when his pit bull terrier coughed on him.
His dog started showing symptoms (including fever and a rigid jaw) last summer and was euthanized. But days after the dog’s death, the owner was admitted to the hospital with a fever and a bloody cough. After 23 days in the hospital, he successfully recovered, along with three other people — one of his friends and two veterinarians — who were also infected."