.
I recently had an article published in International Journal of Epidemiology ! ! !
Brian Altonen. Commentary: John Lea’s Cholera with Reference to Geological Theory, April 1850 . International Journal of Epidemiology 2013 42: 58-61.
Access at:
JohnLea-Cholera_IJE-Article
.
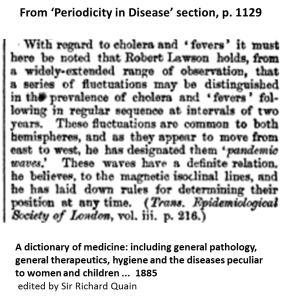
The Law of Pandemics
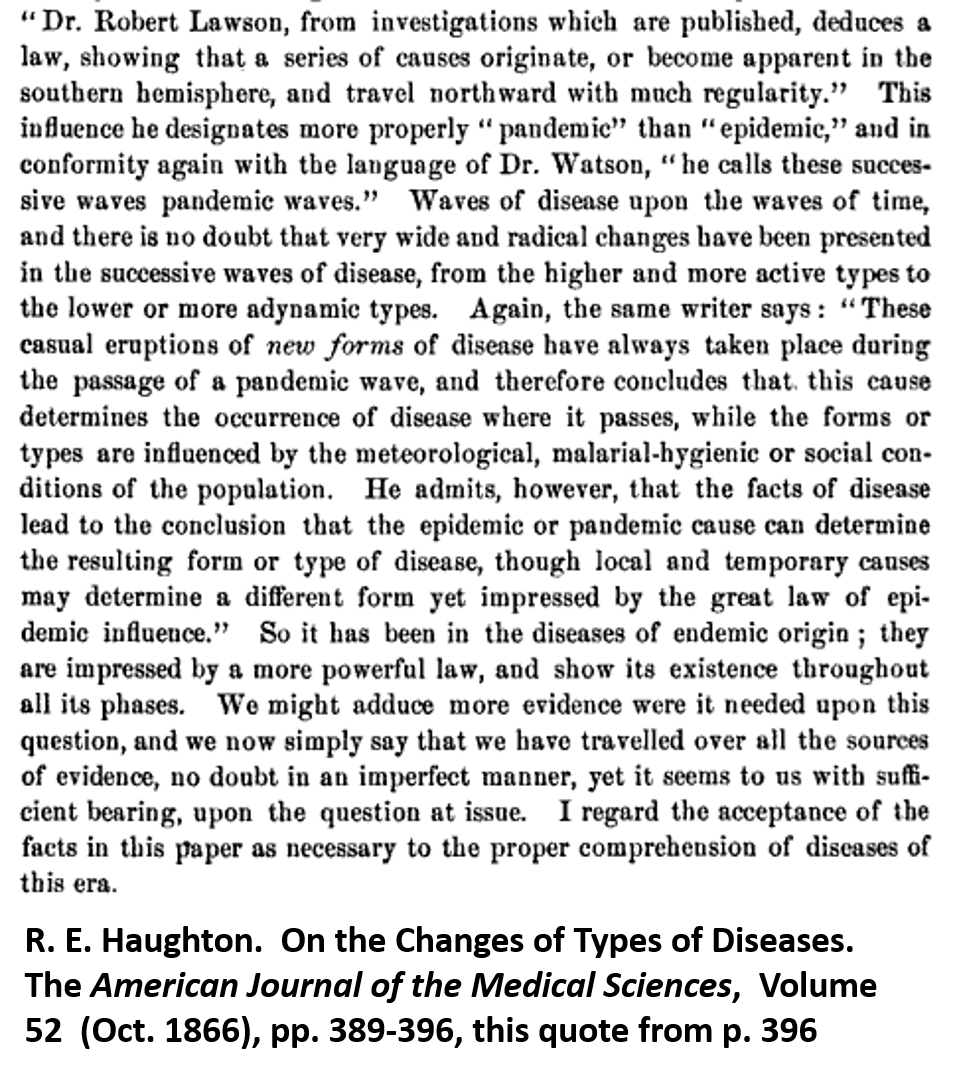
An unexpected development in the history of medicine came in the mid 1800s due to the discoveries of Alexander Humboldt, Karl Freidrich Gauss and Richard Faraday. Robert Lawson invented the Law of Pandemics.
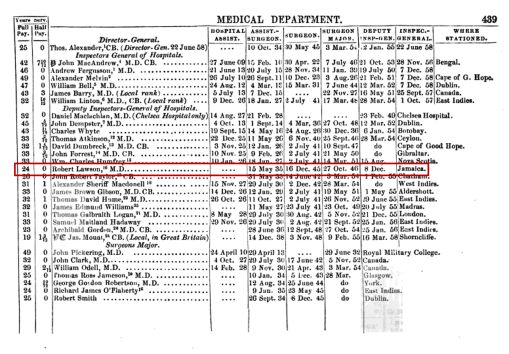
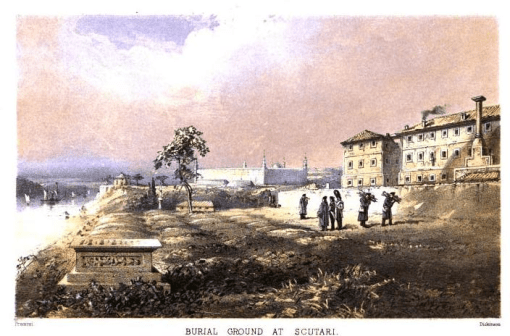
Robert Lawson (1815-1894) spent his life working in the military. He began his career at the age of 20 when he was appointed Assistant Surgeon and served in the West Indies, the West Coast of Africa, Cape Colony, and the Scutari Hospital operating during the Crimean War. During these years his position was advanced to Surgeon and then Surgeon Major, before being advanced to the highly respected position of Deputy Inspector-General in 1854. Lawson continued to serve in this position until 1867 when he was appointed Inspector General of Hospitals in 1867, just five years before his retirement in 1872.
Lawson’s interest in epidemic disease patterns probably began with the cholera epidemic of 1829/1830. He was then about 15 years of age, a year or two immediately prior to having his fate decided for him in terms of professions. Lawson’s childhood upbringing would have involved traditional classes in the foreign languages, religion, politics and law, history, mathematics, and the various natural sciences, with math, engineering and the sciences merged into a single discipline called natural philosophy. His schooling during his teen age years followed by medical training as a young adult would have exposed him to the nuances of he needed to know about anatomy, physiology, chemistry, climate and the earth’s natural settings, and how these all related to diseases and their treatment.
Quote from page 12, Scutari and Its Hospitals, by Lord Sidney Godolphin Osborne, 1855
Lawson became a surgeon with his training, sometime in the early 1830s, probably due to a combined apprenticeship and lectures program common for the time. His training commenced before, during or soon after the Asiatic cholera epidemic first made its way to western Europe in 1829. His focus would ultimately be on the physical sciences since these were needed formed the heart of knowledge he relied upon as a surgeon. The notion of animalcule disease (the precursor to bacterial theory) was just beginning to take form. Also commonly cited at the time were theories about the relationship of “germs,” “viruses,” and “fungi” to diseases, with the knowledge about the differences between them insufficient to matter much. Lawson also learned that disease could be a product of your personal constitution, your family’s heritage, where you were born and raised, how nature impacted your during your lifespan and how well you adapted to these changes. There was an early ecological form of disease philosophy that developed during this time, a result of Erasmus Darwin’s teachings just a decade or two prior. Lawson would become quite familiar with this ideology and like others use it to explain those places where diseases tended to recur and how we become adapted to them or not and to the surrounding environment. Many illnesses we suffered, therefore, would have been considered the result of failure to adapt as the means to recovery, making us a victim of natural events.
.
Link to Source
.
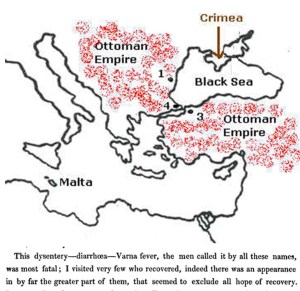
Crimea Peninsula
When Lawson began his work as an Assistant Surgeon in 1835, all of this education went with him and followed him through his years of services up to the period of the Crimean War, which commenced in 1854. It was at the Crimean War that Lawson and numerous other physicians would be tested for their knowledge, ability to adapt to major stresses, and ability to develop new treatment methods for engaging in better use of their skill sets. In the end, Lawson and most other surgeons and physicians at the war lost out to nature and the limitations as surgeons when it came to dealing with infectious disease patterns. Nature got the best of many soldiers, thousands of whom had to be buried due to common problems like excessive blood loss, deep lung penetrations due to the sword, post-traumatic gangrene, post-surgical infection, crushed appendages, penetrating head injuries, lengthy spells of diarrhea, dehydration, and long term malnutrition. Most of these came as a result of unhealthy living quarters, vermin, and what many probably speculated to be some form of disease causing contagion passed on from one cot-bound patient to the next.
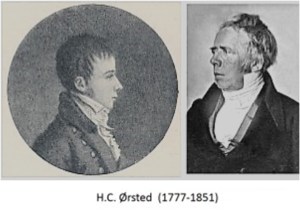
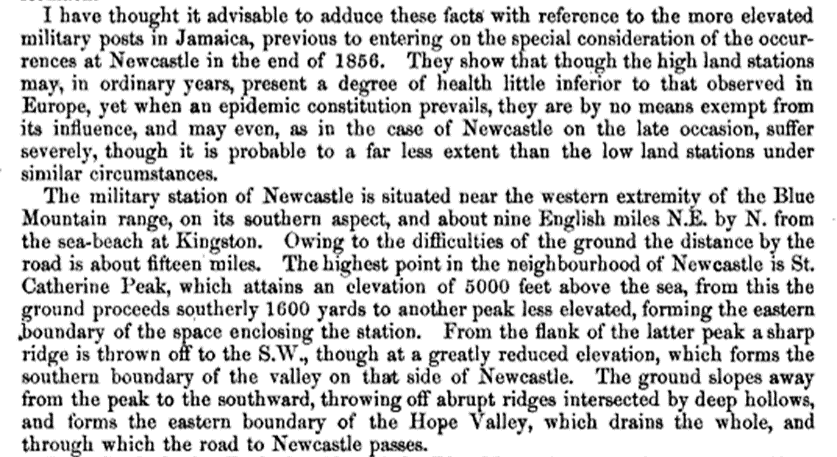
The Crimean War taught many of its medical staff the problems that poor planning and lack on adequate sanitation measures can have. All of this was changed once Lawson removed to Jamaica around 1856/7 and began to serve as Inspectors-General, Lawson for the hospital established in Newcastle, a small hilltop retreat and military setting located just northeast of the town of Kingston, Jamaica. The study of diseases and disease patterns became more complex as physicians and surgeons added the role of the earth on disease and man to their study. Up until this point, doctors had to contend with the issues of man versus nature (environmental cause) and man versus himself (sanitation and constitution). Gravity was in control of everything that consisted of physical matter–a Newtonian concept. With the introduction of “magneto-electric” forces based theory (versus electro-magnetism) to this paradigm, our natural history knowledge took on a new dimension as Faraday’s principle led people like Lawson to speculate about (latch onto) the theory that the very physical (Newtonian) man had to interact with this Oerstedian omnipresent electrophysical force that existed in the universe. (Named for Hans Christian Ørsted, 1777-1851, Copenhagen, the discoverer of this terramagnetoelectrics effect; see wiki on this.)
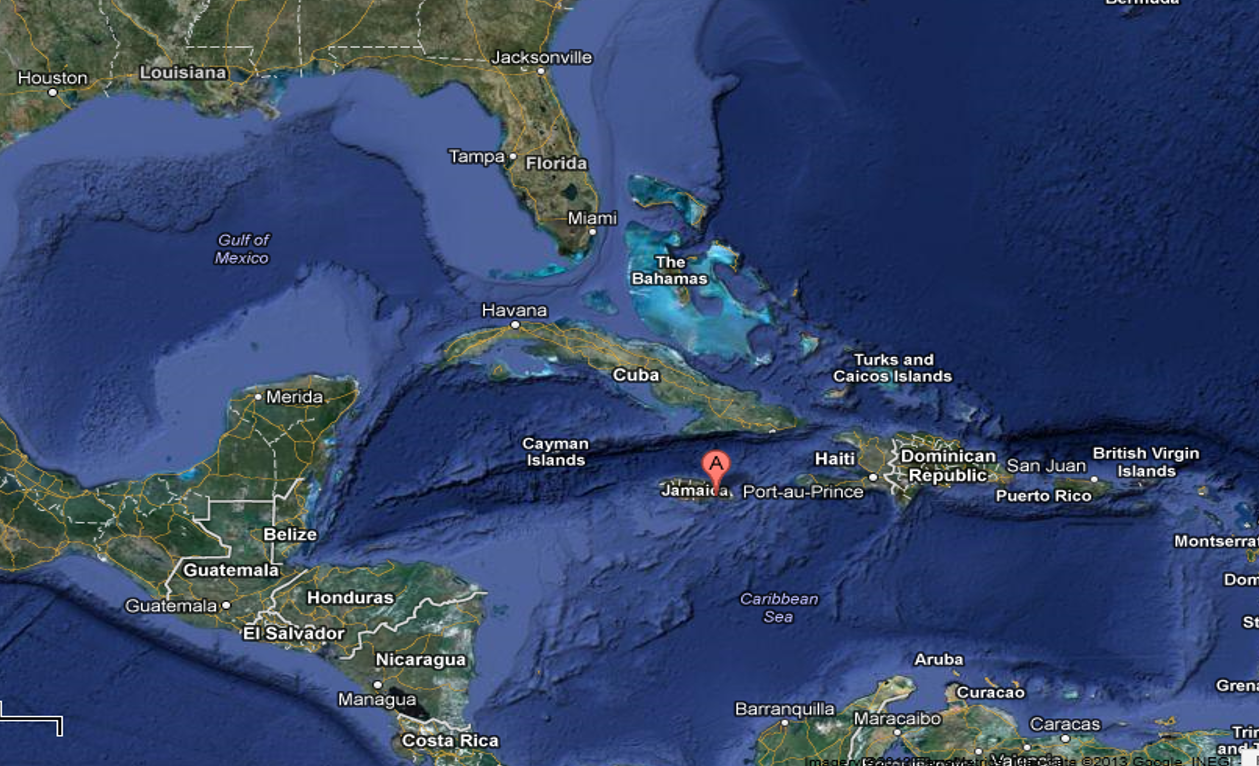
One of the more unusual things about Jamaica around this time was its unique role in the study of the earth’s magnetic behavior. It was where the earth’s magnetism remained constant, never fluctuating over time like it did elsewhere on the globe. This geographical feature of Newcastle led Lawson to engage in some fairly controversial studies of disease patterns. Whereas his work during the Crimean War in 1854 resulted in some “collision with the authorities” (as his obituary put it), his new findings in magneto-electrics while residing in Jamaica would cause even more controversy. [According to history, Lawson engaged in “questionable procedures” following a cholera outbreak, possibly bad hygienic upkeep and poor patient care at all levels–see the details of this in Scutari and Its Hospitals by Lord Sidney Godolphin Osborne, 1855, pp. 12-14; Lawson and most others employed at the hospital were severely chastised for crowded conditions and poor sanitation, a topic for review on another page.]
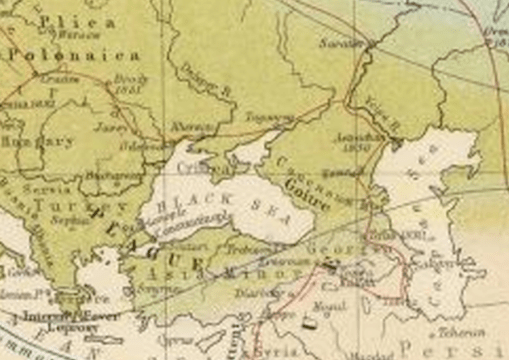
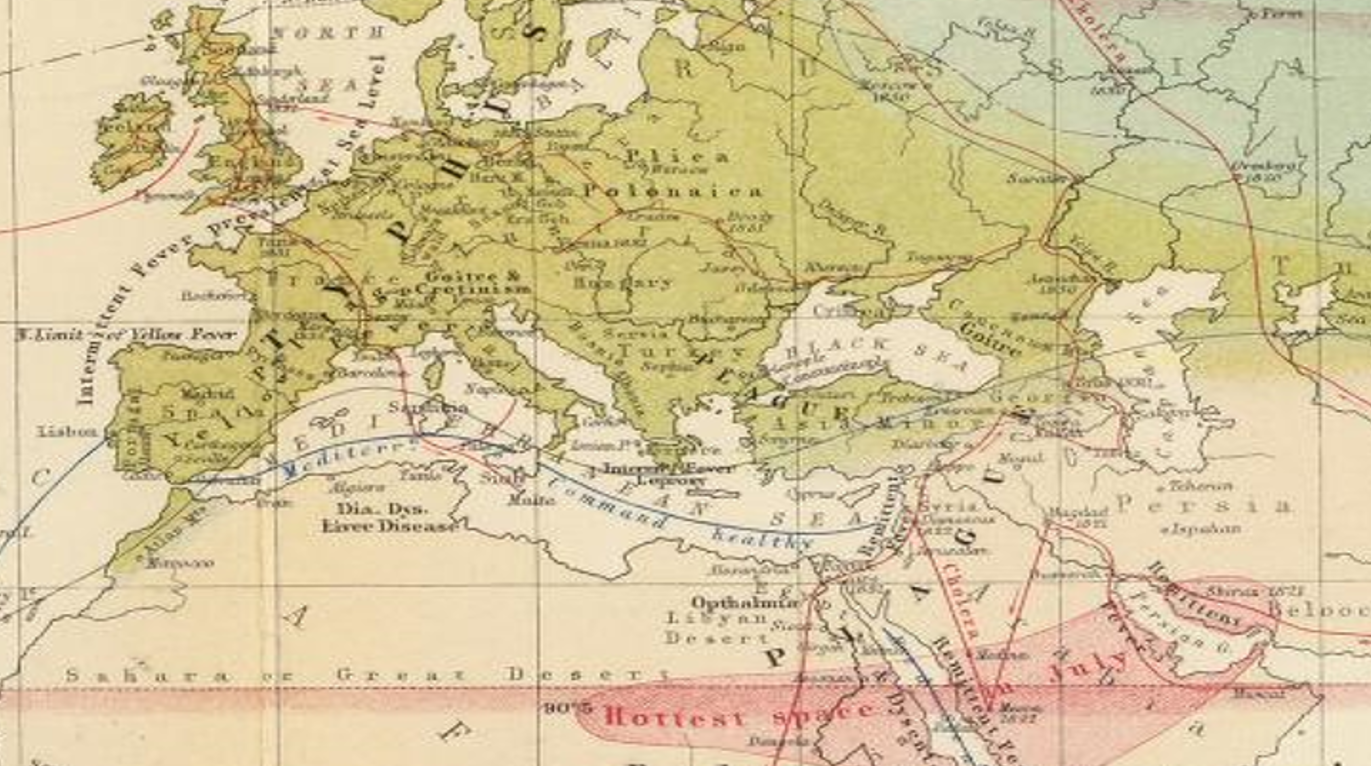
Following his removal to Jamaica, Lawson took on some new duties that were very different from those of Crimea due to the altitude of where he was at and the island community setting. If we take a close look at Alexander Keith Johnston’s map, published 2 years later, we find that the natural history and medical geography of Jamaica to be completely different from Crimea. According to the disease philosophy for the time, Jamaica is torrid in nature, whereas Crimea is in a temperate region, just north of the boundary of the tropical or torrid zone but well south of the arctic zone.
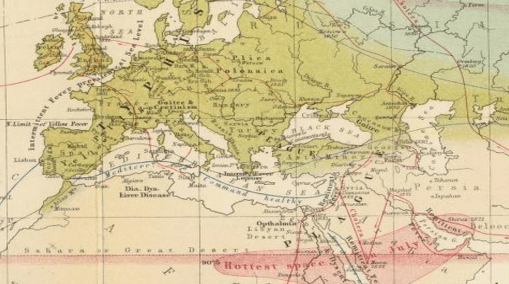
Article related to above map by Johnston
The major disease history of Crimea included Plica Polonica to the west over a fairly large area, plague to the south of the Black Sea, Goiter ridden regions east of Crimea (the peninsula along the northern edge of the Black Sea), and Fevers and Leprosy well to the south. The topography tells us that this place is bordered by water on three sides, has a tendency to have to deal with wind patterns, especially those coming upward or laterally from the sea itself. Inland routes of migration for disease have few routes to take, with that from the west bearing plica polonica and that from the east fairly disease free. Given the right conditions, the Crimean Peninsula was perhaps considered a fairly health place to live, with opportunities for sanative effects on valetudinarians in need of management of their chronic conditions. Rheumatism, gout, and tuberculosis are more likely to develop into problems at this latitude due to its perilacustrian setting. The reasons for illness during the war had to be related to the humidity, wind patterns, constitution of the people residing there. For British soldiers, this could mean the local climate was too much for their temperament to withstand and their bodies to handle for much time. Lawson’s observations of the soldiers in this setting, be they Turks or allies, showed these people became victims of the war first, the hospital second. No matter what the injury, penetration wound, crushed joints and bones, or lost appendages, the conditions following their surgery in order to assist with their recovery were responsible for some of the worst deaths due to infections setting in than any war previously had to suffer. This was due to population density, crowded in-hospital bedding settings, damp moist floors, mildew on the clothing and linens, and rotted wooden floor boards. Add to this the unsanitary nature of the battlefield due to its decaying horse carcasses and we have the initial requirements for an area where patients would ultimately have to suffer from diarrhea, dysentery (opportunistic, not amoebic, i.e. see my thesis) and in the worst, cholera (not Asiatic cholera).
.
Jamaica
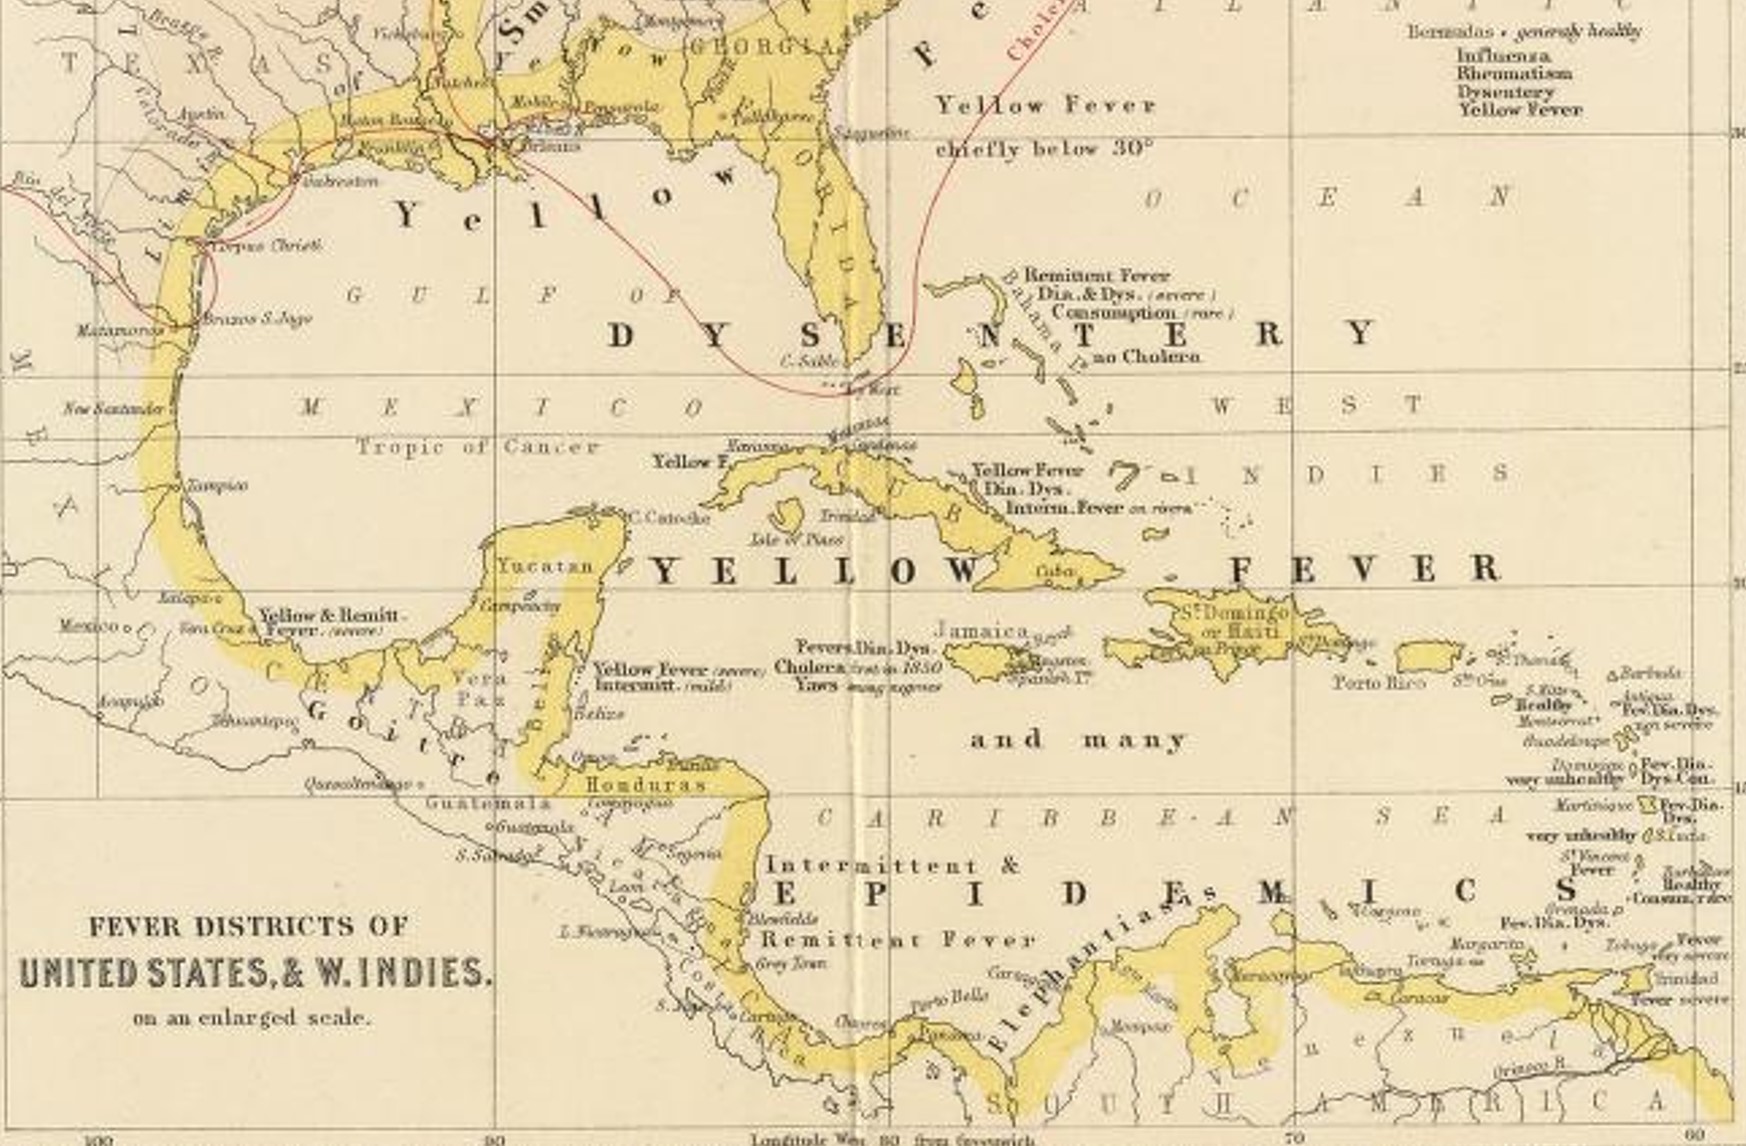
The setting and climate of Lawson’s new place in Jamaica was different from that of Crimea. It was still conducive to diseases linked to high humidity, rapid decay or decomposition the various sources for effluvium and “miasm”, and the results of war were no longer a concern for him in this region for the time being. Whereas his service in the Crimean War involved primarily the need for much surgery and chloroform due to the injured, and diarrhea stricken soldiers and prisoners, in Jamaica, the primary diseases he had to endure were the various fevers that struck this region.
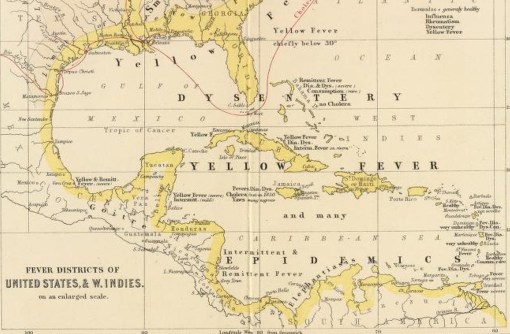
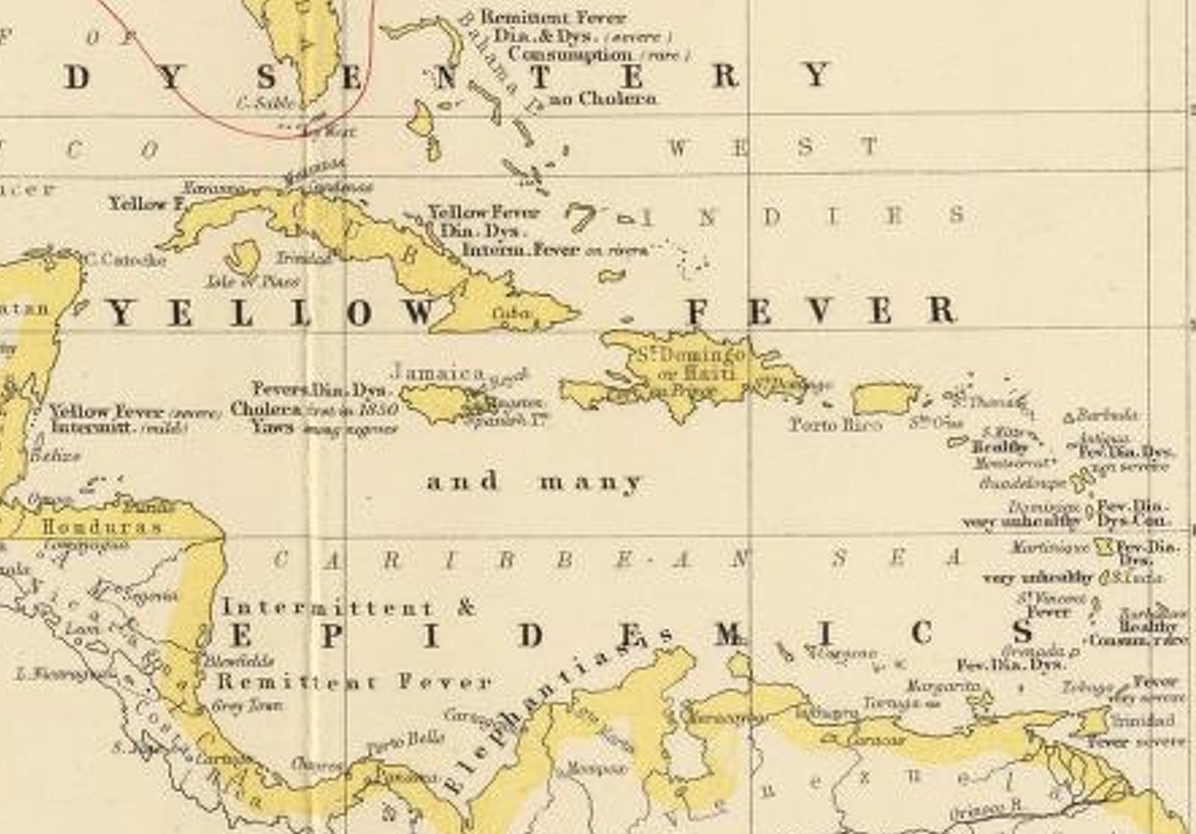
Note on these maps the following: the fevers, diarrhea and dysentery are common, and consumption is “rare”. This related to the belief that residency here was very health for severe chronic, degenerative diseases like consumption, a belief popular since the late 1790s. Also notice cholera failed to reach some of the islands around this time (1856). Some islands are termed “healthy”, others “very unhealthy”.

The various small island settings east of Porto Rico note Dia[rrhea], Dys[entery] and Fev[er]. Two are “Healthy.”
.
According to Johnston’s 1856 map of this setting, Lawson was again tending to patients with diarrhea and dysentery along with yellow and intermittent fever patients. The most deadly of these diseases was yellow fever, which the Jamaica region was the heart of due to its tropical climate. Goitre was still present. But there were also a significant number of unique diseases for this region, mostly due to its black community (today we know this disease was primarily of Slave trade origins). Yaws was the primary example of a disease brought to Jamaica from Africa. Elephantiasis was prevalent on the mainland close to the isthmus.
Cholera also struck Jamaica, but not in 1832; the first year it went pandemic on the island appears to be 1850. According to the story of how it Asiatic cholera to Kingston, Jamaica (published in Lancet(?)), cholera demonstrated to physicians that it favored regions stricken by poverty, poor nutrition, and unhealthy, crowded living spaces. This population based interpretation reduced the blame being placed upon nature for many of the epidemics. In 1840, when yellow fever came to Jamaica and struck the military setting in Newcastle, the General in Newcastle deduced that high elevations reduced the risk of this disease and so moved his troops there–thus the establishment of this facility. By the time Lawson had arrived in this region, 15 to 16 years later, the new theories for disease behavior were both conflicting and supporting these observations made by the General, and supported by the then recently published findings of the same by William Farr for cholera deaths. Farr claimed that high elevations reduced the risk of cholera deaths in heavily populated settings. But physicians also observed that proximity to seaports or city centers was a requirement for yellow fever, but not cholera.
The only observations countering this ideology were those which linked disease to the ports where ships lie in ocean bay waters. In Jamaica, on at least one occasion, the yellow fever extended too far inland to be obeyant of this rule then firmly established. Yellow fever struck in high elevation regions (in fact people already afflicted with cholera by mosquitoes in the portside probably migrated into this high elevation setting and then died). But Lawson’s pursuit for knowledge of the cause of these deaths naturally led him to make use of any new experiences he encountered in Jamaica. One such experience, with its background related to the Crimean War still recent, ultimately led him to become a major supporter of the sanitation movement. The other very important experience Lawson had once he removed to Jamaica was its unique magnetic history.

Jamaica–the theoretical zero point for the earths ever-changing magnetic field
Both became the motivating factors for Lawson’s development of the magnetic isocline theory for diseases like cholera and fever once he resided in Jamaica. He worked and lived in Crimea from 1855-1856, the last of the peak years of the 1848 to 1856 world cholera epidemic. His removal to Jamaica in late 1856 happened right after the epidemic ended. His theme for the cause of the more fatal malignant cholera had yet to be fully developed. The prime question for the time was what events transpired to convert a common. not so fatal disease like “cholera morbus” into the deadly “malignant cholera”. Lawson next directed his attention for answering this question to the magnetic field behaviors in an around Jamaica. Fluctuations in these fields occurred every few years. After rigorous review of the dates and events that transpired during his first months there, in very short time he came to the conclusion that cholera in general had an underlying two-year cycle related to its malignancy.
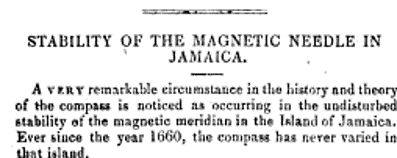
Evidence for the events leading up to this supposition are summarized in a description of the discovery of compass variation for Jamaica as early as a century prior. This was reported in an 1850 book entitled A descriptive atlas of astronomy and of physical and political geography (London, 1850, p 90) by Thomas Milner and August Heinrich Petermann:
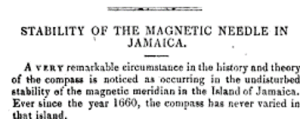
[T]here are places [such] as Spitzbergen, Jamaica and the neighbouring islands where no change in the variation [of the compass over time] has been perceptible. The whole mass of West India property says Sir John Herschel has been saved from the bottomless pit of endless litigation by the invariability of the magnetic declination in Jamaica and the surrounding archipelago during the whole of the last century all surveys of property there having been conducted solely by the compass.
Since 1660, it was known that the compass may vary its readings taken in the same place over time. This behavior of the earth’s magnetism was well known due to how it influenced the surveying of land claims, and began to appear in the common press between 1800 to 1825 when it was added to the natural philosophy books being use to teach children. For example, in The Critical Review: Or, Annals of Literature edited by Tobias George Smollett, (Volume 10 (1807) p. 259), there is an article stating “since 1660 the compass has not varied at Jamaica; it is now what it was then and in Halley’s time, 6 ½ degrees east.” Twenty-five years later, the same knowledge is bequeathed to the readers of The Guide to Knowledge (Volume 1, 1833, p. 453), edited by William Pinnock.
It is also made reference to an article penned by William Robertson and critiqued in The British Clinic, volume 30 entitled “Observations on the Permanency of Variations at Jamaica” (pp. 622-3, in turn this is from Phil. Trans. 1806). But is best summarized by the following taken from a book review published about a textbook published for schooling, with a female author:
The American Quarterly Review, Volume 32, 1834, pp. 429-457, see p. 453.
Ultimately, Lawson would use Faraday’s findings to prove his theory for the epidemics. But Faraday’s Law as it related to disease patterns also had an underlying philosophy already in place to help make this philosophy sensible, not just speculative and imaginative, as if Lawson were developing a new offshoot of a popular natural science. A decade and a half prior, many claimed this is exactly what epidemic speculators like John Lea did (so claimed by a writer for the AMA in 1853), a reminder of the Abraham Gottlob Werner school, German physicians focused on the geology of nature, and who according to some doctors and scientists, could explain disease patterns using this philosophy.
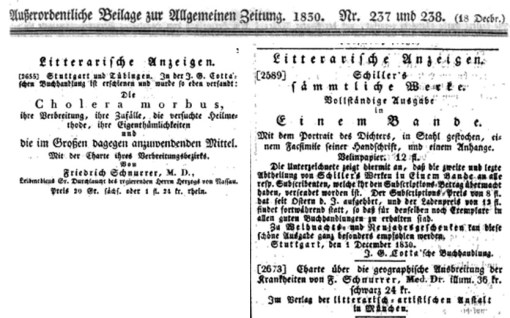
Announcement of Friedrich Schnurrer‘s maps of world diseases, and Asiatic cholera, pages 648 and 855, from Johann Friedrich von Cotta‘s Allgemeine Zeitung München, 1830. Description of this new periodical with mention of the map.
Schnurrer
From about 1797/1800 on, the concept of disease was significantly changed from any leftover 18th century traditions. Solidism (William Cullenism) was produced as an attempt to counter and then substitute for the fluids or age-old humoural theory. The notion of alkalinity and disease took routes in two directions. One led medical philosophers along the route to believing chemicals and poisons defined certain disease patterns, a philosophy very common to medical journals beginning around 1805. Merging this philosophy with a more global one was attempted by a German scientist and writer Friedrich Schnurrer (1784-1833). His compositions ultimately led to the rise in popularity for the landschaft theory of nature, the belief that the world as a whole is more than just the sum of its parts.
Schnurrer (some pages on whom are still under construction) developed this philosophy due to his dissertation on metals and the earth in 1805, his study of what he called “oxydatarum”. It was a progressive word for the time, and was rarely used elsewhere, and was highly suggestive of links being drawn between our understanding of the earth and its atmosphere, climate, and weather, and the role of oxygen in life and vital energy. In part of his title, there is an inference made to important health-linked events in the body that relate to the external environment (rerumque externarum indole=events concerning/affairs regarding external/foreign character).
Schnurrer’s next two publications were on geographic nosology, or the classification of regions and their relation to epidemic and endemic patterns that prevailed. In each he detailed both the macrocosmic view of the earth and its natural phenomena, its macrocosmos according to earlier Christian metaphysician and natural philosopher Jakob Boehme), and microcosmic view or minutia of nature that scientists were now focused on trying to explain all of the complex natural events. Ten years later, Schnurrer’s work went into the nature of specific diseases in the world and their behaviors.
The following is a chronology of the publications Schnurrer produced:
- 1810. Materialien zu einer allgemeinen Naturlehre bei Epidemieen und Contagien. [Material on the general theory of nature in epidemics and contagions.]
- 1813. Geographische Nosologie, oder die lehre von den Veranderungen der Krankheiten in den verschiedenen Gehenden der Erde, in Verbindung mit physischer geographie und naturgeschichte des Menschen. [Geographic nosology, or the doctrine of the changes of the disease in the various foregoing the earth, in conjunction with physical geography and natural history of man.]
- 1823-4. Chronik der Seuchen, in Verbindung mit den gleichzeitigen Vorgangen in der physischen Welt und der Geschichte der Menschen. [Chronicle of the plague, in conjunction with the simultaneous events of physical world and human history.]
- 1828. Die geographische Verbreitung und Ursachen des Wechselfiebers. [The geographical distribution and causes of intermittent fever.]
- 1831. Charte uber die geographische Ausbreitung des Krankheiten; Charte der Verbreitung der Cholera morbus. [Map on the geographical spread of the diseases; Map on the spread of cholera morbus.]
- 1831. Die cholera morbus, ihre Verbreitung, ihre Zufalle, die verschiedenen Heilmethoden, ihre Eigenthumlichkeit und die im Grossen dagegen anzuwendende Mittel. [The cholera morbus, its distribution, its coincidences, the various methods of healing, its properties or sensitivity to different agents applied globally.]
- 1831. Allgemeine Krankheitslehre gregrundet auf die Erfahrung und auf die Fortschritte des neunzehnten Jahrhunderts, [General pathology, summarized by the experiences and progress of the nineteenth century.]
Other renderings of these metaphysical concepts were prevalent as well in what would become Germany (See also WorldCat for Schnurrer’s writings, and notes on Karl Friedrich Kielmeyer (1765-1844), WorldCat connection]. Some medical philosophers promoted the natural philosophy of landschaft, interpreting diseases as events related to the reaction of our body to the surrounding environment, an offshoot of the early adaptation-evolution theory promoted by Justus von Leibig, Erasmus Darwin (the infamous Charles Darwin’s grandfather), Louis Agassiz, Jean Baptiste-Lamarck, and others. Others were heading in a direction that focused on the notion that we make ourselves sick, the primary argument for which had mostly to do with sanitation practices, personal and social, and our constitution and temperament.
.
Gauss and Faraday
By the time Lawson began learning medicine and surgery, landschaft was a common part of most medical philosophies related places to health, but not yet a part of British medical geography philosophy. When Lawson learned medicine and surgery, the philosophy of electricity and medicine was once again in a state of revival. The ruling philosophy for terrestrial magnetism were the ideas published by Gauss, Goldschmidt and Weber, Michael Faraday, and in terms its purpose and meaning, Alexander von Humboldt.
..
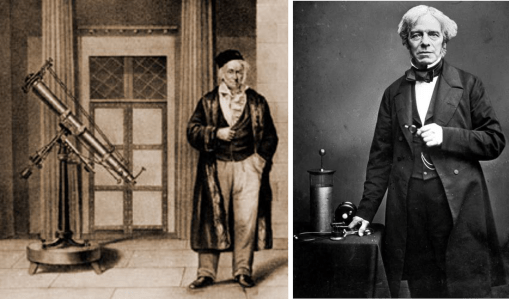
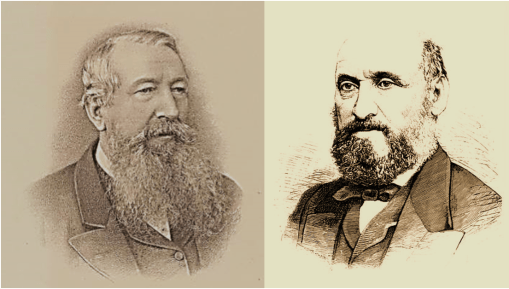
Karl Friedrich Gauss (1777-1855) and Michael Faraday (1791-1867)
.
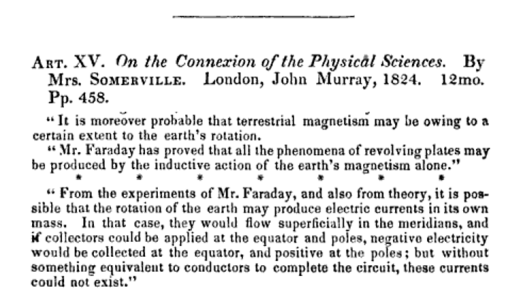
The works of Gauss and Faraday on the earth’s electricity and magnetism are what led Lawson to draw his conclusions about the disease patterns on this planet. In his Natural Philosophy booklet Faraday stated that a relationship between electricity and magnetism that he could produce in the laboratory also existed with the world, known as terrestrial magnetism. He explained it to be a result of the inner makings of the earth and its crust, and the impacts of metals in the earth on these magnetic fields, resulting from changes over time induced by an internal movement of the same (a precursor to the first of several versions of our continental shift theory). This the change in true north over time in our common compass readings.
.

Alexander von Humboldt
Humboldt
Relating such a philosophy to medicine and life partook a different line of reasoning. Such a behavior came as a direct result of Alexander von Humboldt’s writings around the turn of the century. Fascinated with the ability of nature to produce electricity in various ways, in particular that of the Electric Eel, he tried to relate this energy from a living being to the formation of lightning by clouds, auroras in the sky, or the creation of St. Elmo’s Fire along a ship’s mast. In the book he wrote on this topic, appropriately called Cosmos: A Survey of the General Physical History of the Universe (1845), Humboldt goes through the history of this philosophy extensively in his footnotes at the end of this book. With these notes he attempts to assign meaning to these studies going back to about 1780, when the nature of earth’s magnetism was first recognized and documented in writing. Humboldt also uses this reasoning to assign meaning to the same natural forces found in the biological world, linking the cosmos and earth to life in general and nature’s ability to give life or take it, a philosophy developed solely based on Schnurrer’s landschaft theory. Followers of landschaft considered disease to be a result our harmony with the universe’ so to speak (the very notion proposed as well by Franz Anton Mesmer in the 1760s). Any other attempts by science that failed to review the holism of nature, were in turn found to be compartmentalizing their knowledge of nature into specialties, a way of learning which was rapidly become very popular, and so harmonized with landschaft theory in Schurrer’s 1810 to 1815 works.

Evidence for this merging of knowledge by physicians and scientists to form a new science of healing first appeared very early as a result of China’s exploration in the 1680s, when it was related to acupuncture and moxi (see following grey-notes).
SIDE NOTE
For an excellent series of original writings on this, use the following links:
Such uses for medical electricity were countered by similar philosophies and practices with a long history of use in Chinese medicine. By 1810 it became well known that Egyptian, Chinese and Japanese physicians and others believed in acupuncture and moxi for revitalizing ailing parts of the body [see 1683 Philosophical Transactions, Joseph Acerbi’s 1798-9 Travels Narrative or summary of this study of Laplanders published in The Scots Magazine 1802, also the 1797 London Medical and Physical Journal-W. Coleys review, Oeuvres de Vicq-dAzyr 1805, Robert John Thornton’s A New Family Herbal (1810), William Woodville’s Medical Botany (1810), Clark Abel’s critique on this in Narrative of a Journey to the Interior of China (1818), an anonymous letter published in The Asiatic Journal, 1820, and William Wallace’s Lancet article on Moxa, 1827]. This philosophy became popular in London by 1820 due to Dr. James Morss Churchill, who wrote a treatise on this subject [search 1 on the same, search 2]. In France (one of Churchill’s first translators), a similar revival took place in the 1830s when electricity related versions of the moxi-acupuncture treatment were tested for the treatment of certain chronic diseases and pain, but especially gout and rheumatism. [see also Google Advanced book search on Acupuncture, 1820-1835).
.
Patterns
But the first important discovery or invention in this field in terms of Western European philosophy and discipline came with the invention of the Leyden Jar about the same time (the Dutch and others have laid claim to this; see my page on this). This is followed in the late 18th century by the popular static electric generator, with which a glass globe or disk was spun and a piece of leather or fabric laid against it resulting in the storage of a charge, released upon contact with the human body and so used to “revitalize” a paralyzed appendage for example in infantile paralysis (bacterial meningitis) or apoplexy (stroke) induced paralysis. The early 19th century also gave us the galvanic device, a liquid-based version of the battery which was used to produce and store enough of a charge to create the shock needed to bring a weak and ailing body, a limb, organ or part, back to life. Each was used to revive the life force or vital spark in an ailing patient. Some of their most successful uses involved bringing a drowning victim back to life, or eliminating the pain someone experienced due to with rheumatism or a need for dental care.
The other history relevant to Lawson’s work was that of Jamaica, its natural history, culture and the relationship between each of these and Faraday’s principal of terrestrial magnetism.
In an 1825/6 essay presented by French geologist Msr. H. T. de la Beche, “Remarks on the Geology of Jamaica” (Trans. Geol. Soc. London, v. 2, pt. 2, 1827, pp. 143-194), the earliest version of the continental drift theory are used to define Jamaica’s geological differences in terms of lacking any iron rich substrata, consisting in large part of just pieces in the form of sand and gravel alluvia formed by the diluvial and antediluvial structures. (Also, an 1812 history of this magnetic theory was published in History of the Royal Society by Thomas Thomson; according to one writer this was proof of the deluge or Noah’s flood–Literary Gazette, vol. 5, Nov. 3, 1821, p. 697-8; according to another writer, this made Jamaica a theoretically perfect place to harbor Africans during their move to slave plantations–Marly; or a Planter’s Life in Jamaica, 1828, p. 219; see also Sir Edward Sabine’s Work on terrestrial magnetism in the Atlantic, and the decision to monitor this in relation to weather, etc. by the Royal Society Committee of Physics, 1840 Report).
These observations about Jamaica only strengthened some of the opinions individuals had about Jamaica’s unique compass history. As investigators continued to study the earth’s air and water flows and its magneto-electric flux, they came up with a number of very helpful conclusions about how objects planted on the earth’s surface behave. In terms of the many events we witness, this pertained to the nature of the earth, water and air patterns–its meteorology and climate–but it also pertained to the behaviors of people, animals, plants and other living things on the planet. For some objects on the earth, like the causes for disease, it even related to such things as germs, viruses, fungi, animalcules, worms, copepods, shellfish and crustacea.
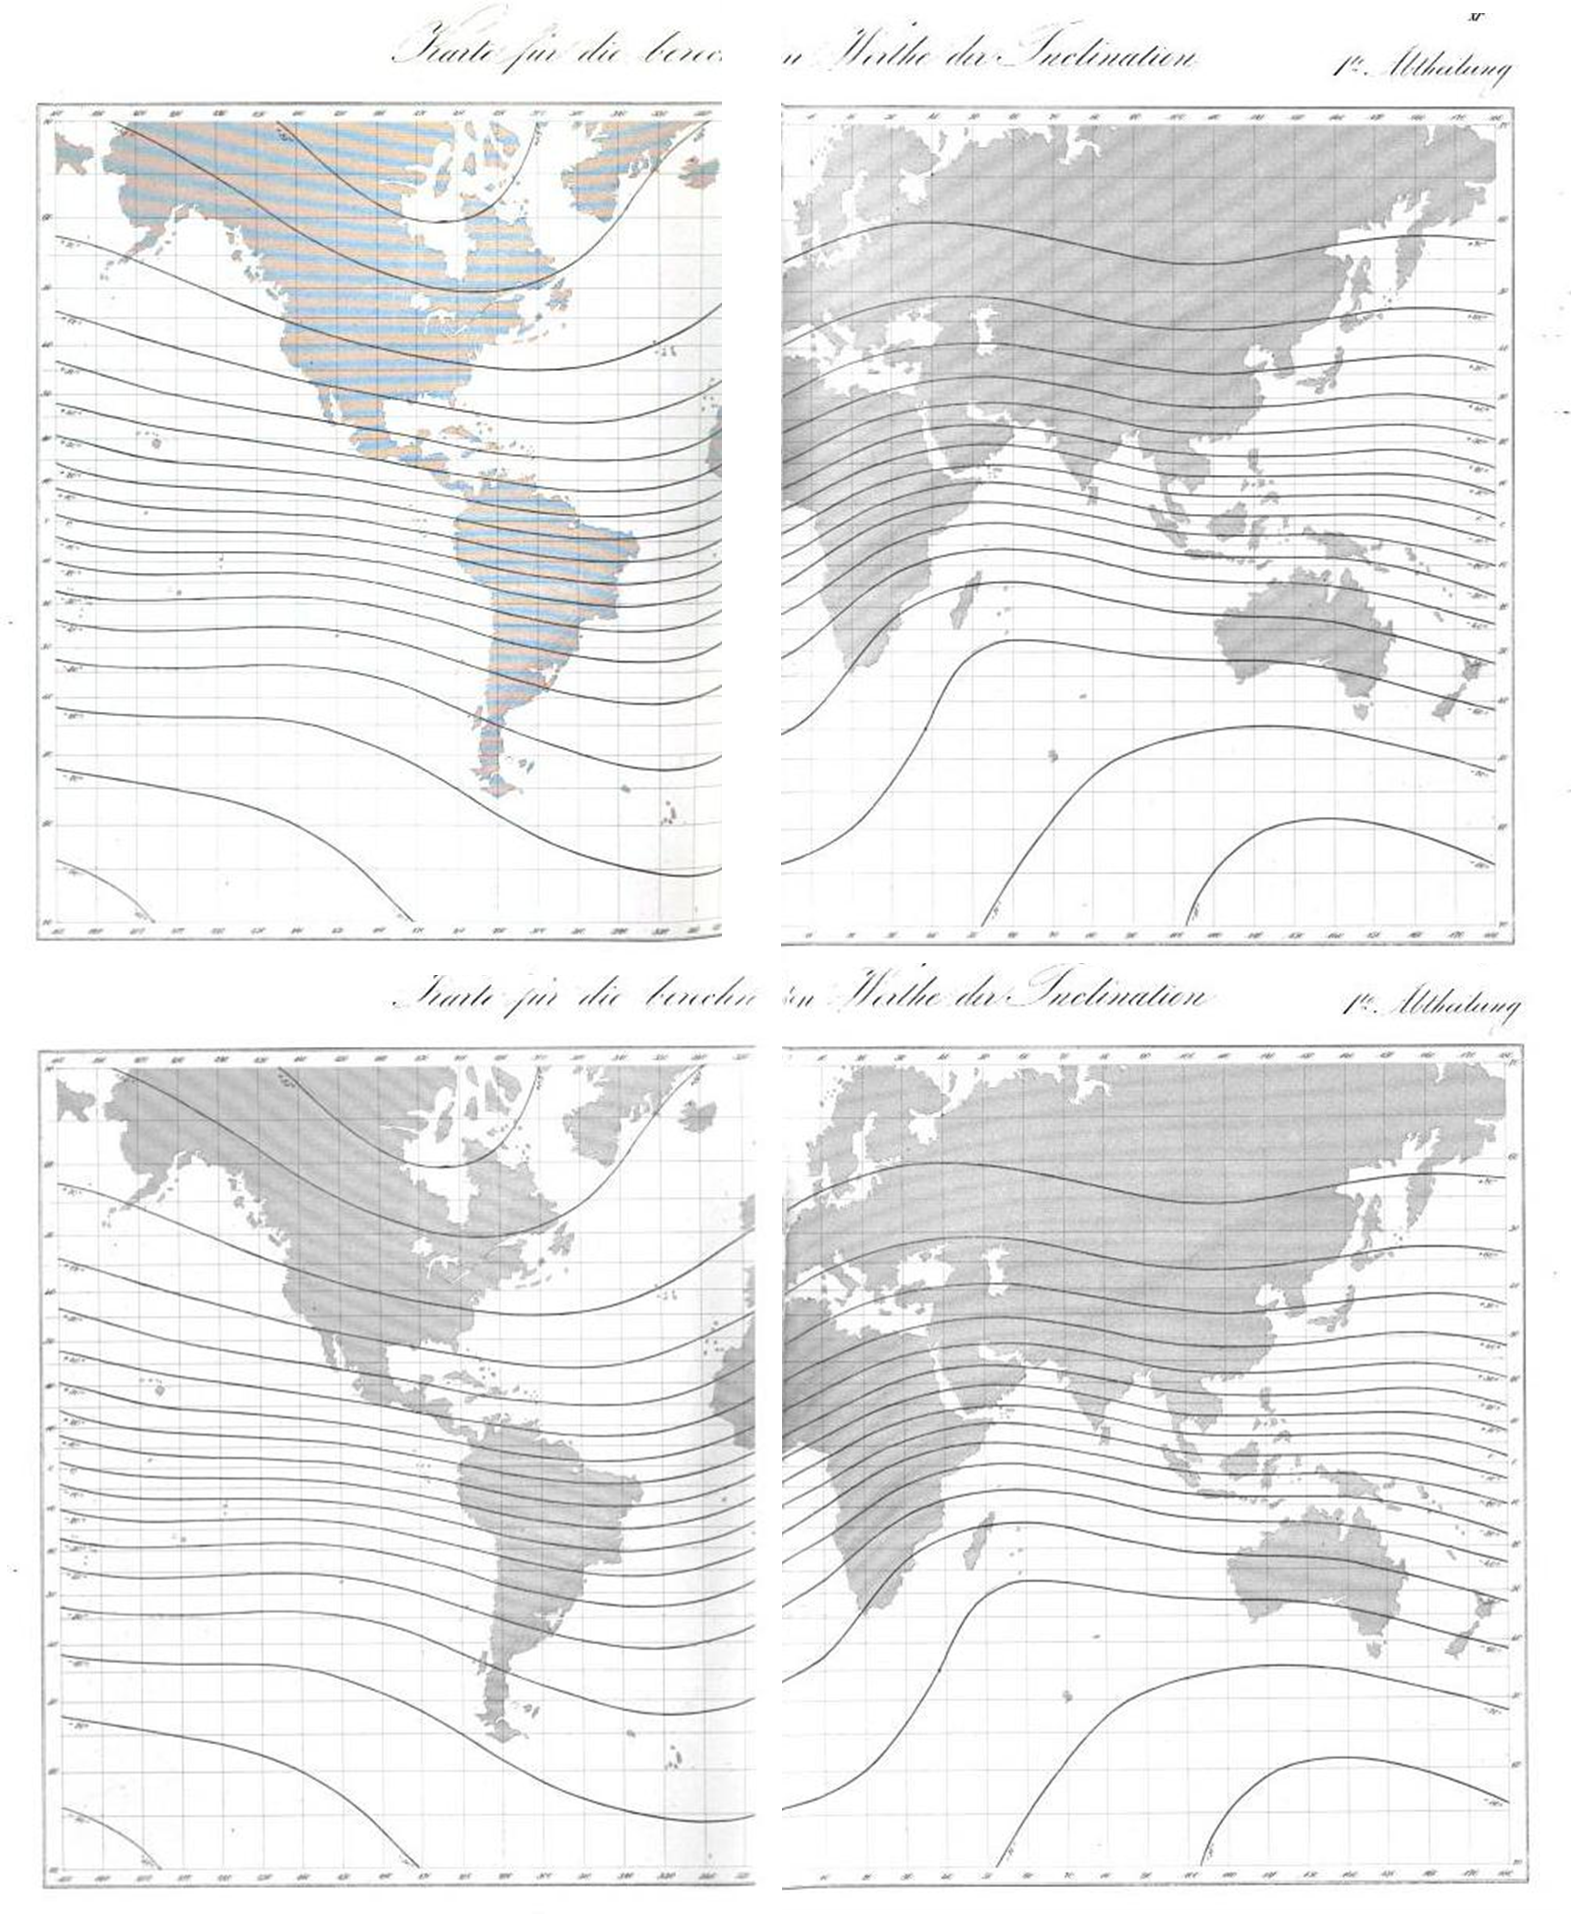
In 1840, Carl Wolfgang Benjamin Goldschmidt, Wilhelm Eduard Weber, Carl Friedrich Gauss produced Atlas Des Erdmagnetismus: Nach Den Elementen Der Theorie Entworfen. It included the following maps (which by the way are nearly identical to Lawson’s map).
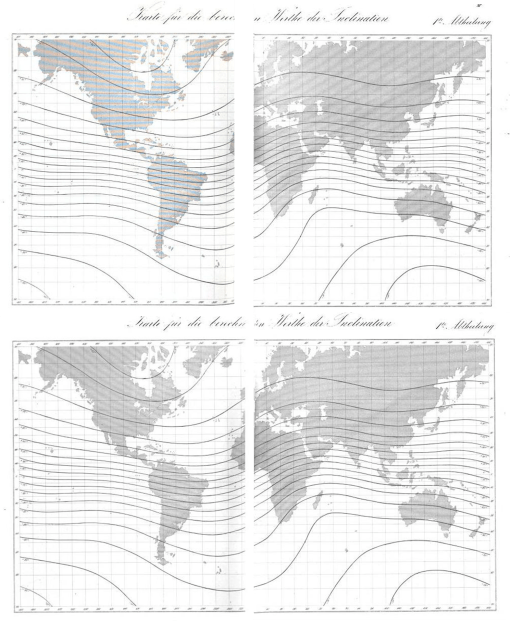
.
A number of natural phenomena were now being linked to this very different interpretation of the earth and surrounding environments or media. The atmosphere had its own domain of energy to learn about as did the earth’s solid masses, as well as the masses of other objects in space. These unique discoveries were used to explain events previous inexplicable such as the influence of solar flares, the behavior of meteor events, the behavior of auroras. Cyclicity often played a role in these descriptions, almost as much as the frequent changes observed in natural cycles and patterns.
.

An 1850 illustration of the Aurora, from Milner and Petermann’s Descriptive Atlas
.
Canstatt
By the time Lawson was a surgeon in the late 1830s, he was familiar with these teachings of natural science, medical topography and climatology, and the other philosophies dominating the professions of science, engineering and medicine by the time he began his practice. Slowly but surely the miasma theory once prevalent to to the field was being considerably modified. A philosophy had developed that incorporated numerous other observations of the natural sciences into how the causes for illness can be defined. These explanation included such things as natural events related rain, heat, dew, seasonal cold, dampness, and “ice meteor” events (sleet and hail), along with the formation of mist, swamp gases, effervescing minerals from springs and anything that could be related to the alkaline chemistry of the soil or substrata. An especially new set of theories came about relating these natural meteorological phenomena to the earth itself, its theoretical mass or form that he referred to as telluric material. Such a model was already well defined and developed into a unique landschaft nosology, again developed by German scientist, this time Carl Friedrich Canstatt.
.

Dr. Carl Friedrich Canstatt
One of the most influential German writings of the mid-19th century was Dr. Carl Friedrich Canstatt, and yet surprisingly we never learn about him and the important classification system he developed for diseases in relation to medical geography. Most of his concepts were derived from the much earlier idio-miasm/koino-miasm theory published as part of a book at the turn of the century by a British writer, with the climate theory description added by a United States author [REFERENCE]. Canstatt subdivided this basic view of diseases into smaller categories by relating this philosophy to the new observations published for how diseases behaved with people in relation to specific classes of natural history features and events.
.
Orders
- Exanthematous, specific disease processes: Variola, Variolis, Varicella (measles, small pox)
- Malaria (disease processes by specific telluric atmospheric miasma generated): Intermittent fever, Yellow fever, Cholera, Pest, Dysentery.
- Typhus (disease processes from specific animal-generated miasma): Spotted Fever, Typhus): Ileotyphus (Enteric Fever), Dysentery.
- Atmospheric (disease processes created by atmospheric agents that become miasma):
A. Colds:
a. Rheumatoid,
b. Catarrh, Influenza, Whooping Cough.
B. Heat Illnesses: Cholosen
5. Poison animal diseases (disease processes, generated by specific disease poisons of animals): Glanders, Anthrax, Hydrophobia, Vaccinia, Mange (foot-and-mouth disease).
6. Chronic Diseases . . . (Chronic diseases, generated by specific contagions or distinct endemic causes): Syphilis, Lepra, Trichoma or plica polonica.
. . .
Remaining conditions with peculiar, unchangeable causes resulting in major conditions:
a) Toxicosis (from poisons from the inorganic and organic kingdoms produced diseases)
b) Trauma (diseases generated by or from external injury)
c) Evolutionskrankheiten (Evolution diseases) (diseases that generated by certain developing states of the organism or modified growth, etc. by dentition, menstruation, childbirth) (bone formation error)
.
.
Local and Distant “Miasms”
According to 1800 miasma philosophy, miasmas are either naturally produced (koino-miasma) or human/animal-produced (idio-miasma). Which two of the above are idio-miasma?
According to Canstatt, 1847, by considering the process of pathogenesis and the onset of a disease induced by the above, which of these theoretical causes are “telluric”? “malaria”? “typhus”? “atmospheric”? “poisonous”?
.
Canstatt successfully pulled most of the philosophies out there together into one nosology. The disease groups explained here pertained mostly to nature’s influences, not those that were exclusively produced by man such as those due to filth or poor sanitation. Still, the sanitation related misbehaviors of people could be closely related to those related to either Poisons, Chronic Disease or Toxicosis theories. Man was not to blame for telluric, atmospheric and most animal-based miasmatic causes. Constitution remained a causative factor on its own, but notice how neatly it does fit in as well with Evolutionskrankheiten, even nature makes us responsible at times for these very personal, internally somatic ailments we may be forced to live with.
.

Lawson
Robert Lawson (1815-1894) was probably quite familiar with all the theories out there about disease just mentioned. He was well read in the philosophy about how and why epidemic disease patterns developed and how and why they migrated to various new locations. Like most others, he understood much of these teachings but could not use it to explain each and every epidemic pattern he would later lay witness to.
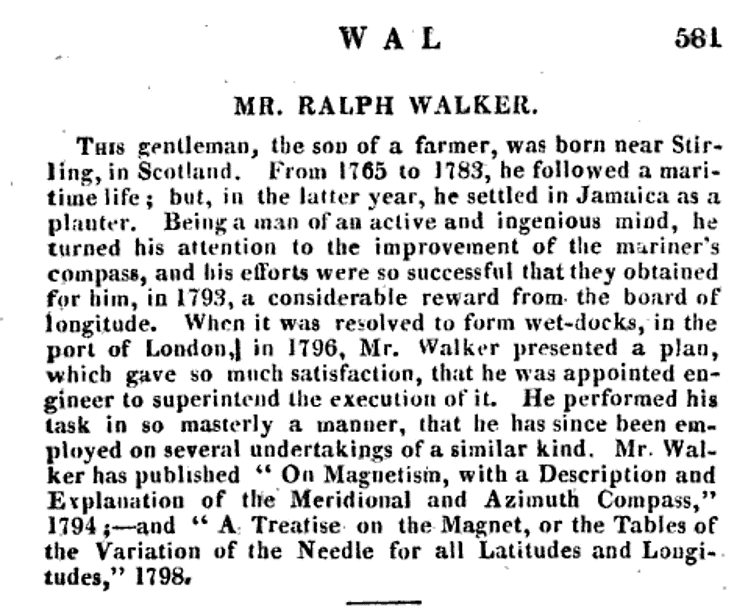
When he became Inspectors-General of the Hospital in Jamaica, his residency naturally exposed him to some new philosophies in the region (for a complete review of the writing on Electricity for the 18th C history see this bibliography). In particular there were a number of researchers focused on the unique magnetic traits of this region, two of whom, John Churchman (Author of The Magnetic Atlas, Or Variation Charts of the Whole Terraqueous Globe: Comprising a System of the Variation and Dip of the Needle, by Which, the Observations Being Truly Made, the Longitude May be Ascertained. 1794, 1804, Link to ref.) and Ralph Walker (link), published their theories on this behavior of the earth’s magnetism between 1794 and 1804. Their activities in the region and the subsequent publication of their work gave him further insights in the region, enough to develop his own theory on disease patterns with.
Lawson probably realized that by living in a place where the magnetism of the earth remained constant, he had the unique ability to study disease patterns temporally without need to compensate for changes in the earth’s magnetic fields over time. He thus developed a way to study fevers in relation to the earth’s form and shape where he lived, noting how these disease patterns behaved in relation to an unchanging surface with rising elevation over time, in relation to the local weather, winds and climate. One of the first theories he attacked with these results was that of the most famous William Farr, the founder and major promoter of the elevation theory of cholera behavior and the by now widely recognized zymotic theory.
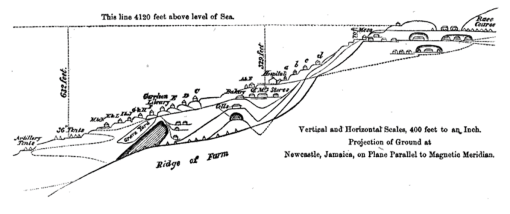
The following transect was produced by Lawson produced as a result of his studies to help delineate the different parts of his theory.
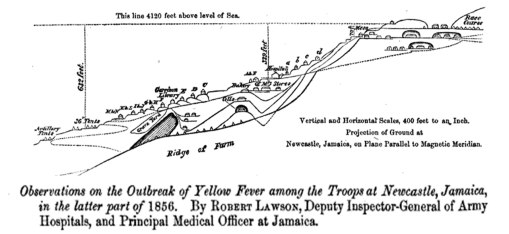
Source of Above
Helping Lawson along with his theory was the added abberance in local epidemic behaviors that resulted in it striking regions above the 4000 feet above sea level elevation. This was against the teachings William Farr posed 10 years earlier for cholera, and seemed remarkably different from the yellow fever patterns witnessed and documented in shipping communities. As a result, Lawson’s work made some readers ponder even more any remaining questions they had about his theory. (Historical epidemiologists might also recall the high elevation fever noted in Mexico, during the Spanish Exploration period, also suggested to be yellow fever.)
.
From p. 326 in Lawson’s article
At the time of Lawson’s research and service, this was the “center” of everything when it came to the accuracy of the compass. So along the remaining isoclines on the maps above (Lawson’s or Felkin’s), there is deviation from the norm or expectation with regard to disease patterns. At the global level, Lawson probably tried to imagine these areal differences with his theory in mind. That section of this isocline from just west of India, through the known ecological nidus of cholera, across to China and finally Japan, are places where the cholera not only prevailed, but also initiated its global spread patterns to new places where people resided.
.
As noted on Lawson’s transect, it is placed along an area with unchanging magnetic fields (“Newcastle, Jamaica, on Plane Parallel to Magnetic Meridian”). In Farr’s theory of cholera, Farr noted high elevation to prevent this disease from becoming epidemic in nature. Lawson’s map of the yellow fever behavior, a very different disease, failed to abide by Farr’s conclusion. Lawson’s map in fact even mentioned the increased likelihood for this disease at higher elevations, in areas well above the water edge and shipping ports. Each of these factors seemed to break the rules suggested by previous other disease patterns. This obviously made Lawson’s theory at times seem very speculative in the least, problematic for the profession at most.
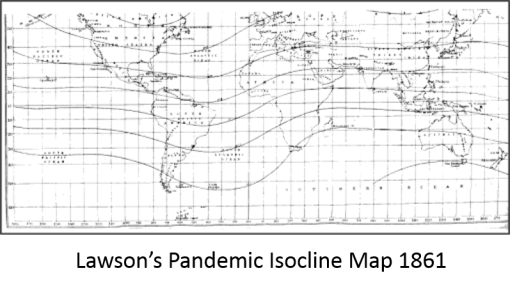
By 1860, Lawson was ready to share his results with the world, producing a world map defining the disease prone regions. He thus published the following:
.
.
Lawson developed a following for his theory, although by very few in number when it came to acknowledging this theory for disease by the other British writers for his time. One of these followers was Robert Felkin, whose maps depicting migrating epidemic disease patterns included a rendering of Lawson’s as his final figure (this writing is reviewed extensively on two other pages at this site’ i.e. the map itself, and for book content). Twenty years later, in 1888, Felkin was promoting Lawson’s 1861 theory. This occured right at the dawn of the bacterial theory for disease (Robert Koch, 1884).
The following map of his depicts Lawson’s isoclines and the prevailing wind patterns. The isoclines fail to follow the latitude lines, unlike the theoretical wind patterns, at least in theory.

Felkin’s map of the same.
Notice the “troughs” [ U ] and “ridges” [ ∩ ] formed by the isoclines; these relate to the degree of deviation, plus or minus, from the expected; they shift position laterally (longitudinally for the most part), cycling back and forth over time.
.
Competing with Lawson’s theory was the zymotic theory developing in medicine, which replaced the miasma theory and its allies rather slowly between 1850 and 1860. When the zymotic theory became popular, the preceding miasma theory lost its ground in terms of producing an effective disease categorization schematic or nosology. During the mid-1840s, between the two malignant cholera epidemics, a German physician had defined a unique nosology for disease that included the earth’s forces as a form of miasmatic cause–which he called telluric. Lawson’s philosophy was pretty much a continuation of this logic, even if he never heard or read about Canstatt’s new nosology.
.
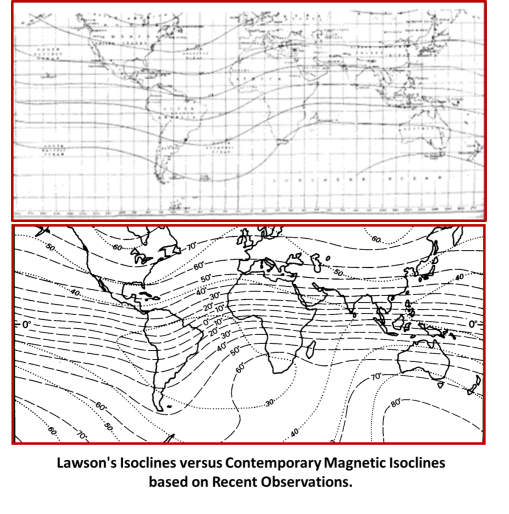
When we look at Lawson’s map adjacent to a more recent map of the magnetic isoclines for the earth, we cannot help but notice the similarities between the two.
.
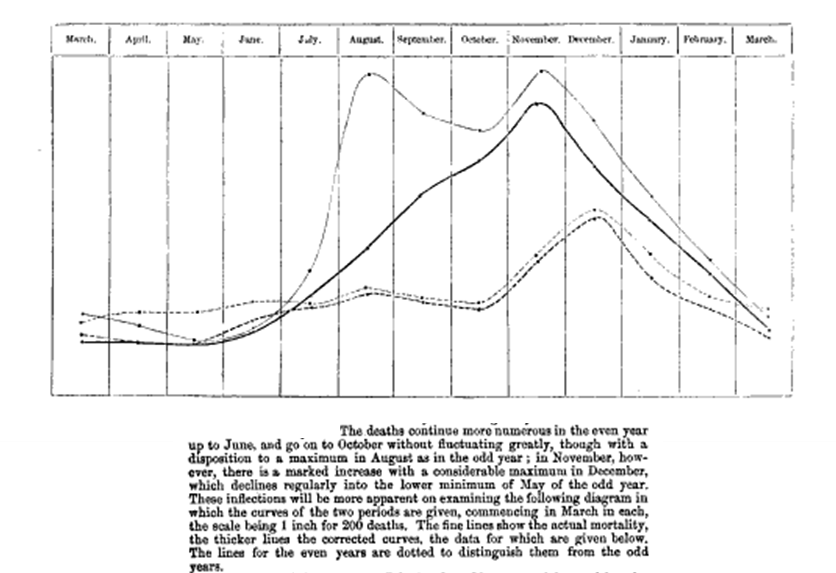
The final part of Lawson’s theory that resulted in its loss of credibility was his theory that the epidemic disease patterns influenced by these magnetic waves demonstrate a two year cycle. to some it seemed that the ancient philosophy of disease numerology so to speak had just become a part of the picture–one’s ability to predict natural events based on a basic math equation. The following graph attempts to illustrate his argument made for this hypothesis, published a few years later as part of an article defending the claims of his 1861 publication.
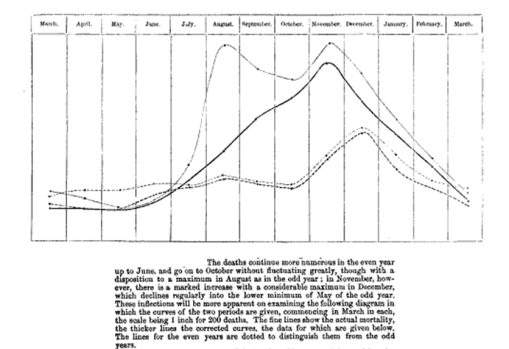
In the Statistical, Sanitary and Medical Reports, of the Accounts and Papers for Army Medical Department published in 1864, Lawson gave a stronger argument for his claims. In this review he drew the following conclusion:

.
Results and Lessons
Once arithmancy or numerology became a part of Lawson’s logic, his obsession the discovery took over. Predictability was now an important part of his argument. In such cases, the Occam’s Razor effect becomes inevitable.
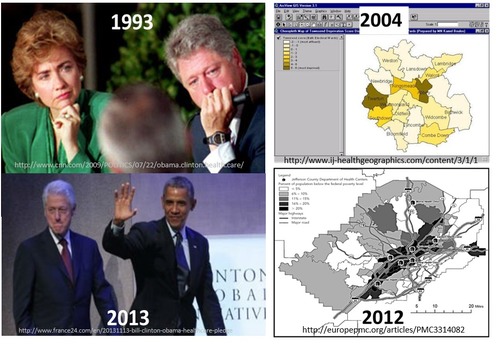
A similar error was made with numerics involving the yellow fever and numbers of years between cycles notice by practitioners in Philadelphia and New York’s Hudson Valley in 1793 and 1797. These epidemics became common topics of discussion due to Benjamin Rush’s involvement and the initial mistake he made in attempting to define its cause (rotting coffee beans and other stench-causing decay was one of his theories), versus the theories proposed by New York’s Samuel Mitchell (congressman, editor of The Medical Repository, and physician at the NY Regents medical school). During this same time, religious leaders were considering yellow fever to be a new “plague”, interpreting it as a sign of God’s vengeance (see my page on this). Believers in such a claim cited its three year pattern (the trinity) as a sign of this unique pattern. As result of the return of this epidemic as predicted, people left by Philadelphia by the tens of thousands in just a few days after it struck their city, noted in the following newspaper article from the Poughkeepsie Journal (photographed from the microfilm):

Poughkeepsie Journal article, Poughkeepsie, NY, following the eruption of yellow fever in Philadelphia
Religious leaders wondered if this vengeance was due to the rapid economic growth of the local economy, coupled with rapid urbanization and a subsequent increase in social inequality. (As one Hudson Valley writer once noted: the massive Greek Revival Homes on large farming property owned by the rich contrasted greatly with the numerous smaller cottages, shacks and cabins standing out there in the wilderness owned by the poor.) Still, one major benefit of all of this came several new inquiries into disease– leading to the establishment of quarantine procedures within shipping ports. These quarantines persisted, even though a cause for the disease could never be determined.
Beginning in 1853, evidence for this arithmancy or what I call trinophilia re-emerged with the return of the Asiatic cholera in New Orleans, during the years of 1853, 1854, and 1855, a three year fever period. This resulted in the “triennium” “or triune” theory for epidemics published in several medical journals [Louisiana State Med. Soc. Report on 1855 event; see also NEJM note, Barton’s Report of the Epidemic Fever in New Orleans, and Orr’s Statistical review of typhoid, EMSJ].
Both yellow fever and cholera now had the numbers theory to rely upon to predict their return.
Now it was Lawson’s turn to do the same for Jamaica just to the south. This time, the cycle Lawson decided upon was a two year pattern of natural events which he linked to epidemics spatially (based on his observations of latitude and longitude features). Lawson claimed that that terrestrial magnetism and its oscillations were to blame. Lawson argued this theory from 1861 to his retirement in 1872 at the age of 57. Following his retirement, he lived another 22 years, dying in 1894 at the age of 80. Midway through his retirement years, the following note was published in Quain’s Dictionary of Medicine.
People have always fascinated with the idea of making successful predictions. Even to this day we see these kinds of behaviors, with everything we do.
People also tend to behave a certain way whenever a new discovery is made and begins to develop a following. The “Garner’s hype curve” effect is often referred to when such events take place.
A similar series of events took place with a spatial geological theory for cancer posted elsewhere on this site–Alfred Haviland’s cartographic argument for cancer and its relation to relation to the chemistry of the substrata. Haviland’s idea was partially or perhaps even more correct than we might suspect–a review of Haviland’s map shows the high risk area very close to coal-mining territory, and since coal does have anthracenic polycyclics, which environmental chemists argue are very much carcinogenic esp. for breast cancer due to their steroid-like structures, Haviland could in fact be correct in his spatial analyses, incorrect due to ecological fallacy–a fallacy incurred due to the data of one set of results being related to another set or results as if the two are directly correlated or “ecologically” related.
As for Lawson’s work, Lawson received considerable but short-lasting support for his theory. This is eluded to in the following commentary on his work by R. E. Haughton in his article “On the Changes of Types of Diseases” published in the American Journal of Medical Sciences in 1866.
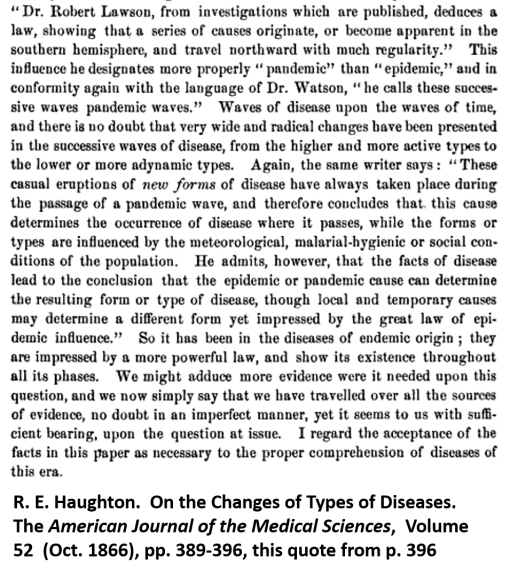
[Note: The above comments about Lawson resemble John Snow’s comments about John Lea published at about the same time; see my article recently published by International Journal of Epidemiology for more. To better understand Haughton’s term “malarial-hygienic”, see the above section — Canstatt’s Nosology of Disease, Order 2, Malaria.]
Very few writings refer to Lawson’s theory in the medical journals for this time.
By the mid-1880s, were it not for Robert Felkin’s work and mapping of foreign disease patterns (described above), Lawson’s pandemic isocline theory would have been pretty much obliterated from the bibliographies and references for any newly published medical books or articles. But so too was William Farr’s zymotic theory reduced in popularity by this time. This was due to none other than Koch’s work on the development of proof for the bacterial theory of disease.
.
After Words

Alfred Haviland
The maps reviewed recently and posted are:
.
In addition, for additional background material I posted/am posting pages on:
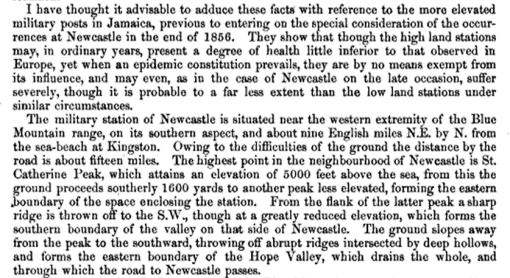
One of the most important parts of Lawson’s history in medicine is related to some major mistakes he and his comrades in surgery made in 1855/6 at the Crimean War, on the north shore of the Black Sea. Turkey and Russia fought a bitter battle for superiority in this part of the world, which resulted in many deaths. These deaths were not due to the war so much as they were due to the poor treatment soldiers received following their injuries in battle. Inadequate transportation to some of the grandest military hospitals ever established removed any fame these hospitals had for their size and glamour. Once they arrived at the facilities, thousands of soldiers ultimately died there due to poor sanitation. A lack of sufficient medicines, in particular opium became the most decisive aspect of this poor planning. Soldiers taken ill by diarrhea and ultimately severe diarrhea or dysentery, often referred to then as cholera morbus, lacked the opium needed to stay their bowels, and so resided in small quarantine facilities immersed in their own sweat, stench, vomit, pus, and excreta. This was the deciding factor for Lord Osborne following his expectation of the site leading him to write such a detailed narrative of his inspection of this site. No mention of Lawson is ever made in this review, but the expectations are that Lawson like most other doctors was also unable to handle to lack of adequate supplies needed by his surgical patients. He took some serious actions to stopping these problems in his cholera wards, but was heavily criticized for this according to some much later writers about his life, following his death.

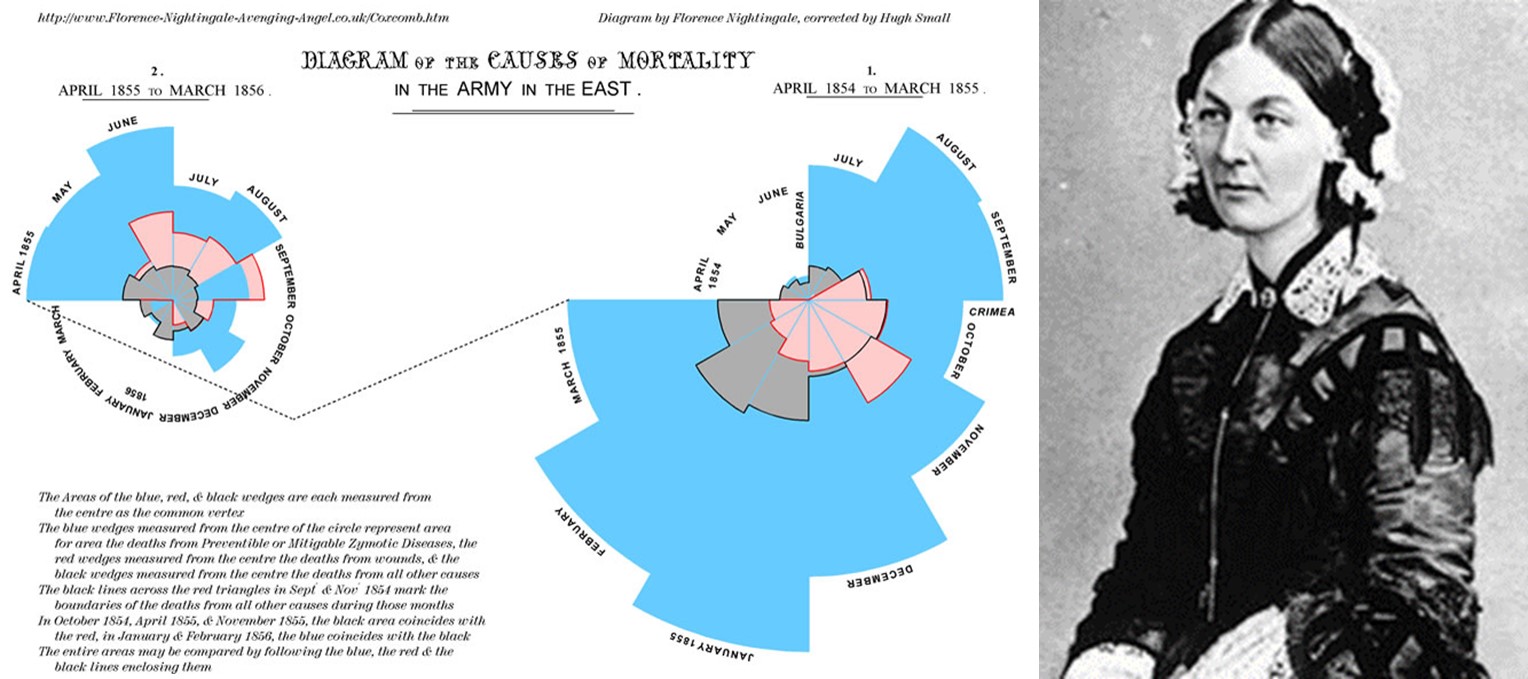
However, the one major positive outcome of all of this came due to the appointment of Florence Nightingale to serve as a director of the nursing program for this military setting quite early on [to be covered on another page]. Some of the recounts of her facilities at this place avoid much description of its grossness and crowded settings, and many paintings depicting the same setting also failed to demonstrate the atrociousness of the cholera wards. Nevertheless, she and her approximately 44 nurses worked effectively to deal with an institution they were responsible for that house 7000 patients, within a building that was built to manage 3000, and could only house 6000 once the additional supplies of cots and bedding were obtained. Following this war, Florence Nightingale established the first school devoted to teaching the nursing profession to female students, which she opened in 1860. She is also accredited with producing the first calender of diseases to help provide insights into their causes, be they seasonal or simply due to crowding of hospital facilities, and creating a number of administrative measures designed to maintain better records of supplies and make better use of space. For the first time, under her watch, patients for the first time received 24 hours a day service in the wards, due to her nighttime personal inspections and pass-throughs of the wards, holding a candle in her hand (an image made famous).
Crimean War history is also related to another page at this site, namely the work of William Aitken. Aitken served as an inspector and epidemiological investigator of the hospital sites once the war was over, in 1857. He produced a report on the war epidemics (which I own a copy of and plan to cover on a later date). His mapping of disease based on the earlier German maps, and Johnston’s map, was published in his massive two-tome set on world health. Aitken’s philosophy on disease patterns was a continuation of the nosology of disease defined by William Farr, Western Europe’s counter to the great landschaft medical geographers like Schnurrer and the great miasma specialist Canstatt.
William Aitken and William Farr
.


 .
.

 .
.

