When we look in detail at the process a person has to go through to experience a disease, or a diagnosis in need of a treatment, some methods of treating the illness make sense. But most of the methods employed to treat someone who is sick as designed lead the patient along one of various pathways to “the cure.”
The purpose and value of health care evaluations using statistical measures pertains mostly to the latter. The pathway that needs to be taken by a healthcare may not necessarily travel a route to “cure”. This is because we don’t actually know the process required to instigate the “cure”. We only know the best path to take to approach the “cure” of a disease.
The annual HEDIS review of healthcare systems is designed to evaluate the quality of care [QOC] by an organization or program, with the goal of improving the outcomes of care that an institution provides. As part of the annual HEDIS review, there are certain protocols that most or all Medicaid, Medicare and CHP programs have to engage in, in order to qualify for governmentally-approved coverage of these patients, in order for these agencies to pass the annual HEDIS inspect and have their contracts renewed.
More recent attempts by the Obamacare or PPACA program, now about to expire, mimicked some parts of these ambitious QOC minded goals, that I have been engaged in for nearly 15 years. In the beginning I strongly supported PPACA because it required targeted analysis of goals and accomplishments, and served to increase the development and use of electronic medical records (EMR) systems. In the long run, I felt such a goal made whatever analyses were engaged in for QOC more revealing of its failures and succcesses, providing strong evidence for why some of these programs should fail, whilst others may mess up and barely make it (ultimately failing the one year probationary status they are hand). This means the best insurance programs should ultimately outlast the rest, by remaining financially successful and highly accomplished health-services-wise.
PPACA was supposed to ultimately take scoring QOC the “make or break deciding factor” for a program, relying upon the demonstration of a program’s actual health care skills, not simply billing, reimbursement and complete payment successes. These skills focused on the individual and team work strategies that health care services work by in the care of patients. Ideally, it implies that an excellent health care system can effectively treat a patient and then discharge that patient at the right time . . . regarding the ability of that company to fully and appropriately treat a particular illness that the patient is being hospitalized or treated for.
In fact, this is also why one standard measure for nearly all institutions analyzing their care process is to measure the rate of return of patients to the hospital setting (first defined by Yale in the late 60s, early 70s I believe). This metric evaluated how many patients were readmitted for the same condition, usually within 30 days–a process known as readmissions. [The other standard measure for the time was number of open beds, per month.]
These studies taught us that patients who go into hospitals don’t leave because they were cured of their problem, usually. They are discharged because whatever health care actions are still needed on their behalf can either be performed by the patient himself or herself, or with the assistance of a family member and/or home nursing care assistant. (Some people claim it’s “to save money”, which is only true with regard to requirements for re-approvals generated by insurance companies.)
What PPACA started — the evaluation of outcomes of care as a means to measure success — took a turn for the worse when EMR value assessment became a part of the requirement for the healthcare company to be fully enrolled and engaged in PPACA or Obamacare, and insurance agencies were unwilling to comply. For hospitals, cost was only a factor regarding the type of software and hardware requirements that were needed to comply; the upgrade of IT systems and hiring new IT experts were a barrier as well, but only a temporary barrier. (Evidence of compliance within a health care establishment is quite visible; they utilize Health IT equipment when a patient arrives for care. Insurance companies, on the other hand, require internal systems to fully evaluate care processes engaged in clinically, in addition to and distinct from the regular review they have always engaged in regarding claims, cost and billing, using a completely separate — often by law — healthcare IT system.)
So, basically, the idea of being able to simply gathering your data into a database, and then reporting these data in a useful way seems simple. It is a primary requirement imposed on companies by the managed care systems in general, and in response to the HITECH Act passed by the George Bush [Jr.] Administration. In theory, any company could (and can) do it, given it has software and hardware that are required. But, for some reason, many companies could not do this simple IT task, leading CIOs, Directors and Managers to sometimes “fudge” on their data requirements, in terms of gathering, submission and reporting. [The last “meaningful use” fraud-ridden report was about two years ago, bu a company down in Texas, if I recall correctly.] These agencies, companies, facilities responsible for fraudulent reporting seem to forget, the primary purpose for PPACA is/was also to prevent fraud, with regard to reporting patient data, in particular, those double billing events and/or misbilling practices commonly cited for “care event not fully completed”.

The second and equally responsible reason for PPACA failures during the past 12 to 24 months is most certainly the failure of insurance companies to appropriately manage their data, and use it to develop a comprehensive population health surveillance and monitoring system. This is quite a generic claim for me to make, but my evidence for it is quite simple.
Companies remain focused almost completely upon PPACA requirements, such as reporting the required “meaningful use” metrics (usually just 40-80 per year). Meaningful use metrics, although important and designed to target large scale care practices and issues, demonstrate “favoritism” towards just a few diseases that people experience. Rare conditions are ignored through this process. Rare conditions that serve as high cost cases requiring lifelong high cost treatment and ongoing care related events, are for the most part ignored by insurance companies that devote most of the quality of care efforts to just meeting these few requirements.
This the reason for this venture of mine–to develop a workable model for evaluating manage care performance over a patient’s life time, per provider, facility and assocaited health care system or insurance program. This model I developed produces highly detailed analyses for patients at all of the AGRER (Age-Gender-Race-Ethnicity-Gender) and SES/spatial levels required for my level of statistical epidemiological surveillance and reporting work. In theory, the knowledge for how this is done can be developed by other teams, if they have the necessary human resources and highly skilled analysts and programmers needed to perform such a rare act for the typical health insurance (national-level) company. (I realize, they are same name, different COs and Directors).
National health insurance companies refuse to employ the needed surveillance processes, and comply almost entirely with just PPACA Meaningful use like reporting requirements, because they have not fixed the management, employed new innovative minds in order to produce an effective population wide, spatial surveillance system, for all kinds of health risk groups, not just the Meaningful use groups, not just the HEDIS defined groups.

So that is my complaint about the insurance system and why INSURANCE COMPANIES are primarily why the recent HITECH derived goals in managing health care area not being reached by the major payers for these services. Those which did not sign onto PPACA were either afraid they could not reach this goal requiring improvements in their processes and/or technology, or were truly incapable of not reaching such goals. Like laggers in a herd of buffalos, they pulled this healthcare system back towards the remains of much older members. The patient’s “best health” was not in mind; it was up to them to provide “the best health service” for the money.
Nearly everything done in medicine is “practiced” with the goal of “curing” in mind, but in reality is perceived, performed and measured as part of a route taken towards this ultimate destiny. The goal of many programs, as defined by insurance companies management, is to provide the best quality of service for the moment. If that means your surgery is delayed because a part of you “isn’t gangrene yet” (i.e. abdominal or hiatal hernia), their system deemed that decision the best in the patient’s interest, in combination with the best in the company’s interest. [This is an argument we have heard many times before.]
In health care, the way the health care system operates, the way that the process of caring and “curing” is carried out, there are really just a few kinds of activities that happen to every patient, relative to how he or she spends his time, makes the trips that are necessary, and either accepts or denies those processes by which “medicine” can be “performed” and “practiced”.
That is what this part of my review covers regarding how to score the success of a health care program. Ultimately, it related to how much health will cost the system for the same illness with different consequences or different methods of treatment.
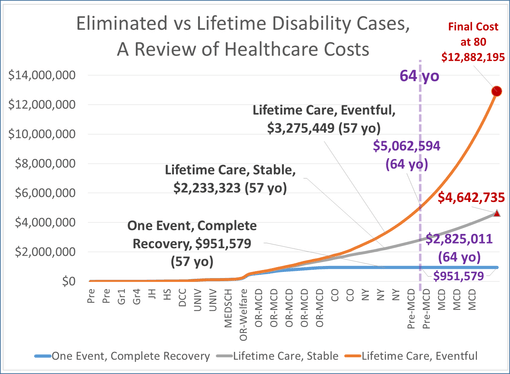
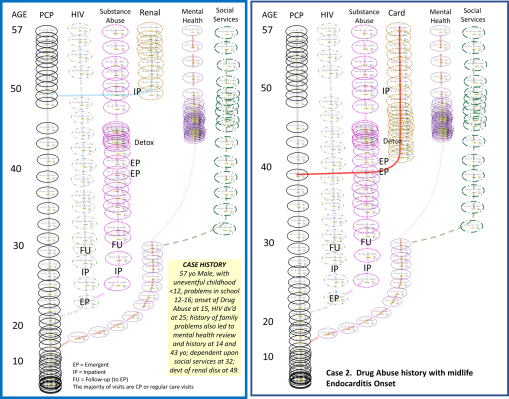
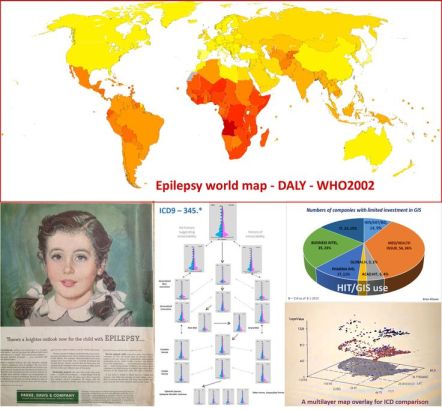
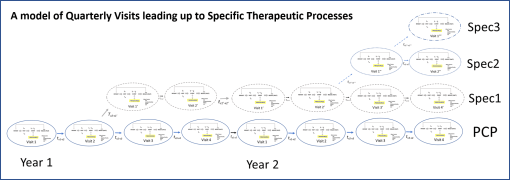
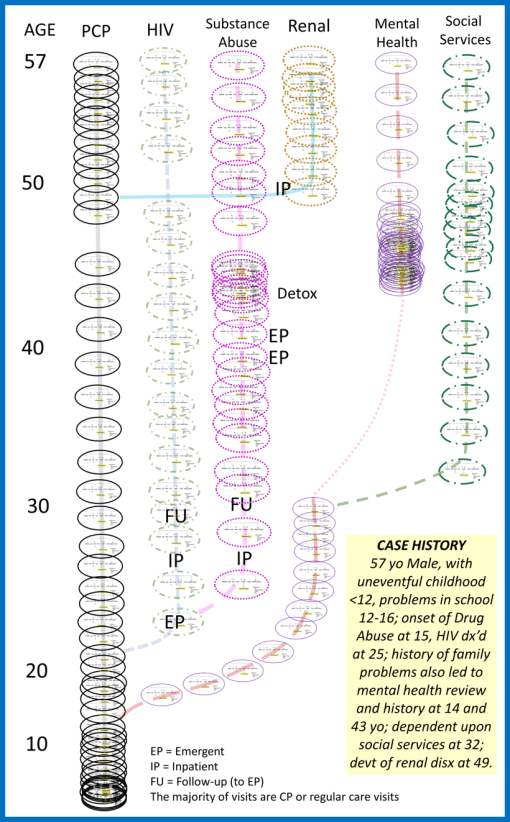
The above is an example of lifelong epilepsy care. I’ve posted this model several times at different sites. It is based upon an evaluation of costs accrued for treating a lifelong condition, derived from true time, true healthcare procedure and cost derived data. [LINK to this earlier posting on this site, and my other site devoted just to this topic.]
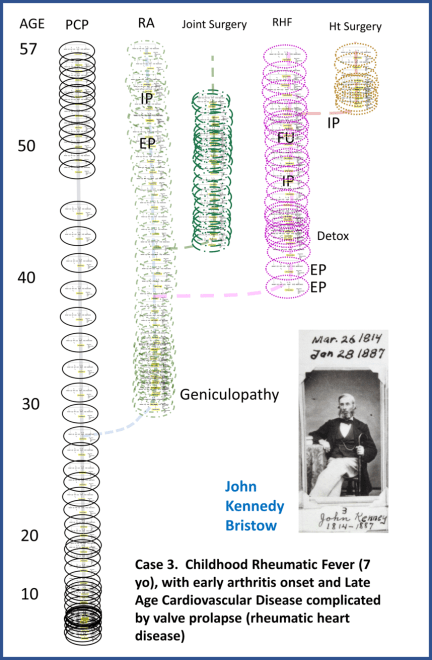
An effective allopathic health care system has two parts to the initial care process, and a third for highly advanced cases. There is first the regular doctor in Internal Medicine or Family Practice, and/or the generalized care giver who is a specialist, like a pediatrician, a gynecologist, a geriatrics expert. Second, there is the specialist who treats you for your special chronic or aging disease problem–usually specialized in one organ or organ system–the cardiologist, neurologist, nephrologist, oncologist, etc.
The third part of allopathy is that specialist devoted to a life threatening or life-shortening malady, the quality of life experts who are involved with skilled nursing, improving quality of life, and improved end-of-life healthcare strategies.
Then there are those non-allopathic “healers” we all learned to rely upon, ranging from family member(s) to licensed specialists, like the osteopath, naturopath, chiropractor, traditional chinese medicine practitioner, acupuncturist, etc. There are also the LPNs, and midwives serving patients where their practice is allowed.
This definition we provide for “specialist” is a cultural one. In the U.S., and in a non-traditional sense, a specialist can also be a shaman, curandera, midwife, yerbero, Christian scientist, or laying of hands/intercessory prayer practitioner. For each and every patient using nurses, doctors, specialized the doctor ultimately becomes the person we want him or her to be for us. Those methods of practice which we believe in, and allow to be “practiced” upon our body (or mind-spirit-soul connections) , play a most important role in whether or not medicine will “work” on [in] our body or not.
The current process for health care can be evaluated and measured by looking at how many ways we try to be cured, how many actions we engage in with this hope, who and what kind of healer we are engaging in these processes with, and how many steps does it take to go through these processes, what exactly are these processes and how and why we allowed them or selected them.
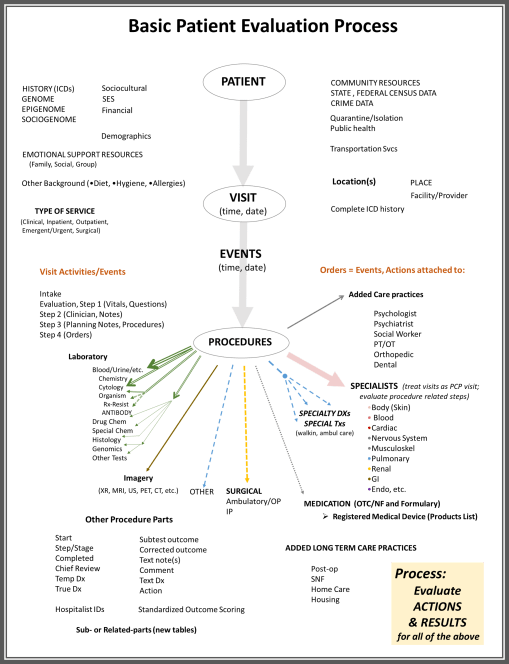
In the health care information technology system, analyzing a person’s healthcare receiving process involves analyses of the person or patient, the illness, the visit to the doctor for this condition (how often, to receive what form of care), what events the patient goes through alongside that practitioner, and what formal medical procedures are attempted as part of the health care “practice.”

The steps one goes through when being “treated” seem unlimited at times. In a simplistic review I recently did of 95,000 types of procedures that doctors get engaged in, I was able to determine that there are essentially 20,000 to 25,000 of these procedures that are most important and appear for many people. The remaining procedures are additional or adjunct processes that are engaged in for fewer people, when the basics do not work.
These procedures don’t include the typical human-to-human interaction related behaviors, such as educating a patient, giving the patient something to keep a record with, providing an explanation for what needs to be done next and then forwarding that patient to the next specialist in charge of labs or x-rays. These “actions”, that don’t involve any scientific measurements used to evaluate health based upon numbers, constitute ideas and activities that are shared and often happen with the doctor, nurse, technician, counselor, and patient.
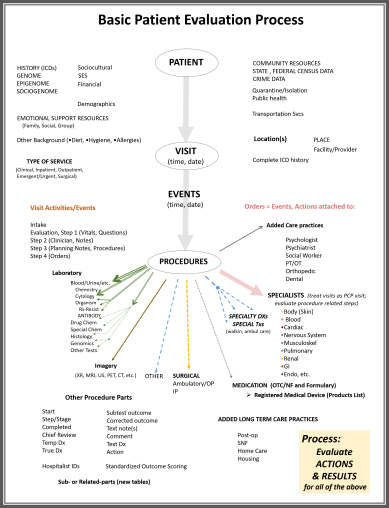
In the simple flow chart illustration drawn up for this procedure, above, some basic examples of these types of steps are provided, under the Laboratory and Imagery lists. The visit activities and events detailed briefly are each and every procedure or thing a doctor does while he/she is serving you. In a good health care information technology system, every behavior a doctor becomes engaged in can be monitored. These data are kept in the registry of the visit for that day, for use by many health care providers, then billing agents, then insurance companies, to see what has been done. In the end, little of these processes are paid much attention to, except with regard to how the care process might be billed. This action may be taken to develop a detailed accurate history of the health care process, and a detailed listing of what was done, to determine which of these are approved for the billings processes.
Until recently, mostly insurance and billing agents have paid attention to these data–in their entirety. Very few individuals interpret their logic. For example, it is possible to determine if a set of actions taken are the best actions to be taken for that care process. These types of measures are rarely delved into, within past HMO as well as current managed care programs. But such a detailed review of the healthcare process can be done, to determine where during an office visit a delay cost the company twenty minutes in patient care time involving an examination room, or when during the hospital stay too much time elapsed after a test was ordered and the actual test performed. It is possible to evaluate a series of healthcare related activities, by the minute, with the new data systems being developed.
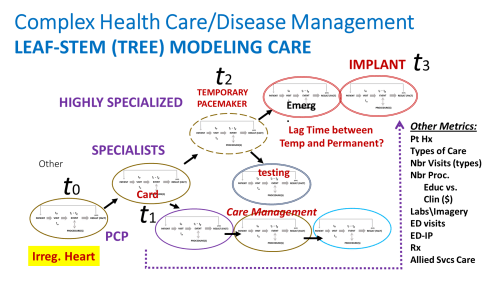
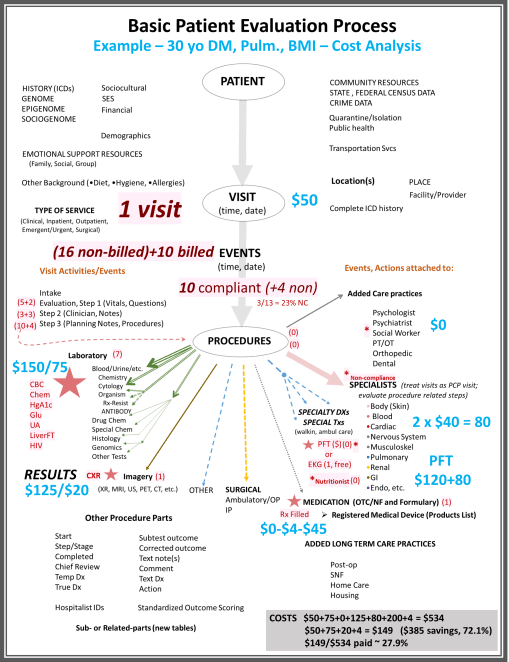
The following figure is a model of the processes that are engaged in with a single visit, regarding a single set of healthcare operations. It details the measurables or metrics that may be analyzed for each of these visits.
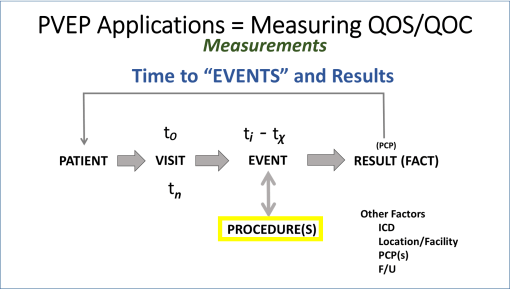
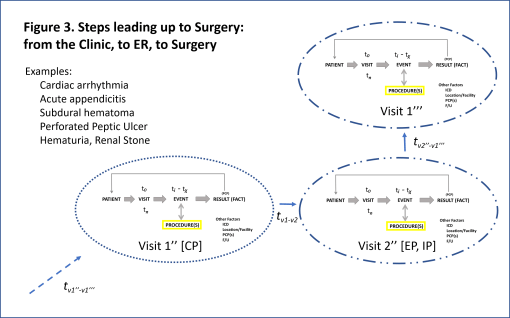
PVEP = Patient-Visit-Events_Processes or Procedures; QOS=Quality of Service; QOC=Quality of Care; PCP = Primary Care Practitioner; ICD = International Classification of Disease (referring to a disease code or identifier, or group thereof); F/U = Follow-up.
We can measure patient, physician, practitioner, and health staff related events, what they are and what they are intended to measure or influence, when they happen, with what steps and physical parts engaged in this process, and what outcomes are occur with such processes.
Example 1
A patient with a specific history, experiences a specific series of medical or health related occurrances, resulting in the need for the visit, and then care; and then during that visit, undergoes numerous processes by the healthcare staff to be fully and effectively “treated”.
Examples of “Events” that occur with each visit are as follows:
- patient is greeted, visually identified to be present
- patient fills out a form (if new)
- patient undergoes health queries
- patient fills out insurance/payment form
- patient fills out personal identification related info, such as race, etc.
- patient validates identity
This patient then sits down and waits for his/her name to be called.
- The patient gets called into the clinic and is led to a room
The patient sits some more, then the nurse of PA comes in, followed by:
- initial hello and reason for visit query
- question regarding other health items that may warrant attention
- question concerning mental health or general attitude
- information about health related habits, like smoking, alcohol consumption, coffee or tea consumption
- information on prescription drugs
- information on over the counter drugs or nutritional supplements being taken
- information on other health care practitioners that may be seen
Up until this moment, every event that has happened is a procedure, which if entered onto a healthcare history reporting screen for the patient, ends up receiving a time-stamp for the event. Some events are saved in parts. Like if the smoking, alcohol and coffee or tea consumption are answered, and then saved, followed by the two question based mental health query. A “No” for the latter, indicating the patient is “not happy” would then require a follow up mental health query asking five to seven more questions, a data entry entered separately.
Next up are the vitals, of which Temp, Pulse, Respiratory Rate, and Blood Pressure are measured, each one entered separately as one event, each with its own procedure code or other form of identifier, in the form of text or number.
A few minutes pass. The regular doctor returns, and follow up on the history and review the new observations made, in reference to any past historical information that exists in the patient’s electronic medical records.
The doctor leaves the clinic, and then returns with the orders ready to be stated or given.
- Labs are ordered
- A diet change may be recommended, and an information pamphlet describing it provided
- exercise may be recommended
- consideration of a screening for a new blood test (HIV) or an update on the immunizations
- recommendation for of a flu shot is given
- a visit to a counselor or specialist regarding a special medical state may be recommended
- consideration of a screening for cancer is recommended
- prescription is suggested; which, if the patient agrees with, the MD can enter a request on line in front of the patient for initiating that therapeutic process
Once all of this is done, the doctor then clicks on a box indicating all entries are made, and that this part of the visit is over.
In the minutes, hours, days ahead, as the patient completes each of these tasks, those actions are also noted in the electronic medical records [EMR]. Time stamps are provided for each of these events.
While still in the clinic:
- an EKG is then done by a medical assistant
- B/P is retaken.
- More educational material is provided.
The patient is suspected of having a heart problem, so now has to see a cardiologist as soon as possible.
As the patient leaves, passing the billing clerk, the final steps are taken to close the event for the day, and a new appointment is made, a process also time stamped in the EMR.
Follow-ups to each of the requests by the physician are expected to occur once the patient leaves. If successful, the following may be entered into the EMR by other allied health people regarding these later data points:
- outcomes for labs, including tests requiring patient commitment, such as early morning fasting blood glucose levels,
- the results of the Xray visit and requested dyes process (when it began and ended)
- the radiologist’s report on these images.
- fill or refill of a medication
Also, those that are missed are not entered, and their non-engagement gets documented during the next visit.
No visit to the counselor is documented, by either a counselor or the patient during the next visit with the primary physician. If a second opinion was requested, once approved, that would be assessed as well by or during the next visit. The use of a health monitoring/reporting program for quality of health assessments (daily B/P and pulse, length and time run per day, post-run pulse, etc.) may be managed by an internet server or wearable device. Dietary notes and other records kept in the form of structured and/or non-structured data can be analyzed for a perspective on the patient’s self-directed “health consciousness”, between visits.
The next visit validates which of the prior recommendations the patient adhered to, adding its own notes of events that take place during this follow-up visit three months later. It also reinitiates this entire review process from the beginning. When these visits are reviewed in relation to each other, and in relation to other forms of care the patient is receiving, we are able to evaluate the quality of care that patient is receiving, and producing for himself/herself.
Most importantly, long term care processes for very sick people with multiple disease histories can be evaluated using these same processes.
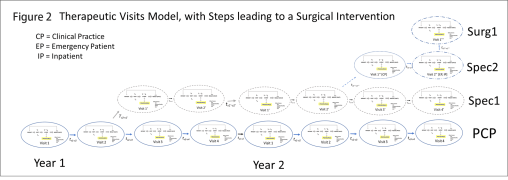
Example 2
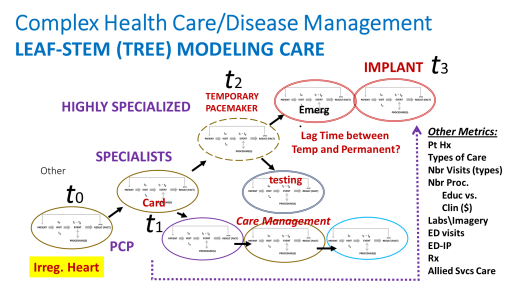
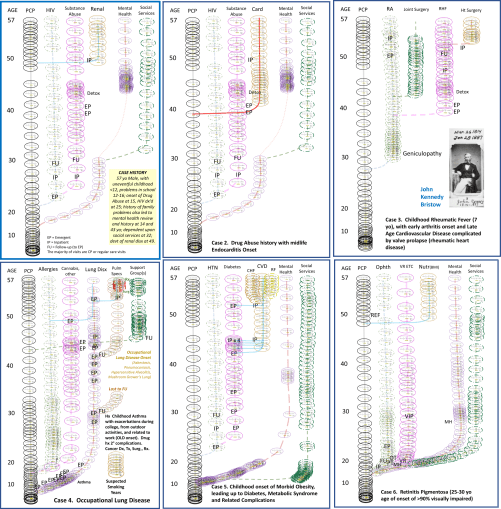
The above is a complex case, where the patient sees a regular physician, but then must see a specialist due to an unexpected event like atrial fibrillation detected by EKG.
As a result of this diagnosis, the patient ends up undergoing a new set of visits, most defined by the impending health failure problem.
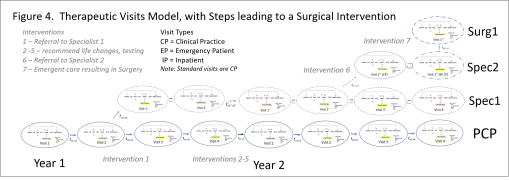
Each of the ovals in the above figure represents the same subgroups of procedures that occur as a “single visit unit”. Also noted in this model is the more expensive specialized, surgical care for a patient with an unhealthy atrial fibrillation-atrial flutter state, and the long term actions that are engaged in as continual care for this case. These additional events serve to increase the lifespan of the patient, and to improve the quality of that life during the remaining end-of-life years.
These processes depicted in the above figure include the following care related processes:
- continued care by the regular practitioner
- continued care management for other borderline or actual medical problems
- cardiology care visits
- implementation of a temporary ventricular fibrillation apparatus
- evaluation and preparation for possible permanent implant of a device to treat arrhythmia, with or without the defibrillation option
- Completion and follow up care for each of these processes
- Visits with a specialist in order to more fully manage both the chronic disease and cardiac care.
- Visits with a nurse and/or social worker for reasons related to living place requirements and needs (can the patient live at home? of in a long term care facility? or skilled nursing facility?)
The evaluation of each of these processes, their timing, their outcomes, the fact that they happened, can be done using EMR.
For further background on where these data are coming from, most of the events related to a visit are in the form of office and care related procedures, kept track of by the EMR system based upon identification of the form type and content typed in by the practitioner, and the time stamps for these entries once the entries are completed and saved.
More on these Processes
A fully documented health care process involves about 0.5M possible “actions” that can be documented (but usually just a few for each visit), with 20,000-100,000 processes or “procedures” that can possibly be done. These focus on the basic lab tests such as blood, urine, and other body fluids tests, immune system tests and results, biological or organism culture tests and their results, genetic screening outcomes, etc. The second most commonly utilized diagnosis process, specific procedure and hardware wise, are the imagery processes and the like, such as X-ray, MRI, ultrasound, CAT and PET). Unique energy-derived measures such as EEG, ulnar nerve activity, functional neurological PET scanning, and the like are also specific procedures that can be documented, counted, assigned values to regarding outcomes, and then statistically compared.
This means that a single visit might engage a doctor and nurse or staff member a few times, result in a few tests, with a few dozen or more results reported, followed by dozens more data forms related to follow-up notes and external care, such as allied health care related events, walk-in procedures, social service related processes, and other health procedures requiring additional approvals.
This means that one patient, one visit, can results in dozens to hundreds of events and procedures. Most of my reviews of patients-visits-procedures depict ratios of about 3 to 7 same coded visits per year for patients on the average, with a 6 to 10 count for the most basic procedures engaged in per visit. Depending on the procedure, it might have only 6 to 10 rows of data per procedure and event (i.e. a scan process from start to dye injection to finish), or 40 to 60 rows of data (a 40-60 part comprehensive blood test). In the most basic numbers, this means the patient has one visit with 6 to 60 procedure related processes for the one visit, plus whatever other procedures are added to this value based upon the other procedures performed.
In terms of billing, only some procedures are billed. We don’t bill a patient for the time to find and hand him or her the educational materials for example. Relating this to billing and billable times, only certain parts of these actions and procedures are attached to the billing claim. A tentative estimate of ratio of unbilled to billed events is 1:1 to 2:1, for the “average unhealthy person” [I will discuss this topic more at a later time, once this calculation is run on new data.]
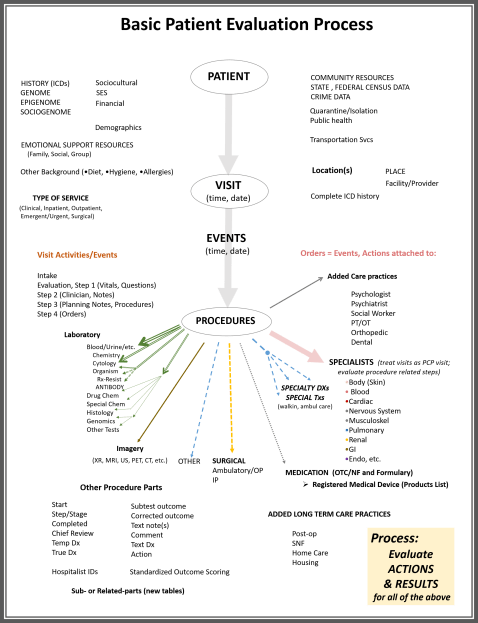
This simple model details only basic activities engaged in during the healthcare patient-visit-event-procedure (PVEP) process. A more realistic model would have up to twice as many visit related events, and 3 to 5 times as many procedures, with that value increasing exponentially with each chronic disease that the patient experiences.
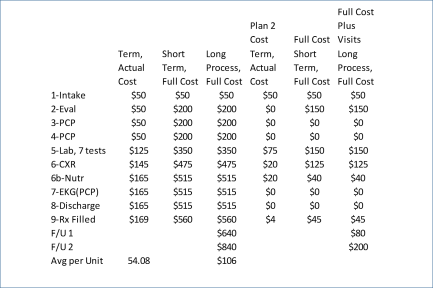
The following depicts how costs may be attached to this process, for one theoretical patient-visit-events-procedures scenario. The example is of an obese, prediabetic patient, with weight-induced sleep apnea, a possible history of allergies and respiratory complications, possible asthma. The PFT is a Pulmonary Function Test performed to evaluate his/her inspiratory and expiratory flow patterns, for diagnostic purposes. The patient refuses the PFT and several preventive care program recommendations.
The costs are, of course, “theoretical”.
Final Thoughts:
This model is my invention, 2016, and is a product of analyzing ‘Big Data’ for 35B EMR PVEP rows, 11M patients, in a 50×80 mile area.
- VPR’=9.77
- EPR’=187.89
- EVR’=19.21
- RVR’=86.59
- RPR’=846.55
- RER’=4.505
(P=patients, V=visits, E=events, R=rows, R’=ratio)
[TO BE CONTINUED]